Download as PDF, PPTX


![Micromechanical Formulations
Inplane shear strength in MPa can be calculated by using
Chami’s prediction as
𝐹 = 𝜏 𝑚𝑢 𝐶𝑣[1+ (Vf-√Vf)(1- (Gm ⁄Gf)]
τmu is the matrix shear strength in MPa, Vf , is the fibre volume
fraction, and Gm and Gf are the matrix and fibre shear modulus in
GPa respectively. Cv is a factor representing the voids in the
system.
According to Rosen’s prediction, shear strength is modified by
introducing composite shear modulus and the shear strain and
the formulation is
τcomp = F tanh(γG12/F);
G12 is the composite shear modulus in GPa, γ, is the shear strain at
failure. (E J barbero;Design with Composite Materials;CRC Press) 21](https://image.slidesharecdn.com/finalvivafinal-200621181343/75/Preparation-and-characterization-of-self-reinforced-fibre-polymer-composites-with-emphasis-on-the-fibre-matrix-interface-21-2048.jpg)
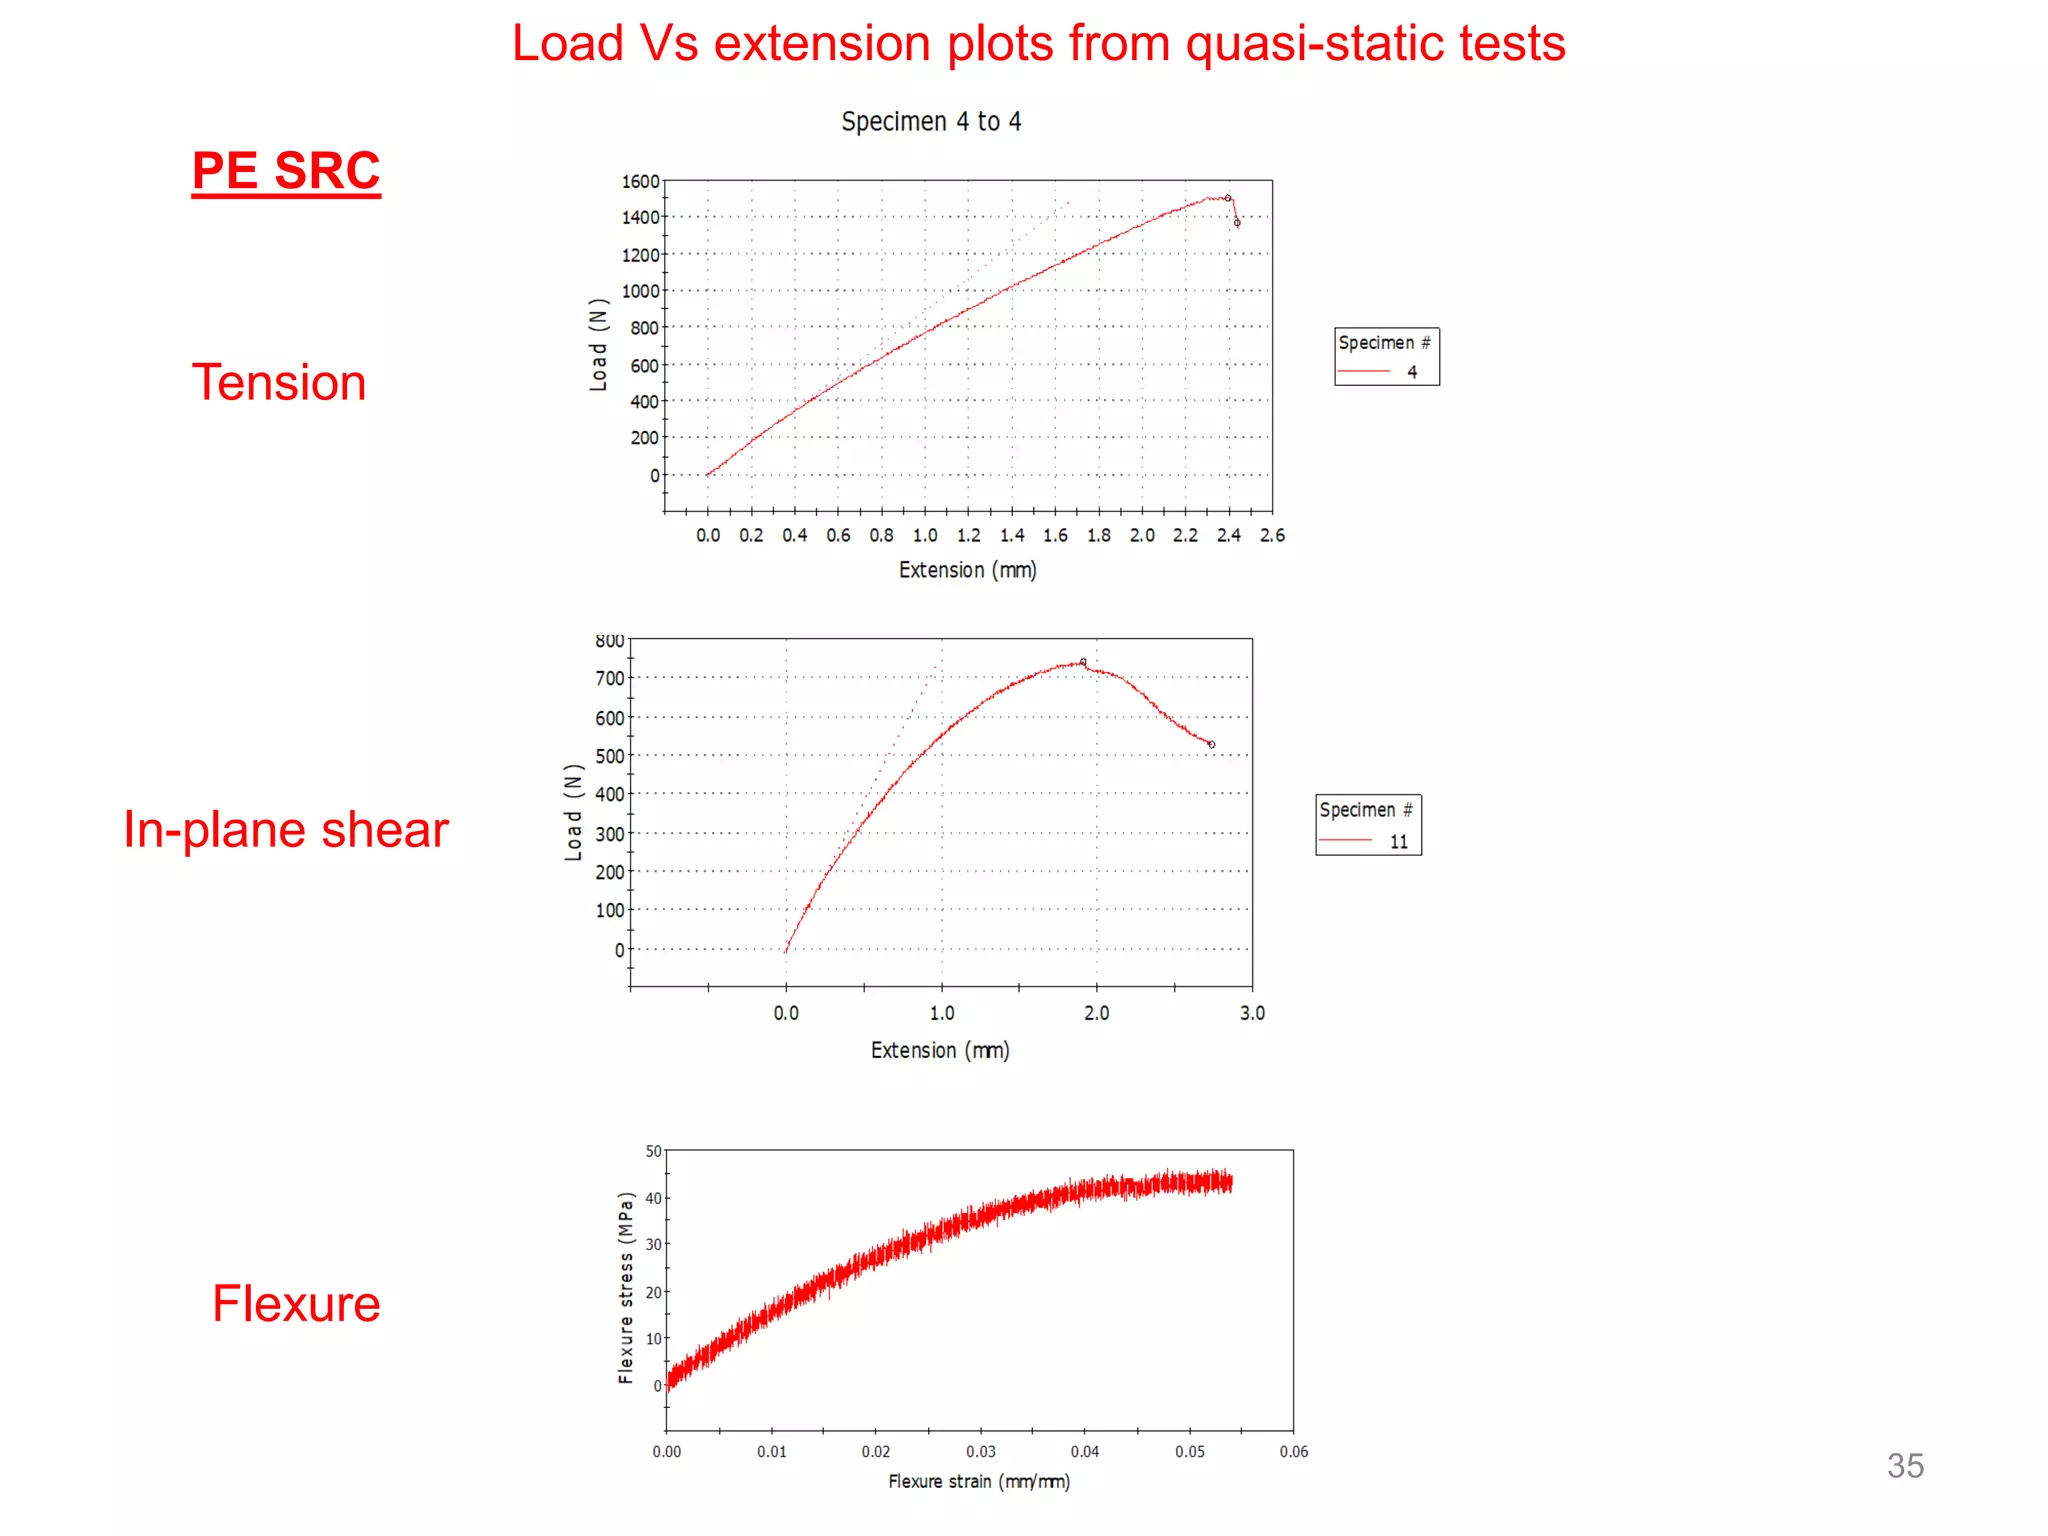
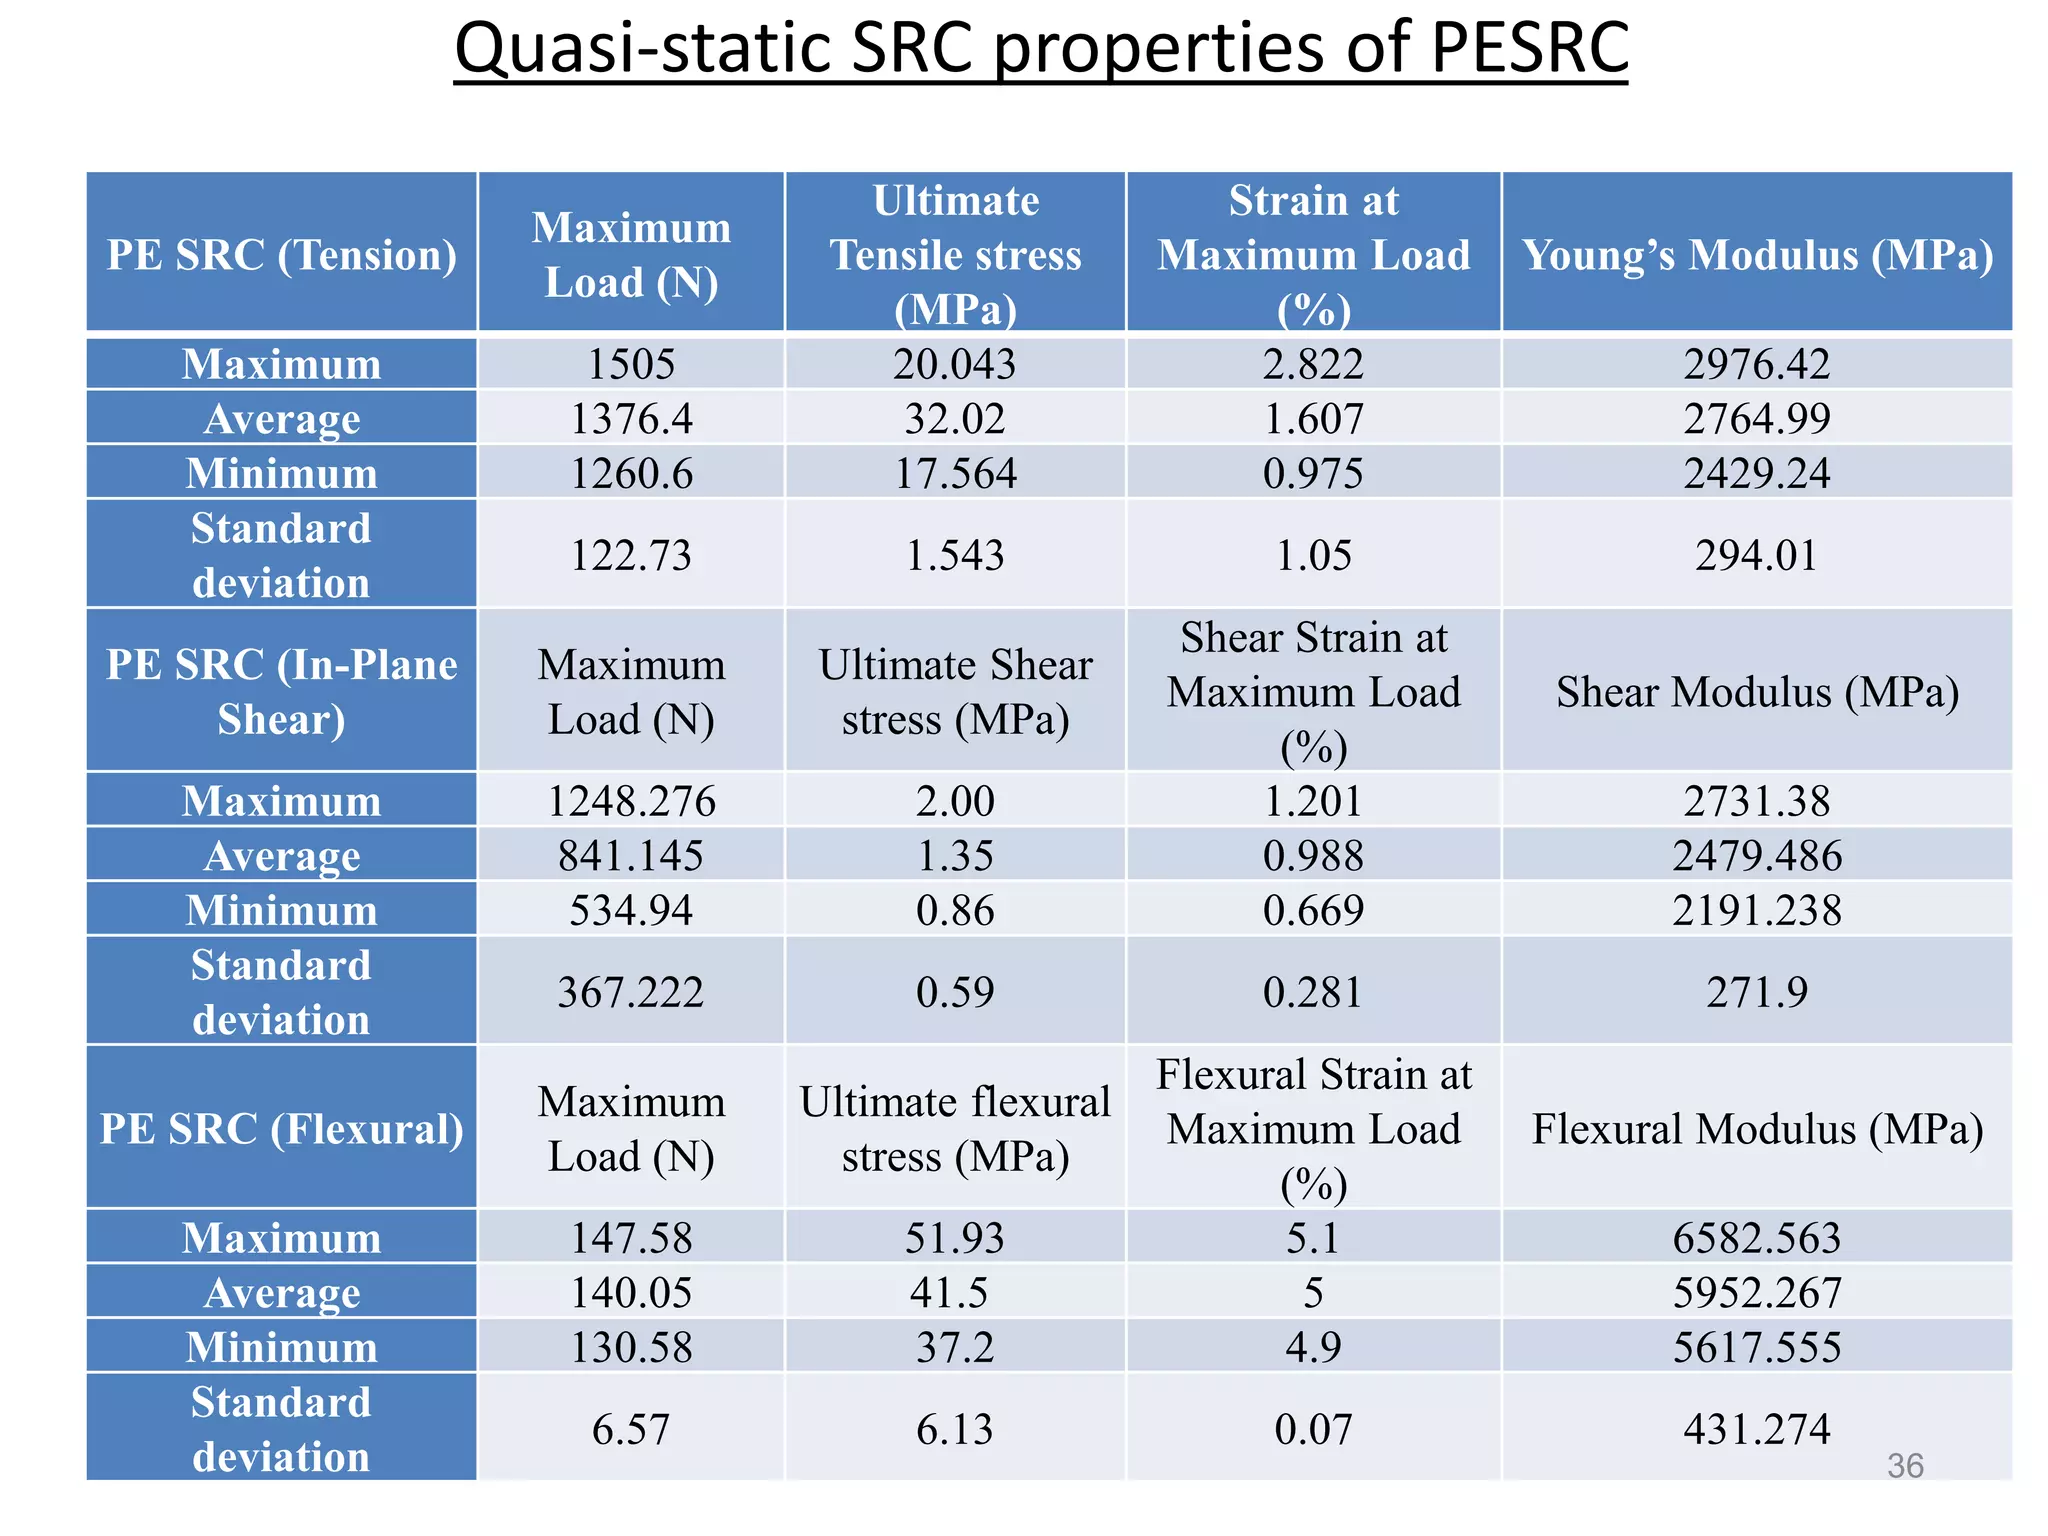
![Quasi Static Tests
Tensile Tests were conducted with standard
specimens. It was necessary to follow the procedure
set out in the standard D 3039 / D 3039 M – 95 A
proposed by ASTM.[30]
Flexural Test with ASTM D 790 M was followed
for three point bending test [31].
In-plane shear Test determines the adhesion
between the fibre and the matrix. Two notches are
made in each sample at 12.5 mm from the half-
length on either side .
34](https://image.slidesharecdn.com/finalvivafinal-200621181343/75/Preparation-and-characterization-of-self-reinforced-fibre-polymer-composites-with-emphasis-on-the-fibre-matrix-interface-34-2048.jpg)


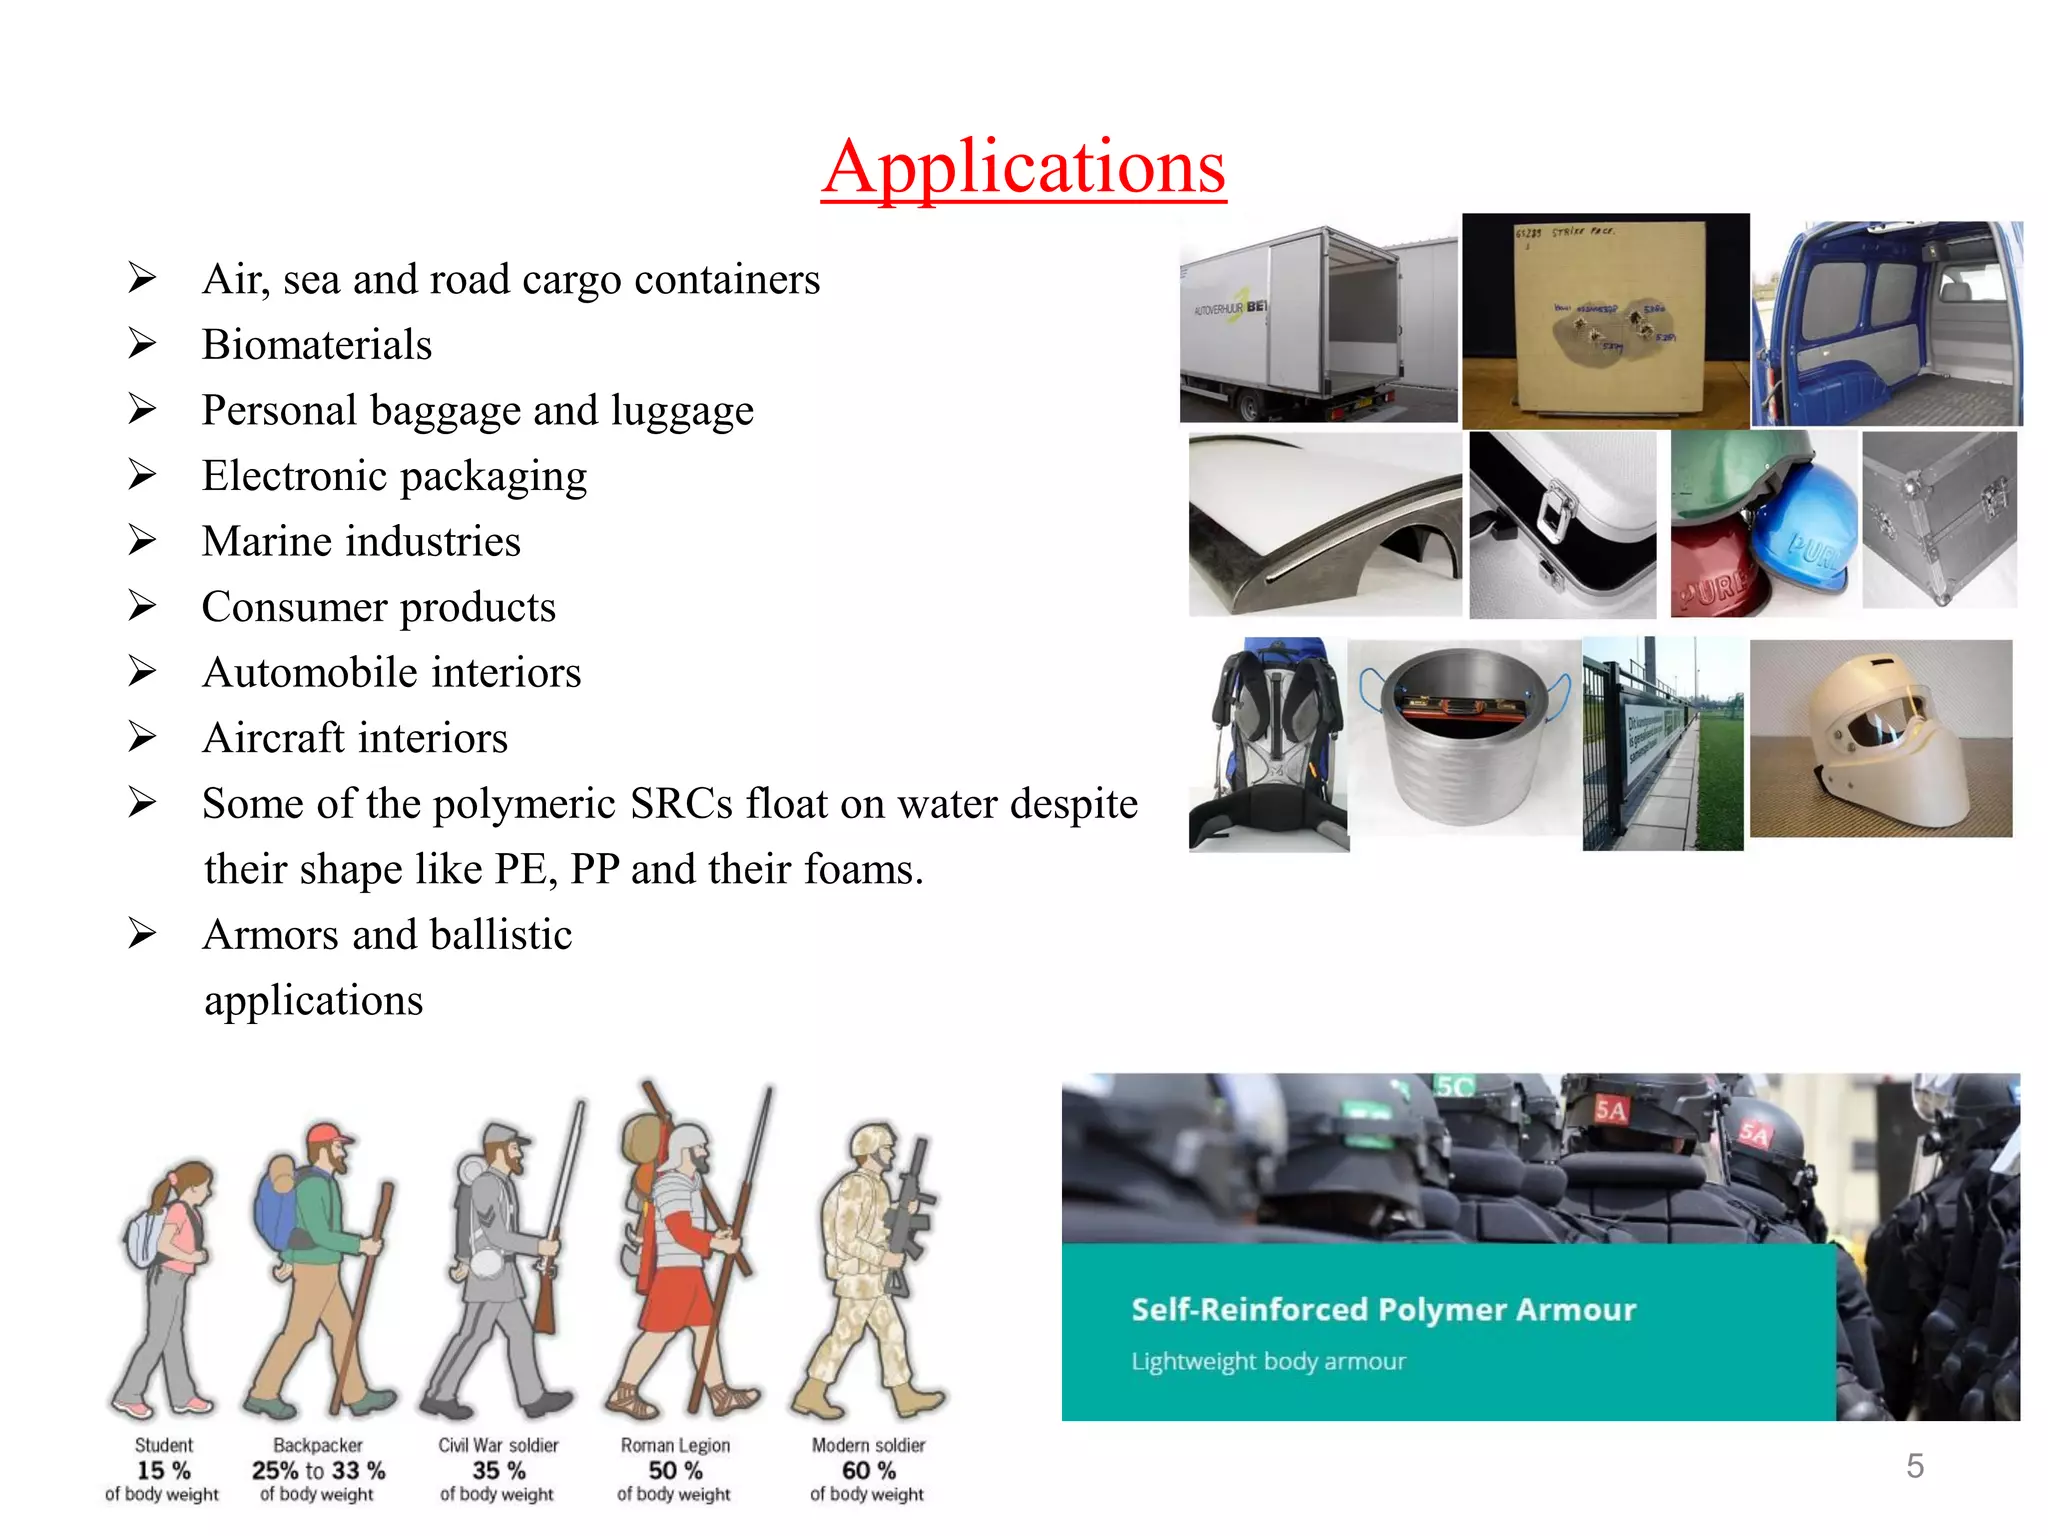
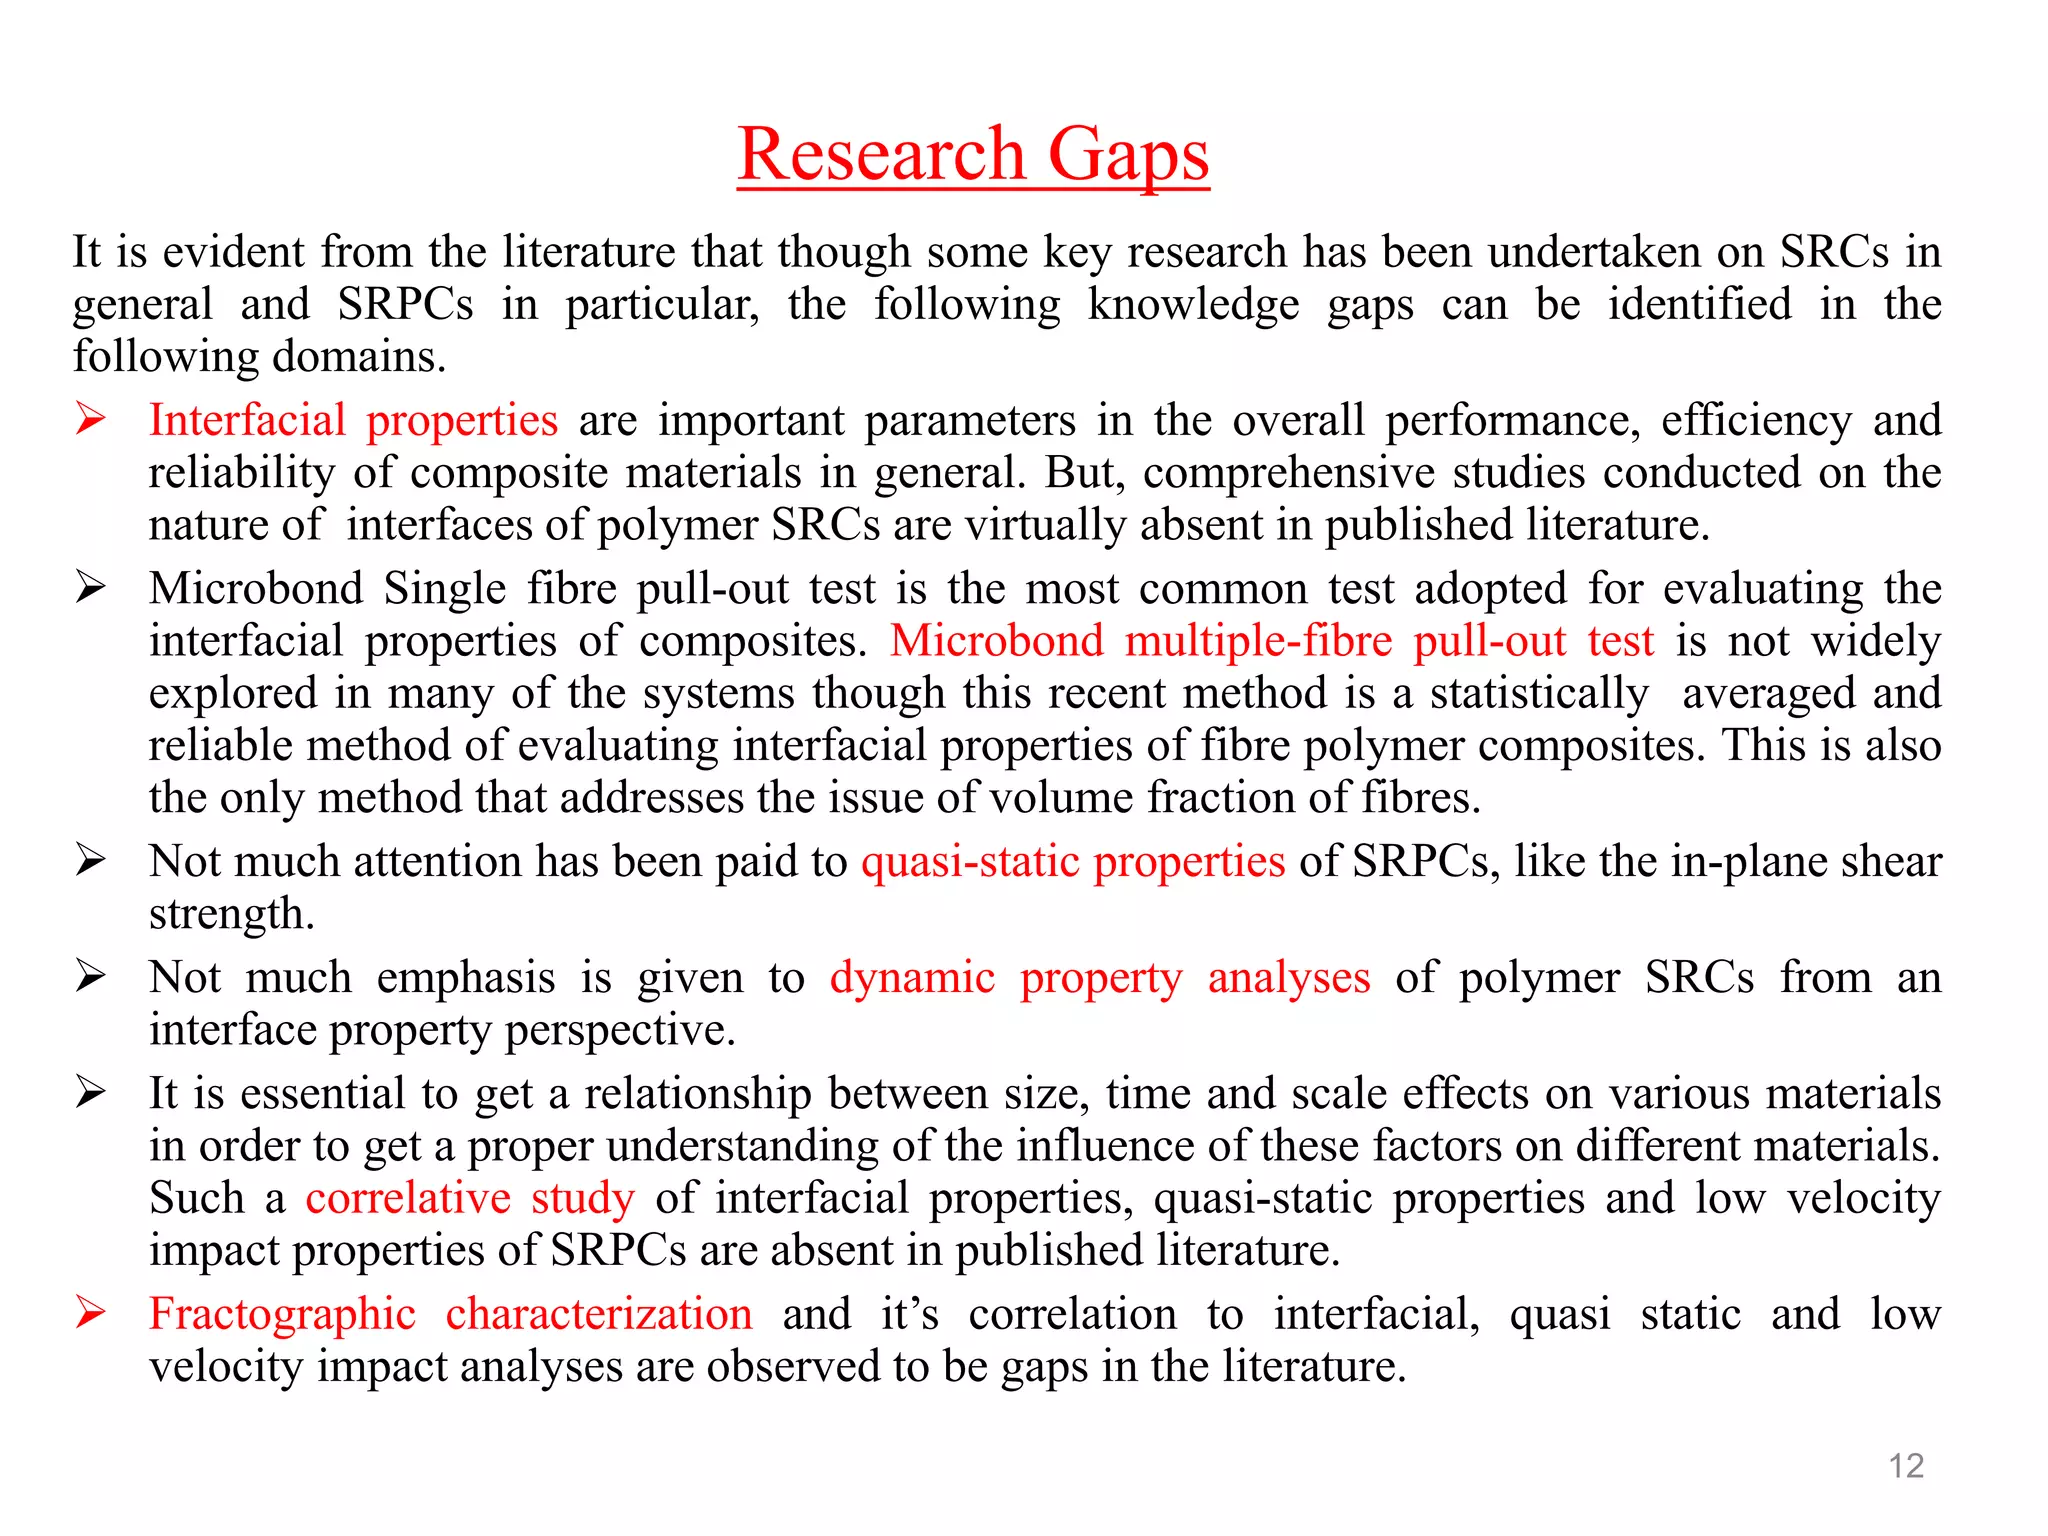
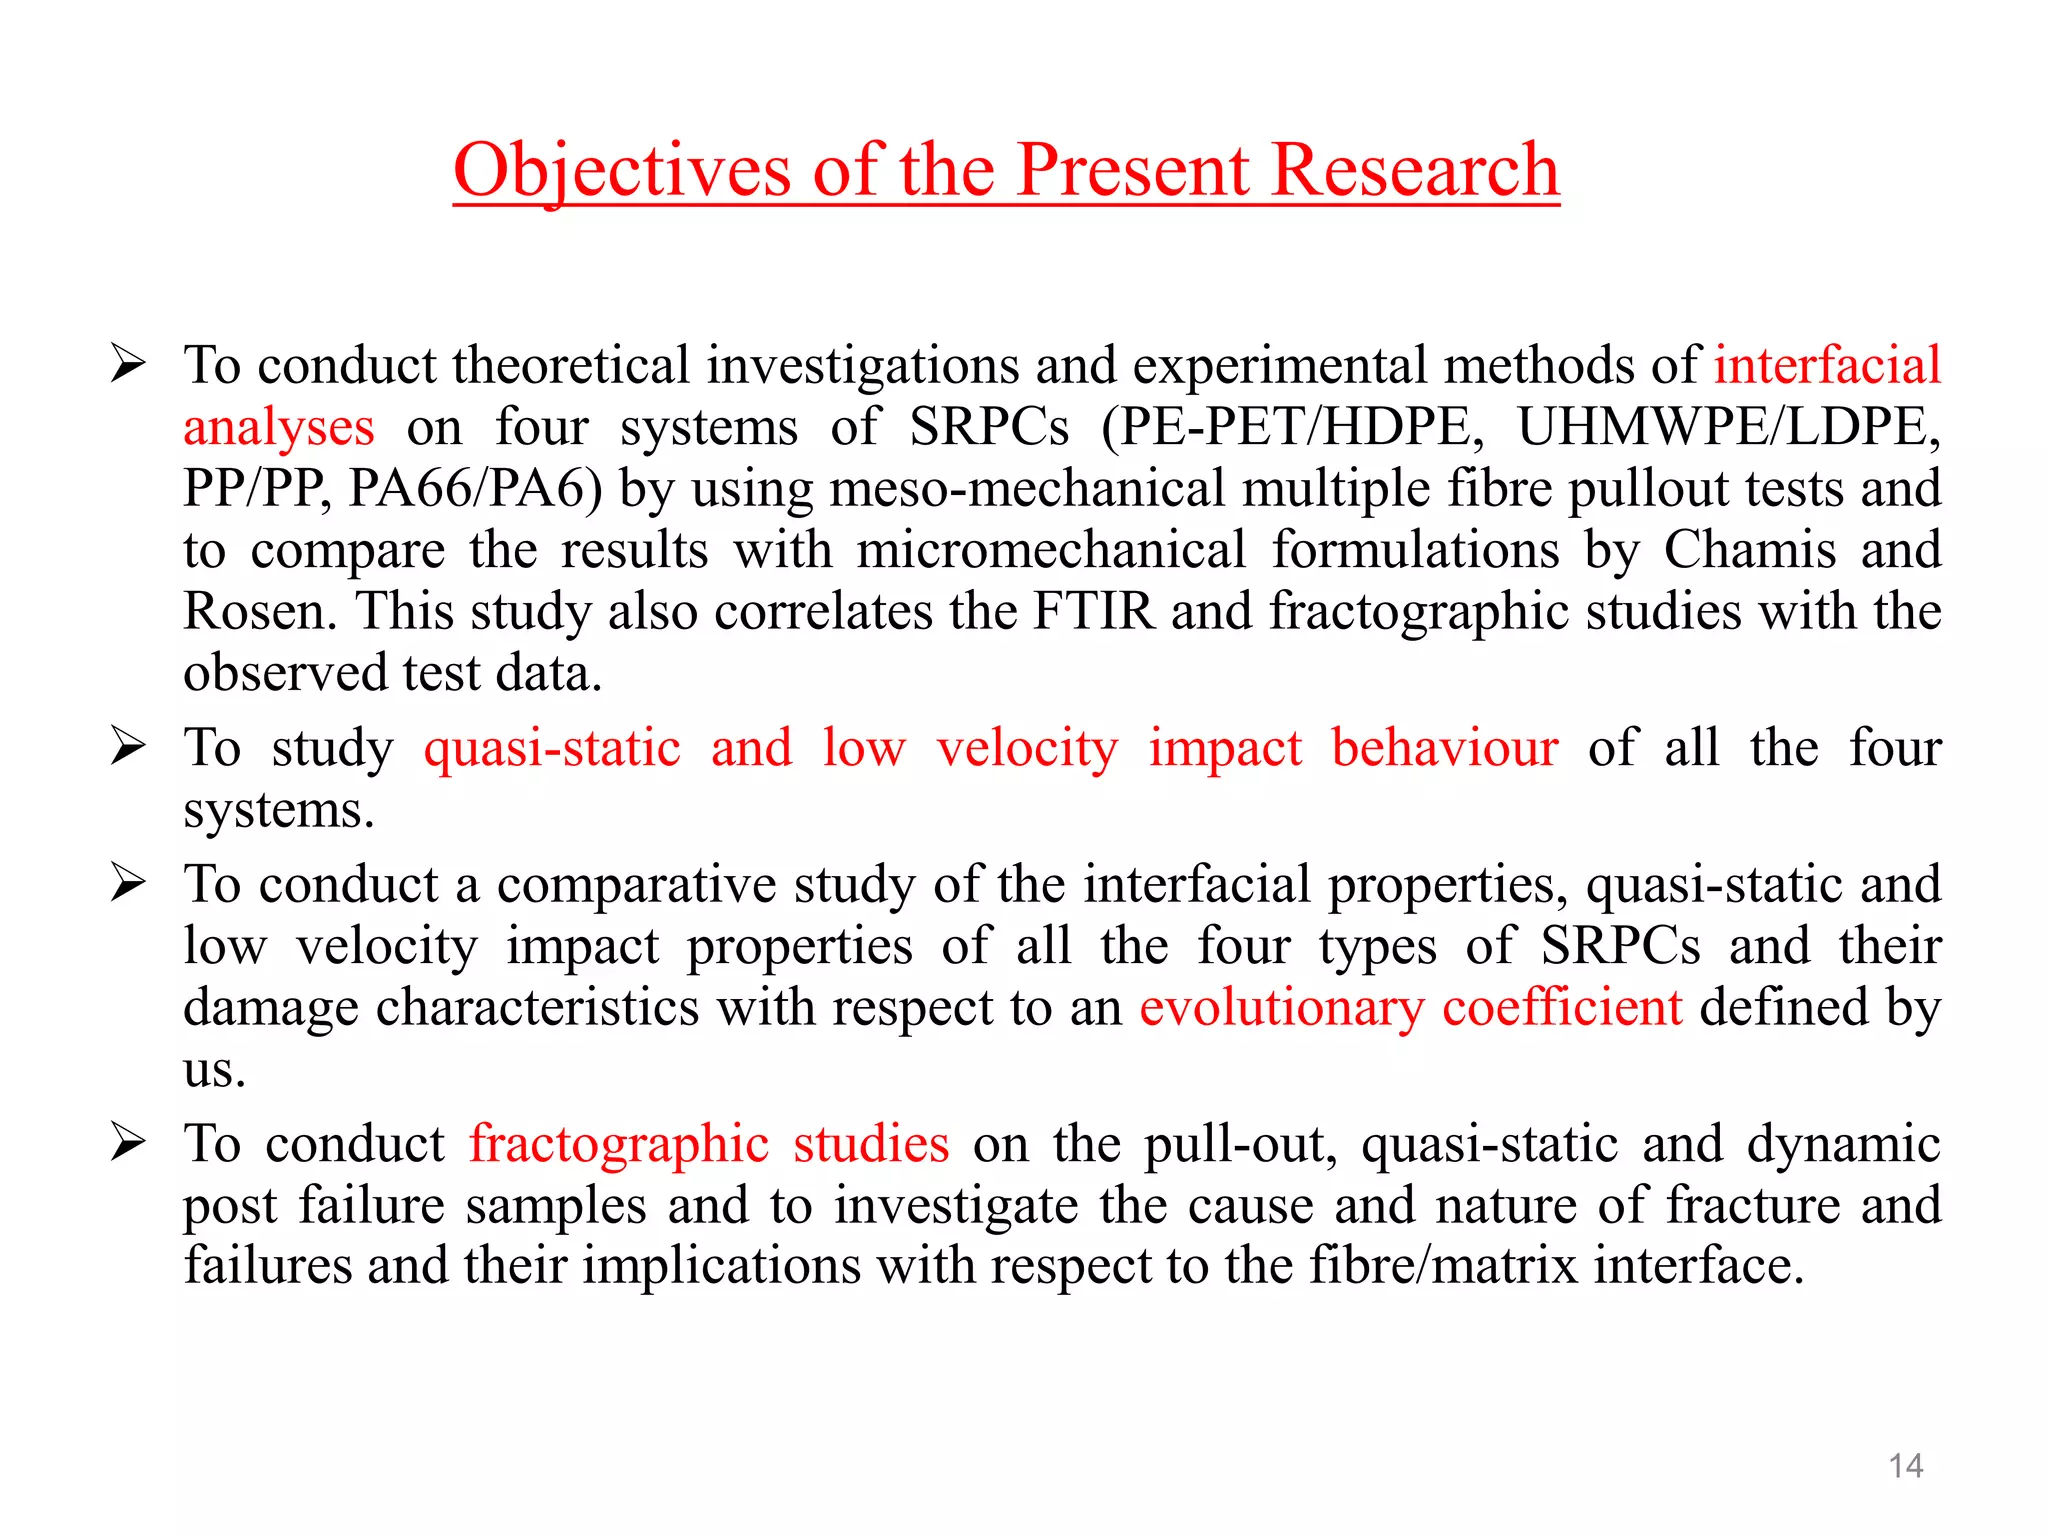
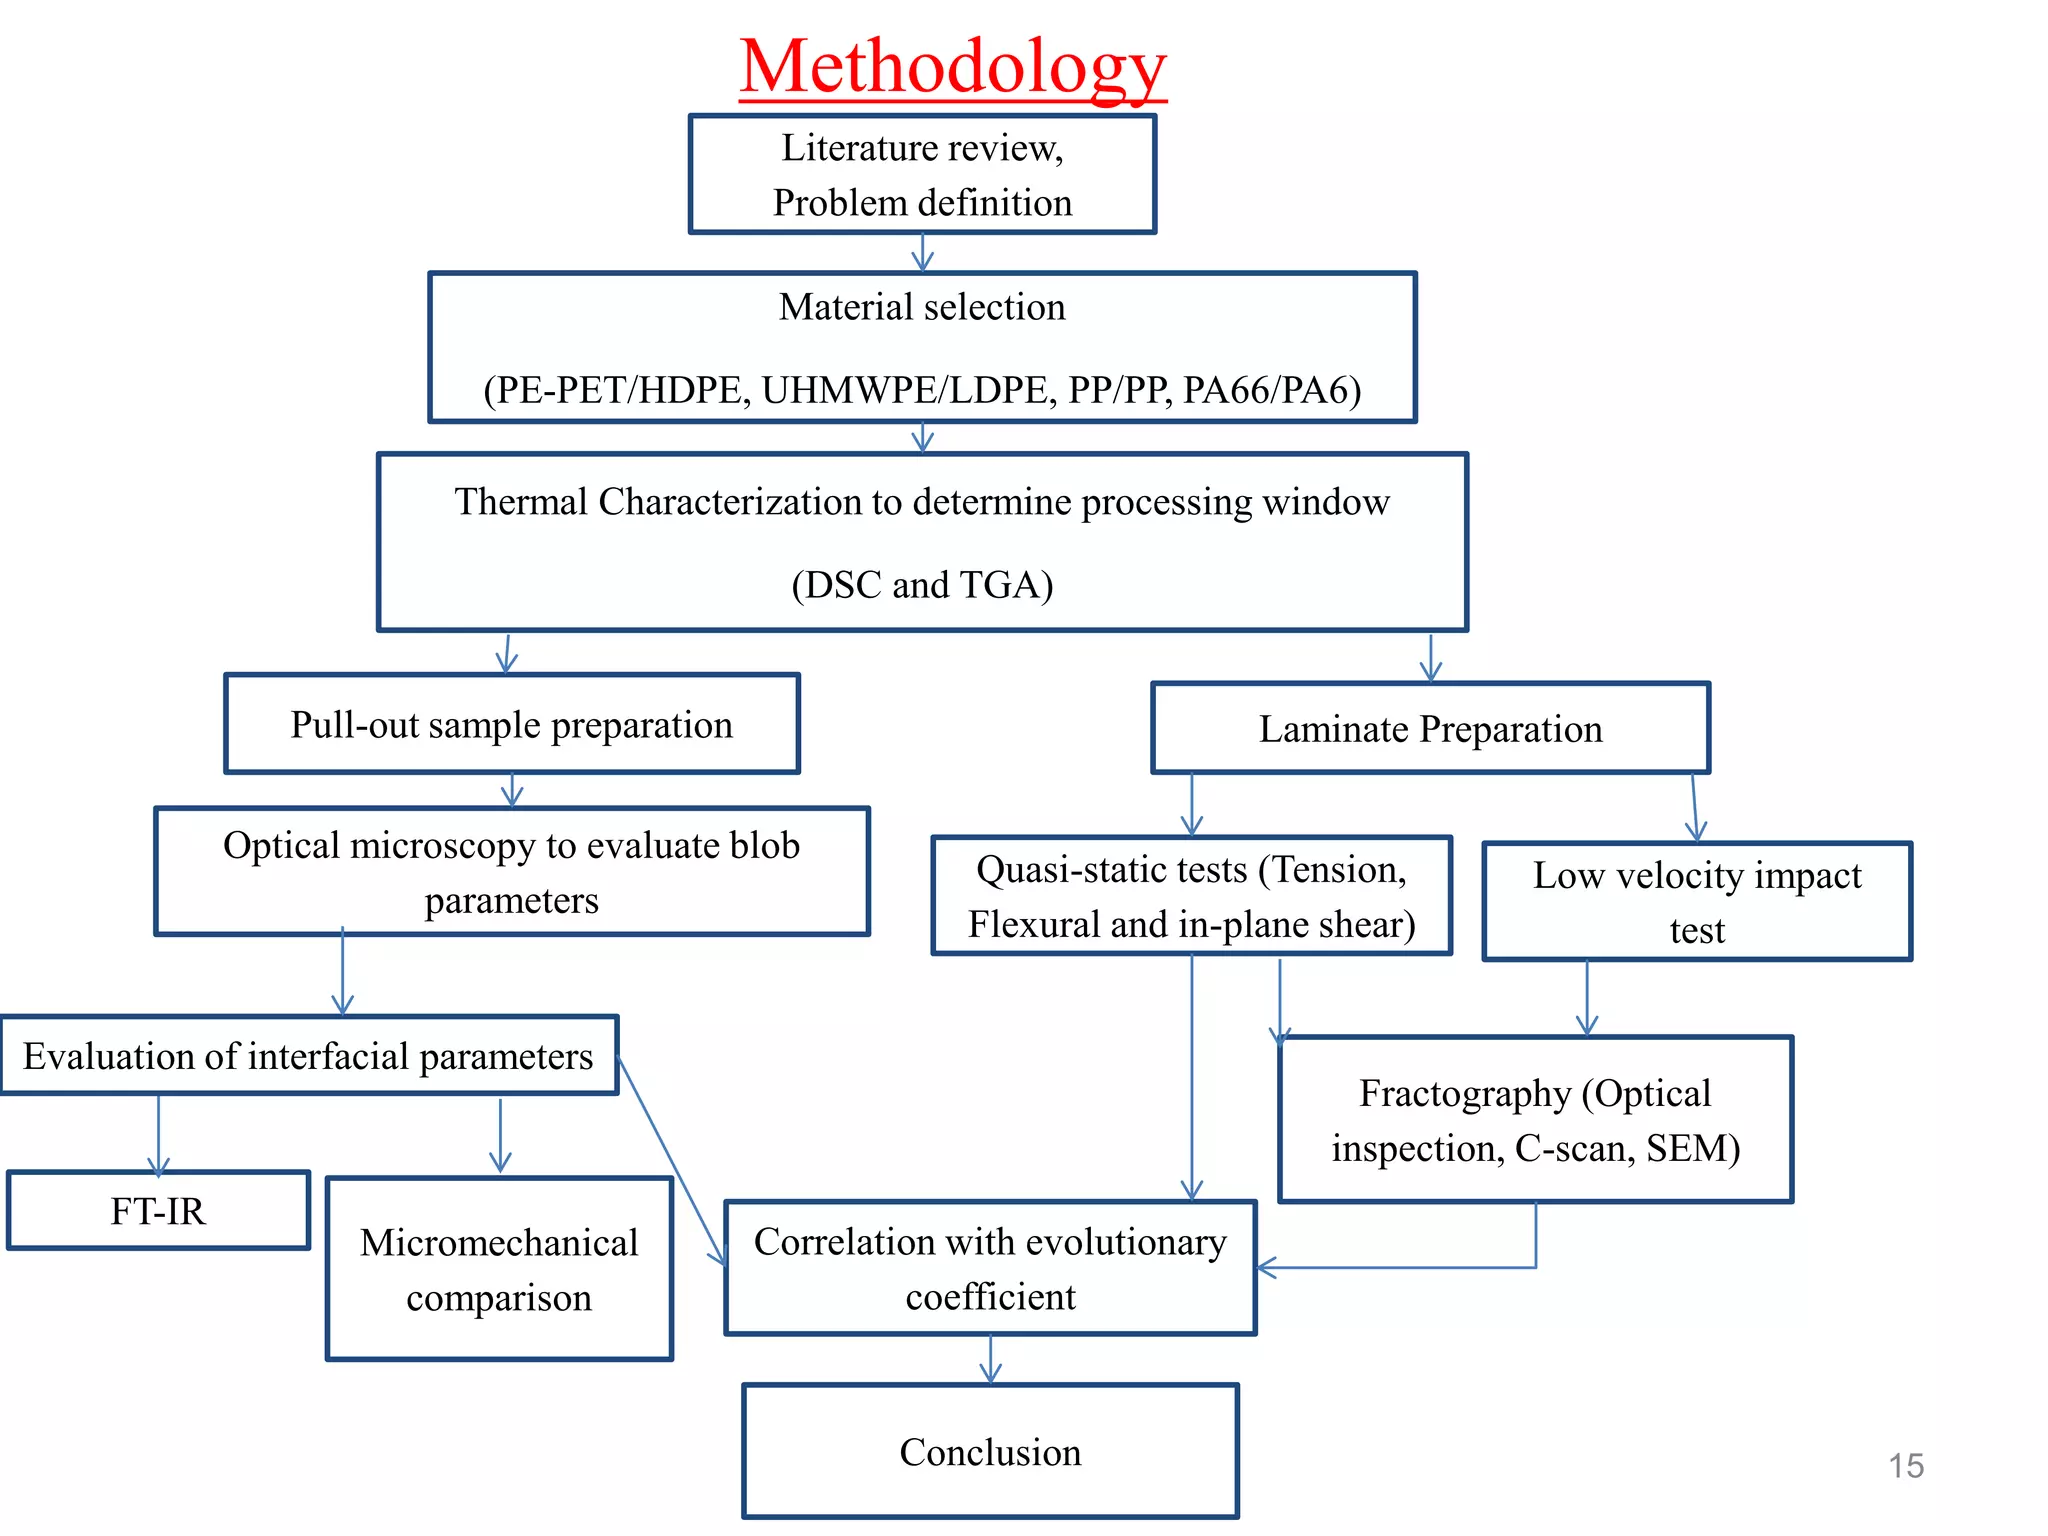
This document outlines the agenda and methodology for a research project on self-reinforced fibre polymer composites, with an emphasis on the fibre/matrix interface. The research will involve theoretical and experimental investigations of the interfacial properties, quasi-static properties, and low velocity impact properties of four types of self-reinforced polymer composites. Fractography and correlation studies will also be conducted. The goal is to better understand the relationship between interfacial properties, mechanical properties, and impact behavior, while addressing gaps in current literature regarding these composites. Thermal analysis, laminate preparation, mechanical testing, and microscopy techniques will be employed in the study.