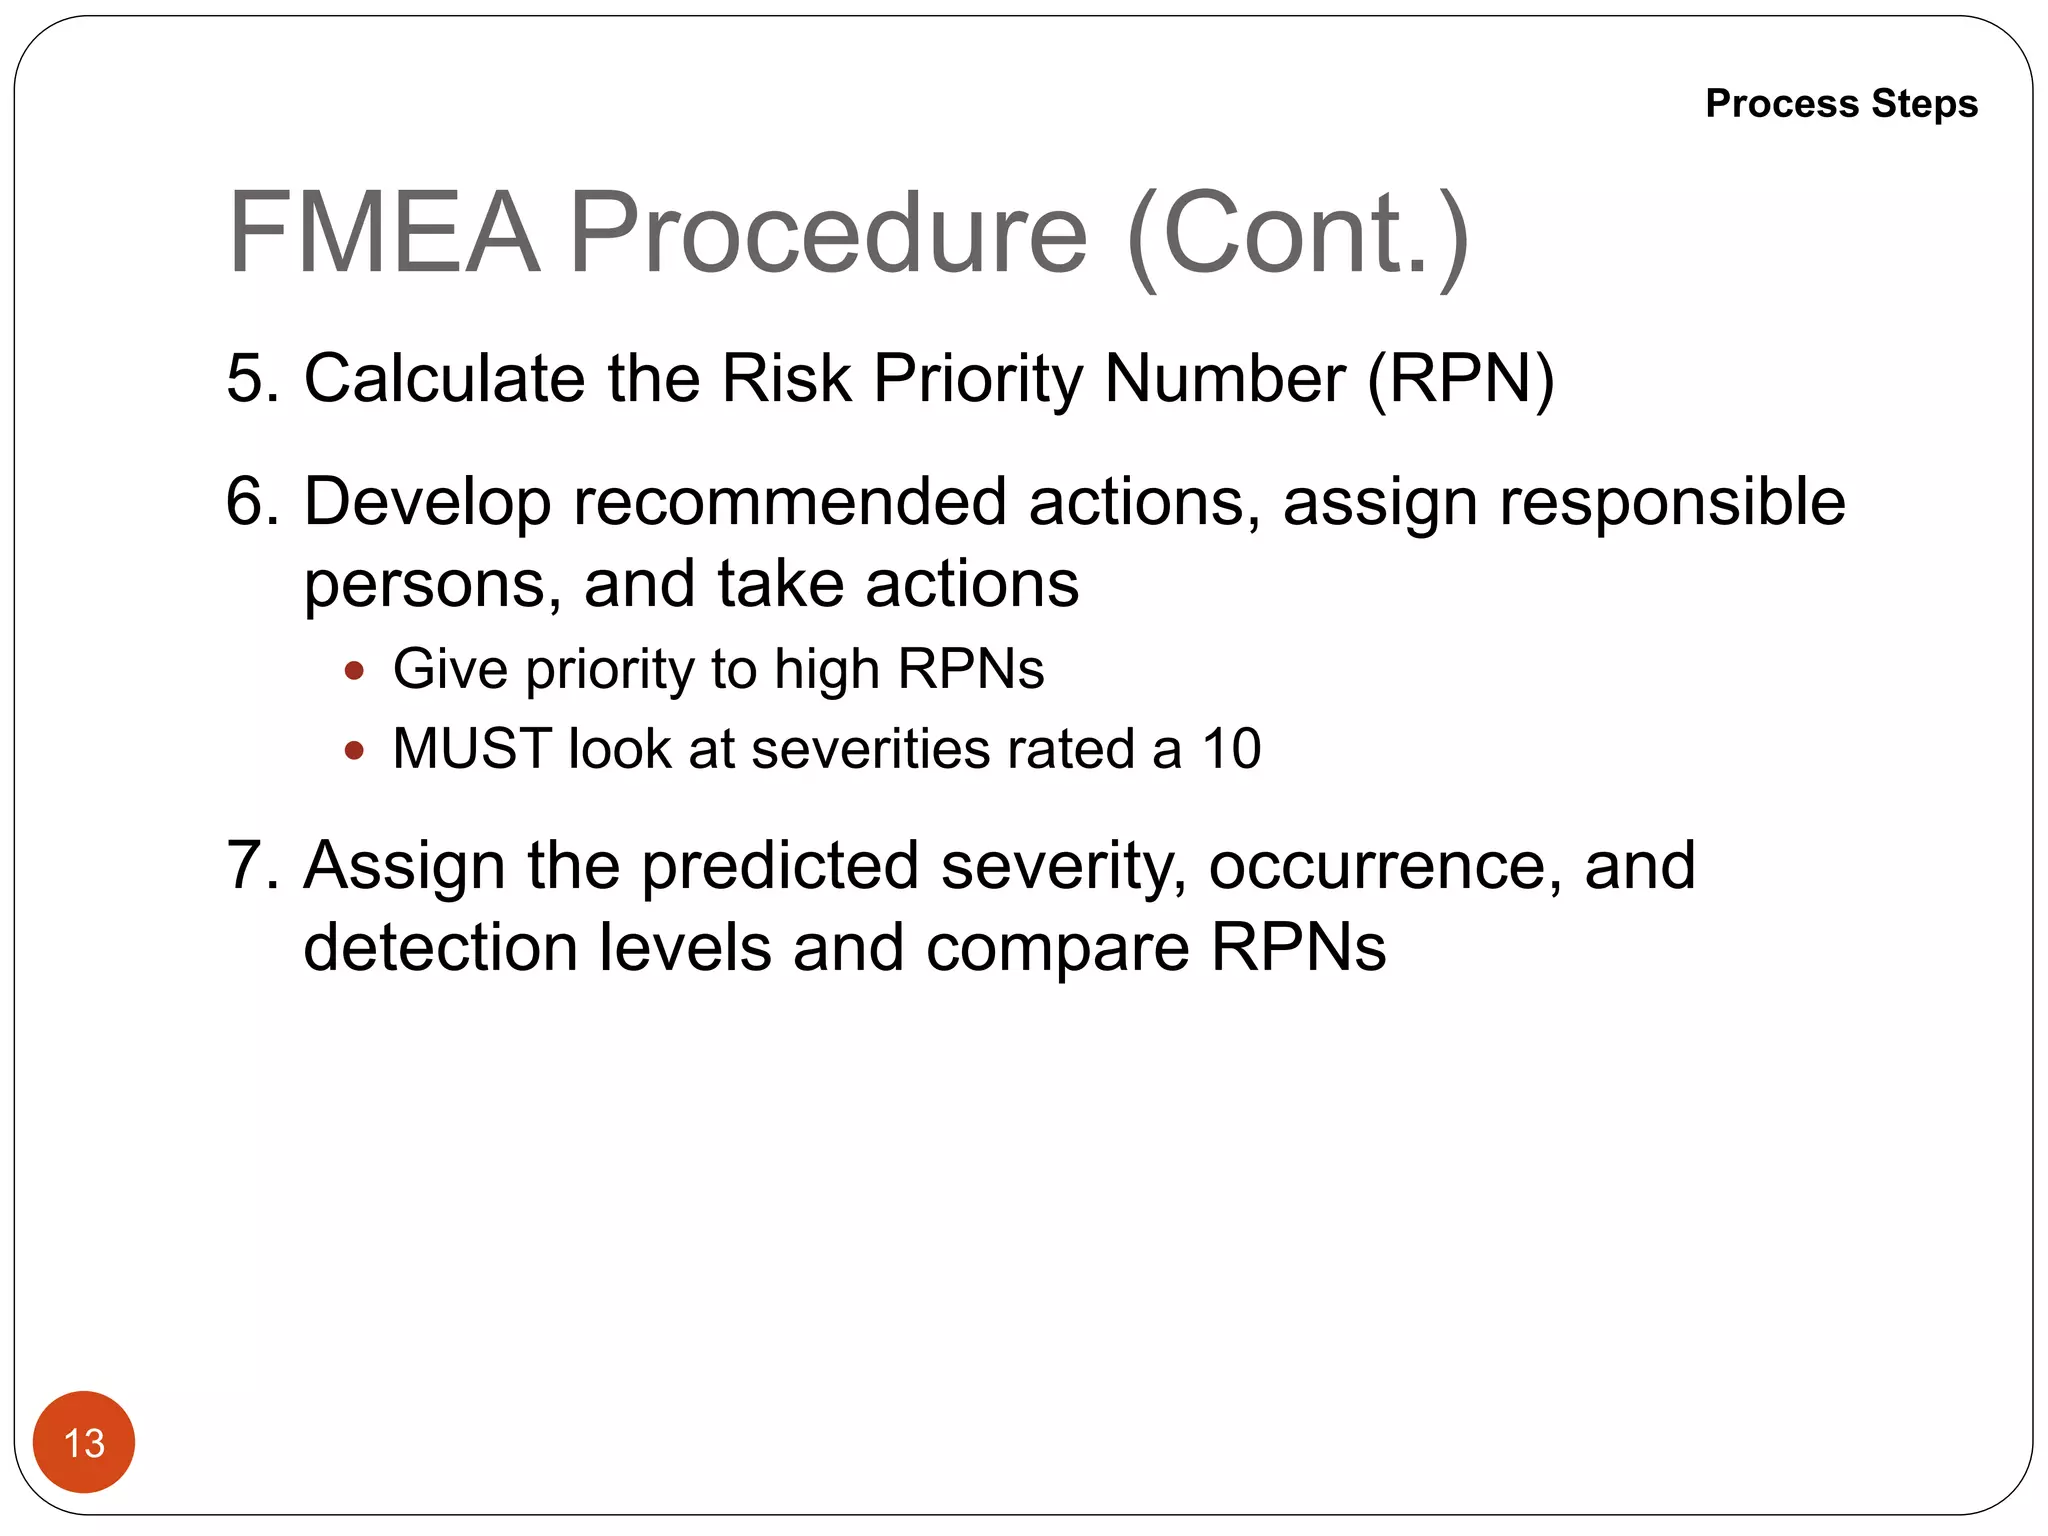
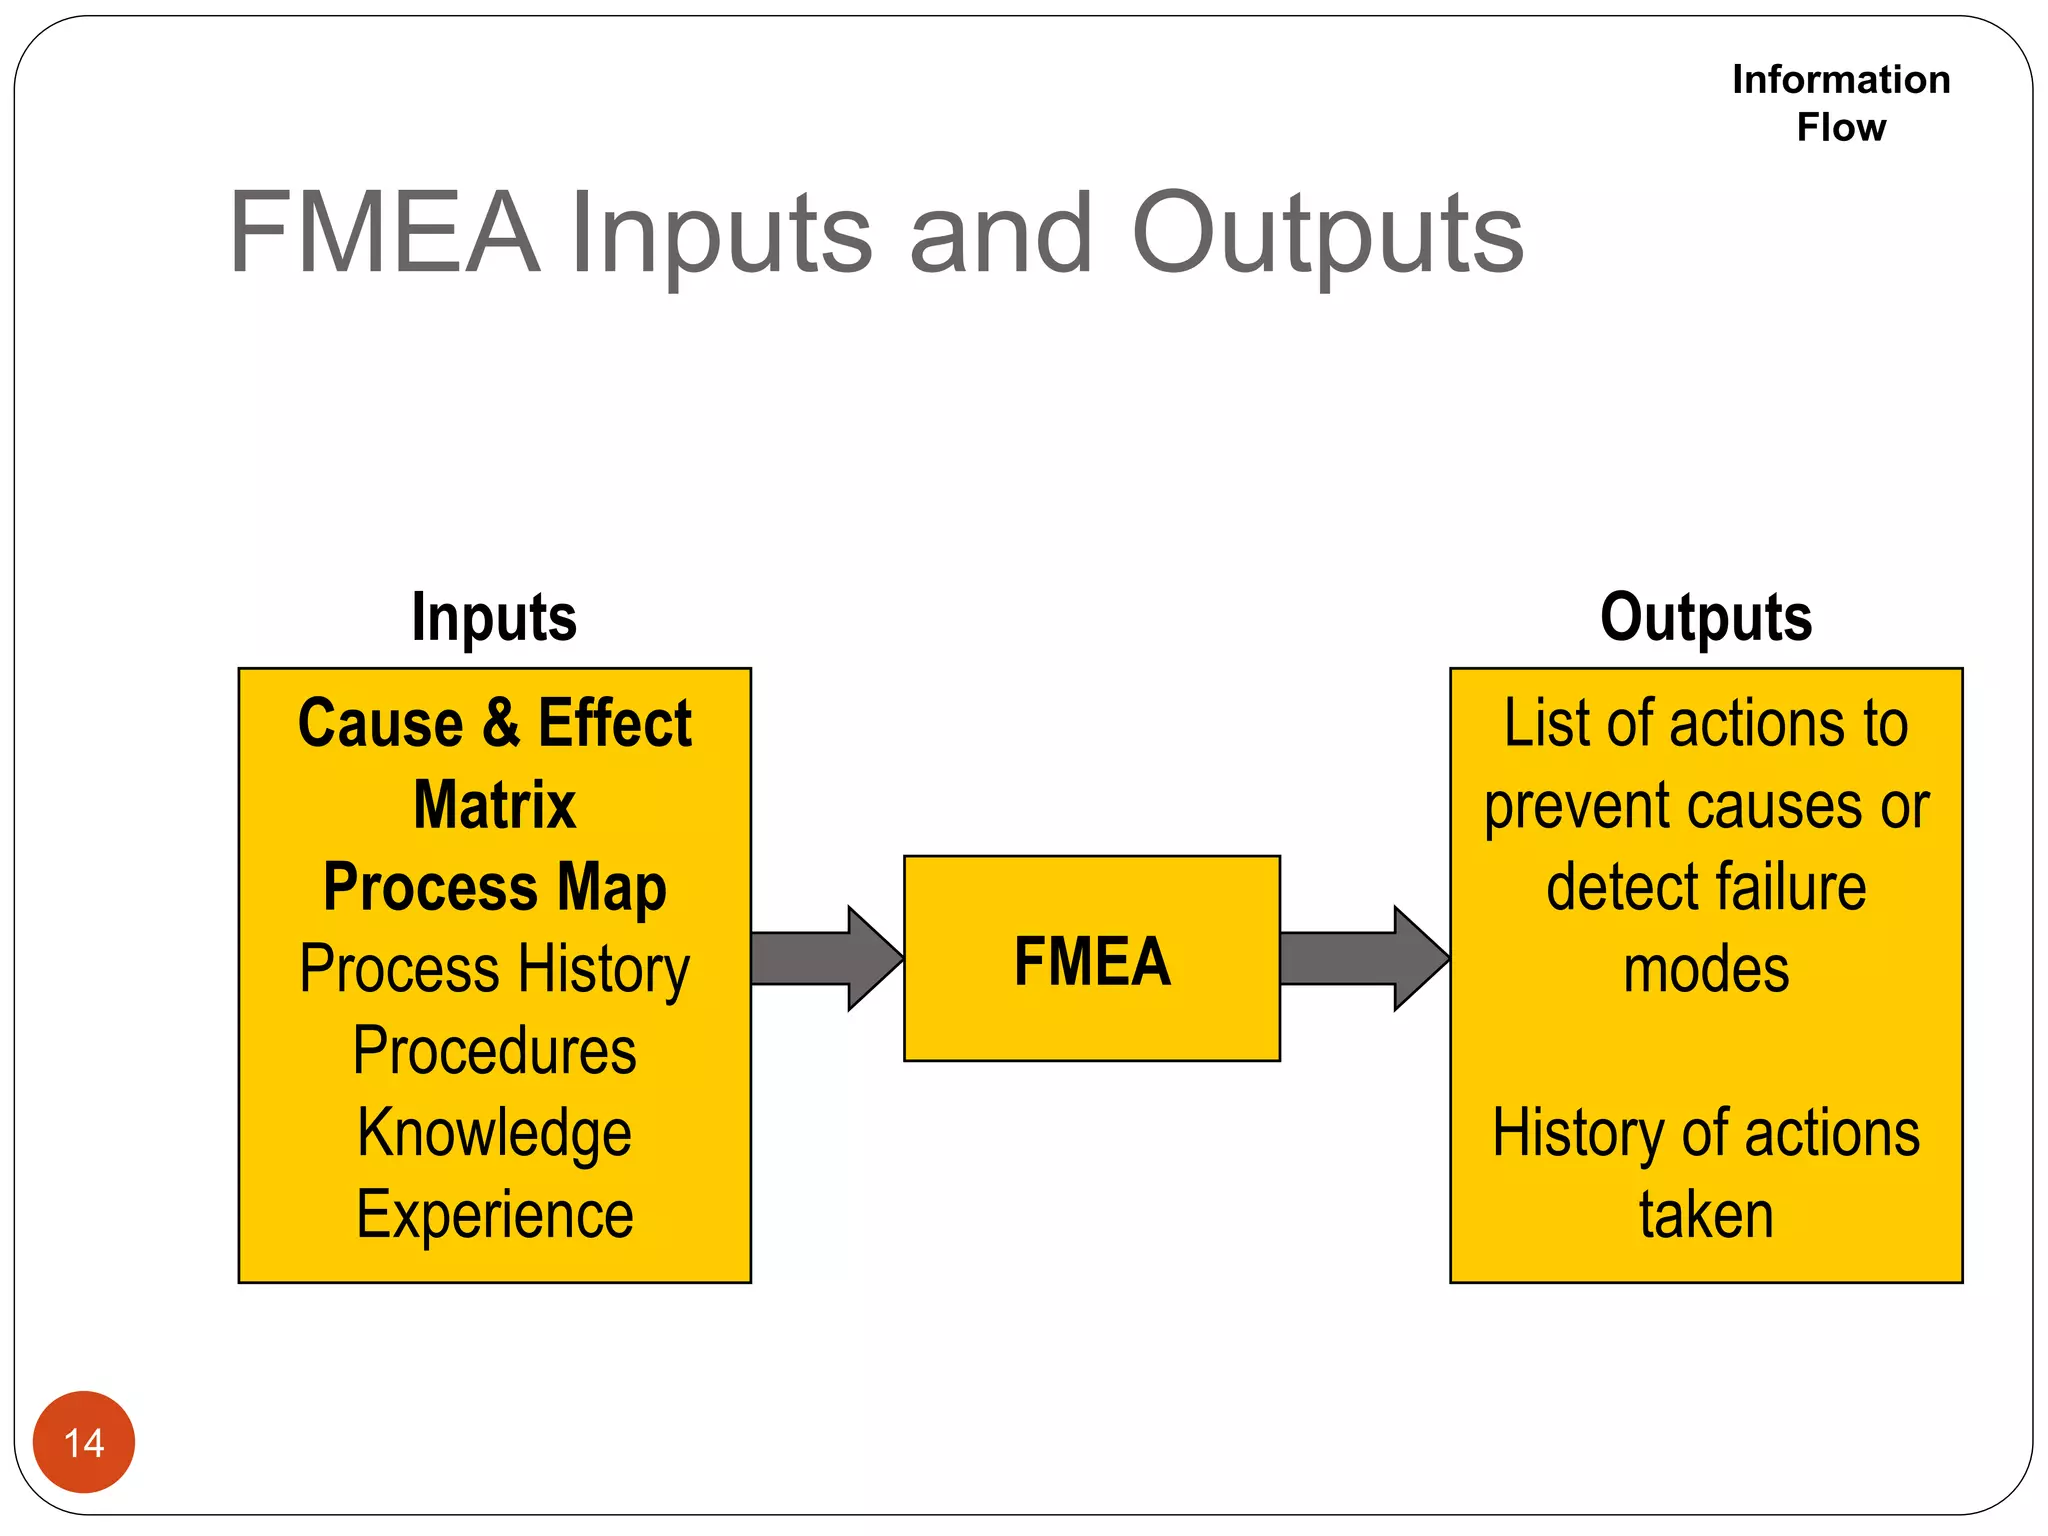
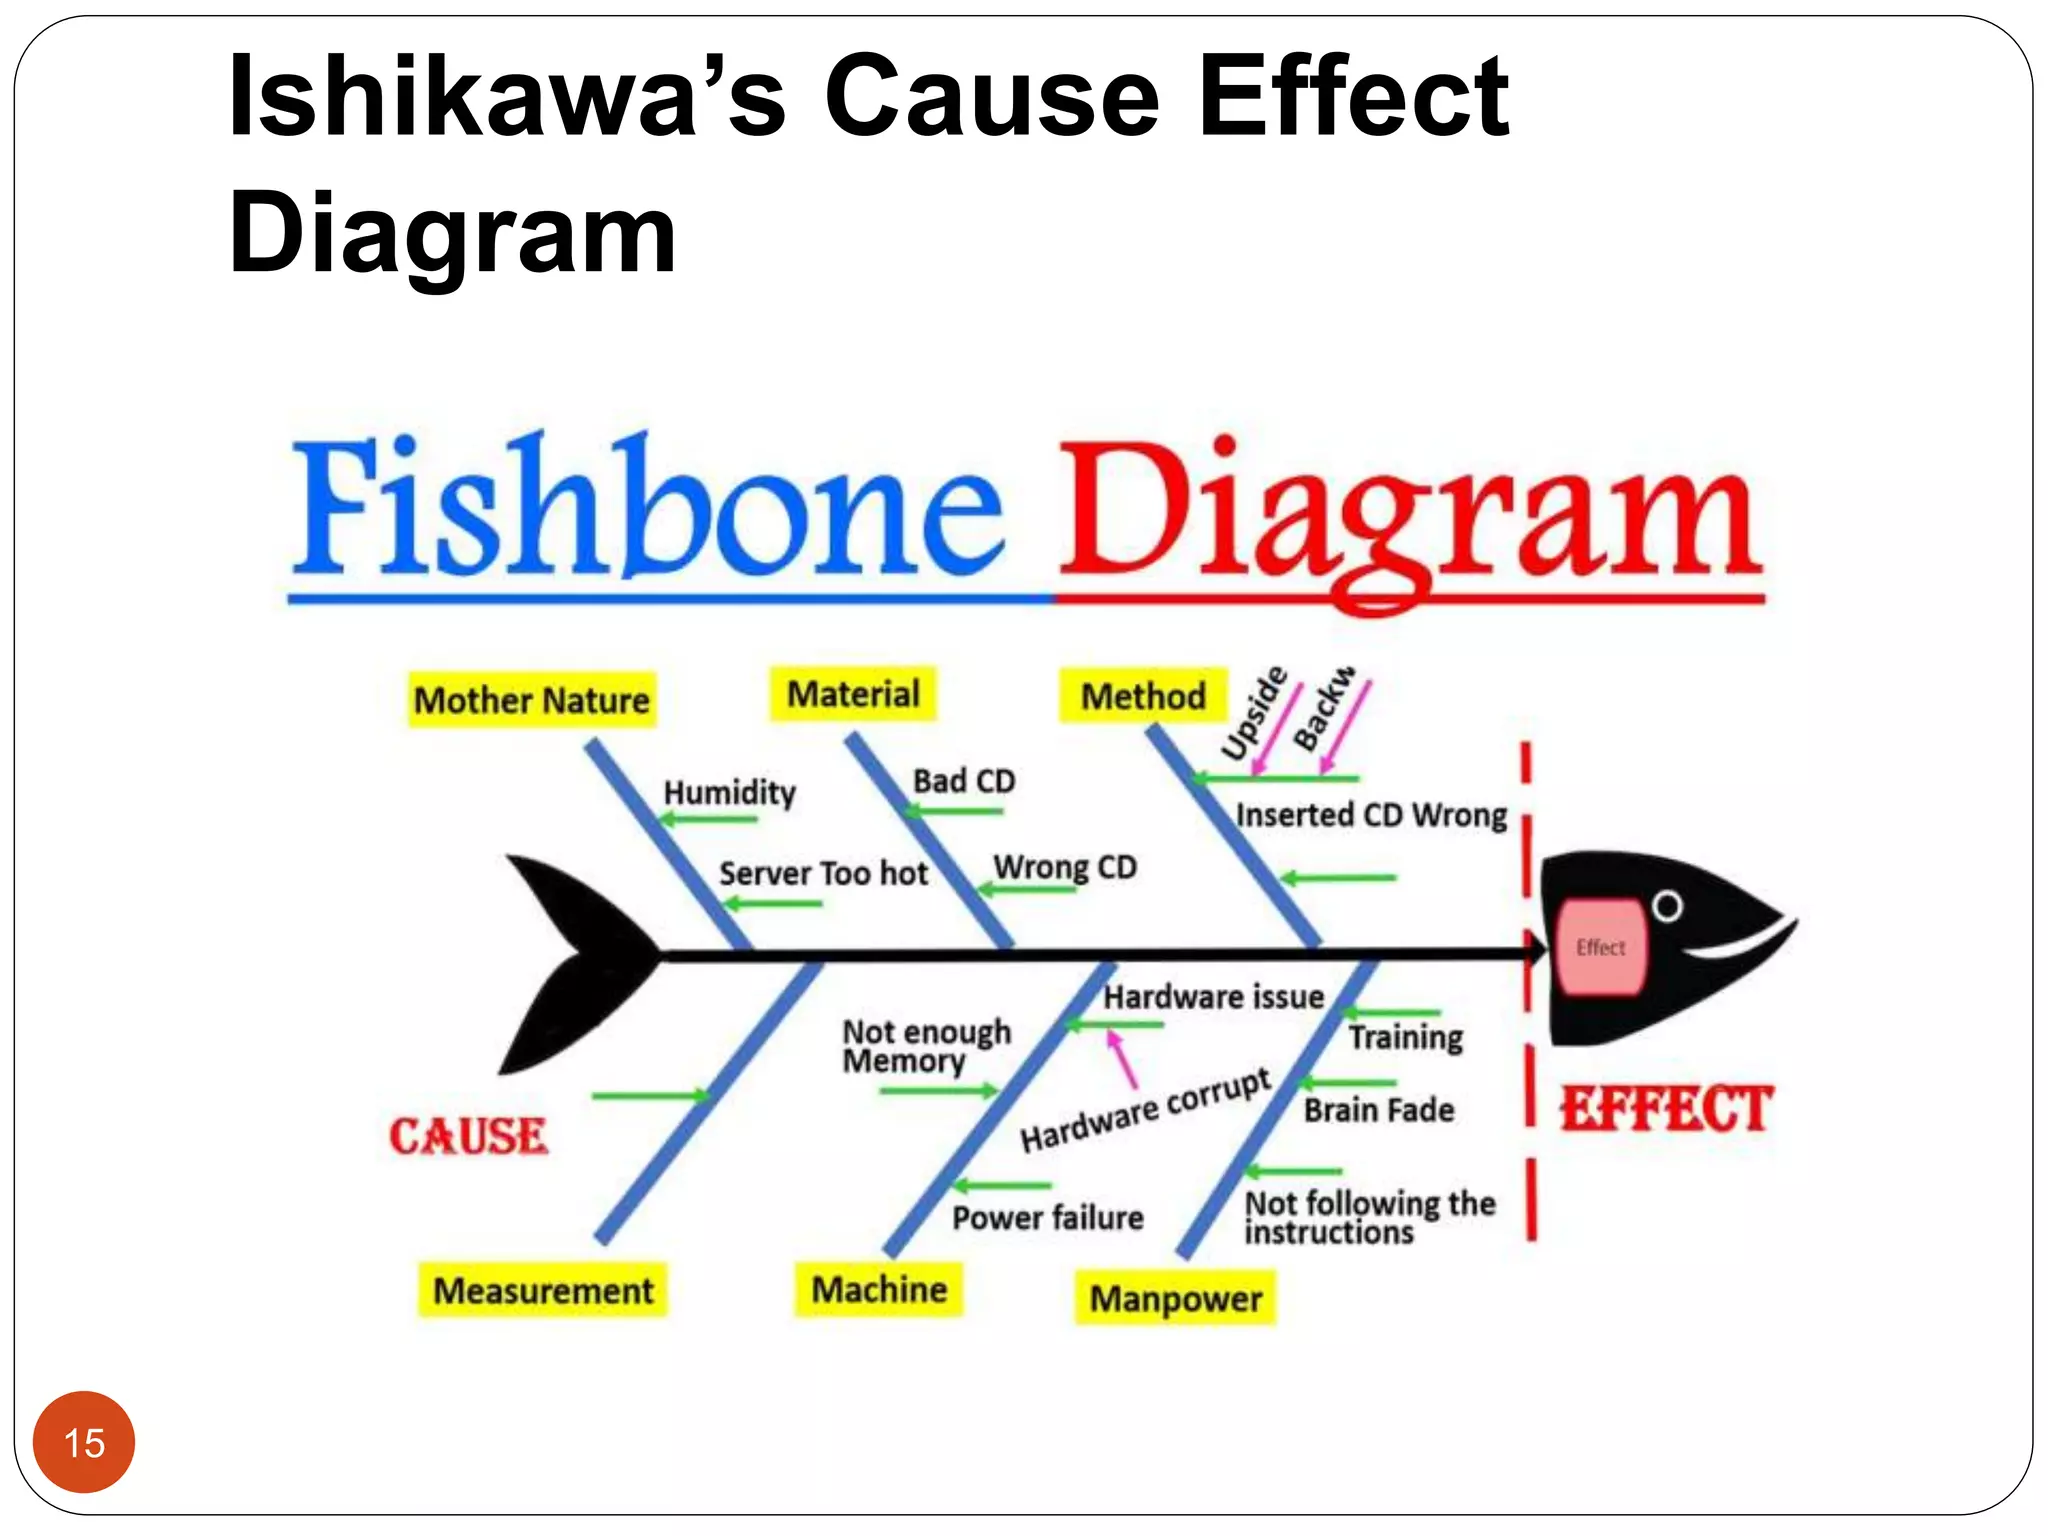
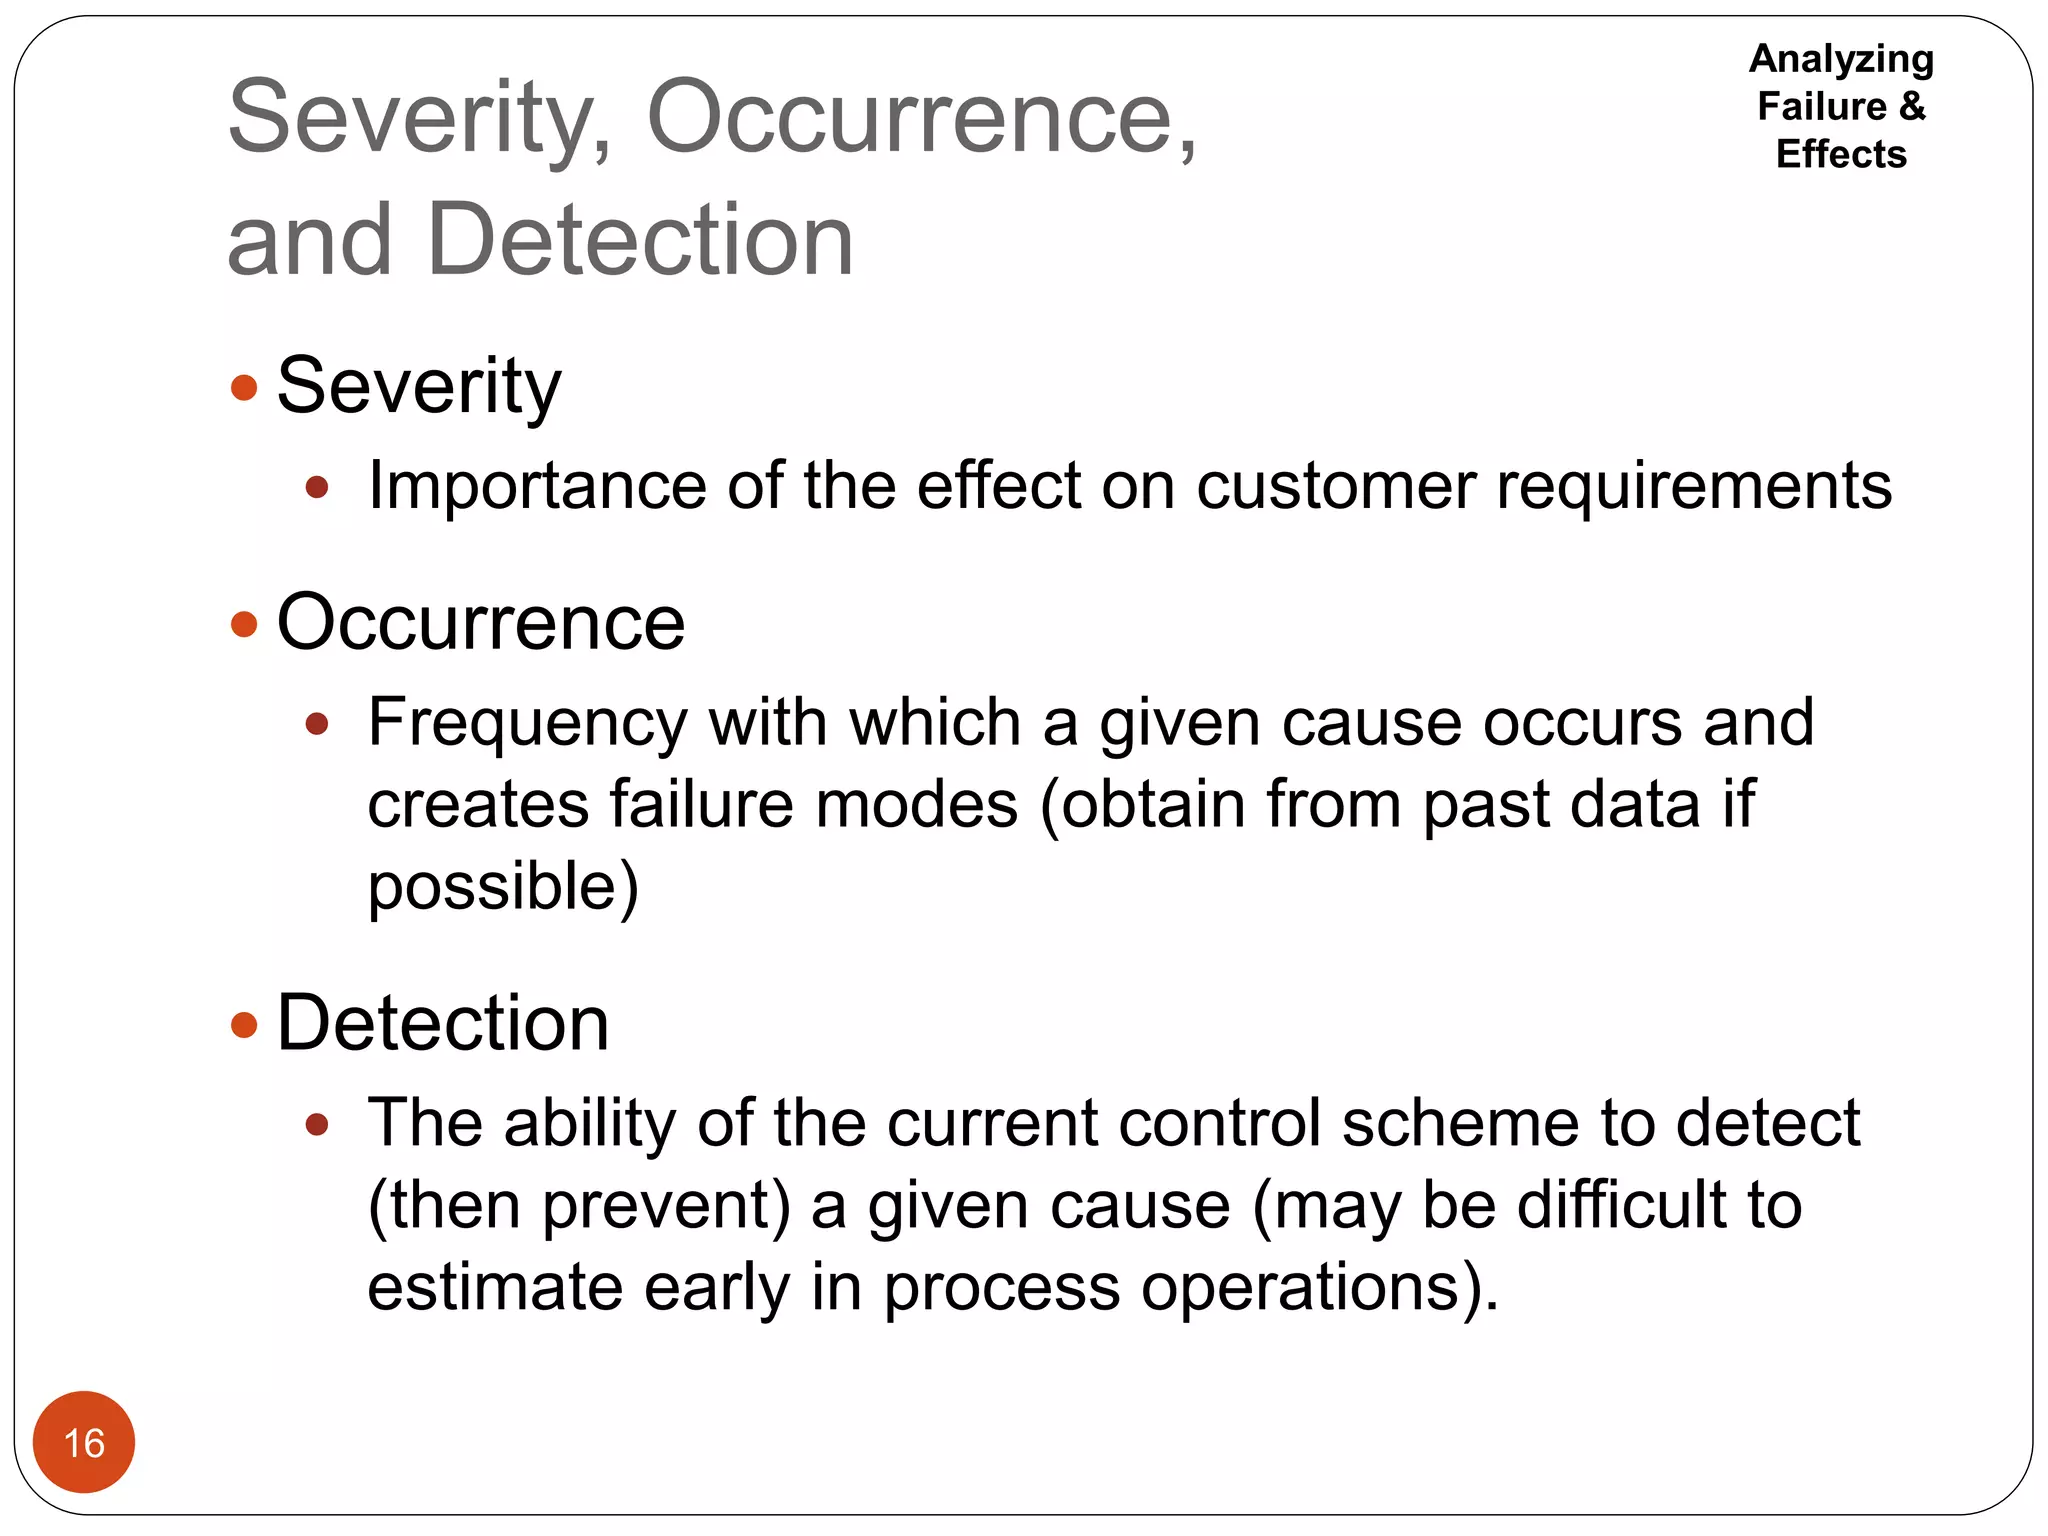
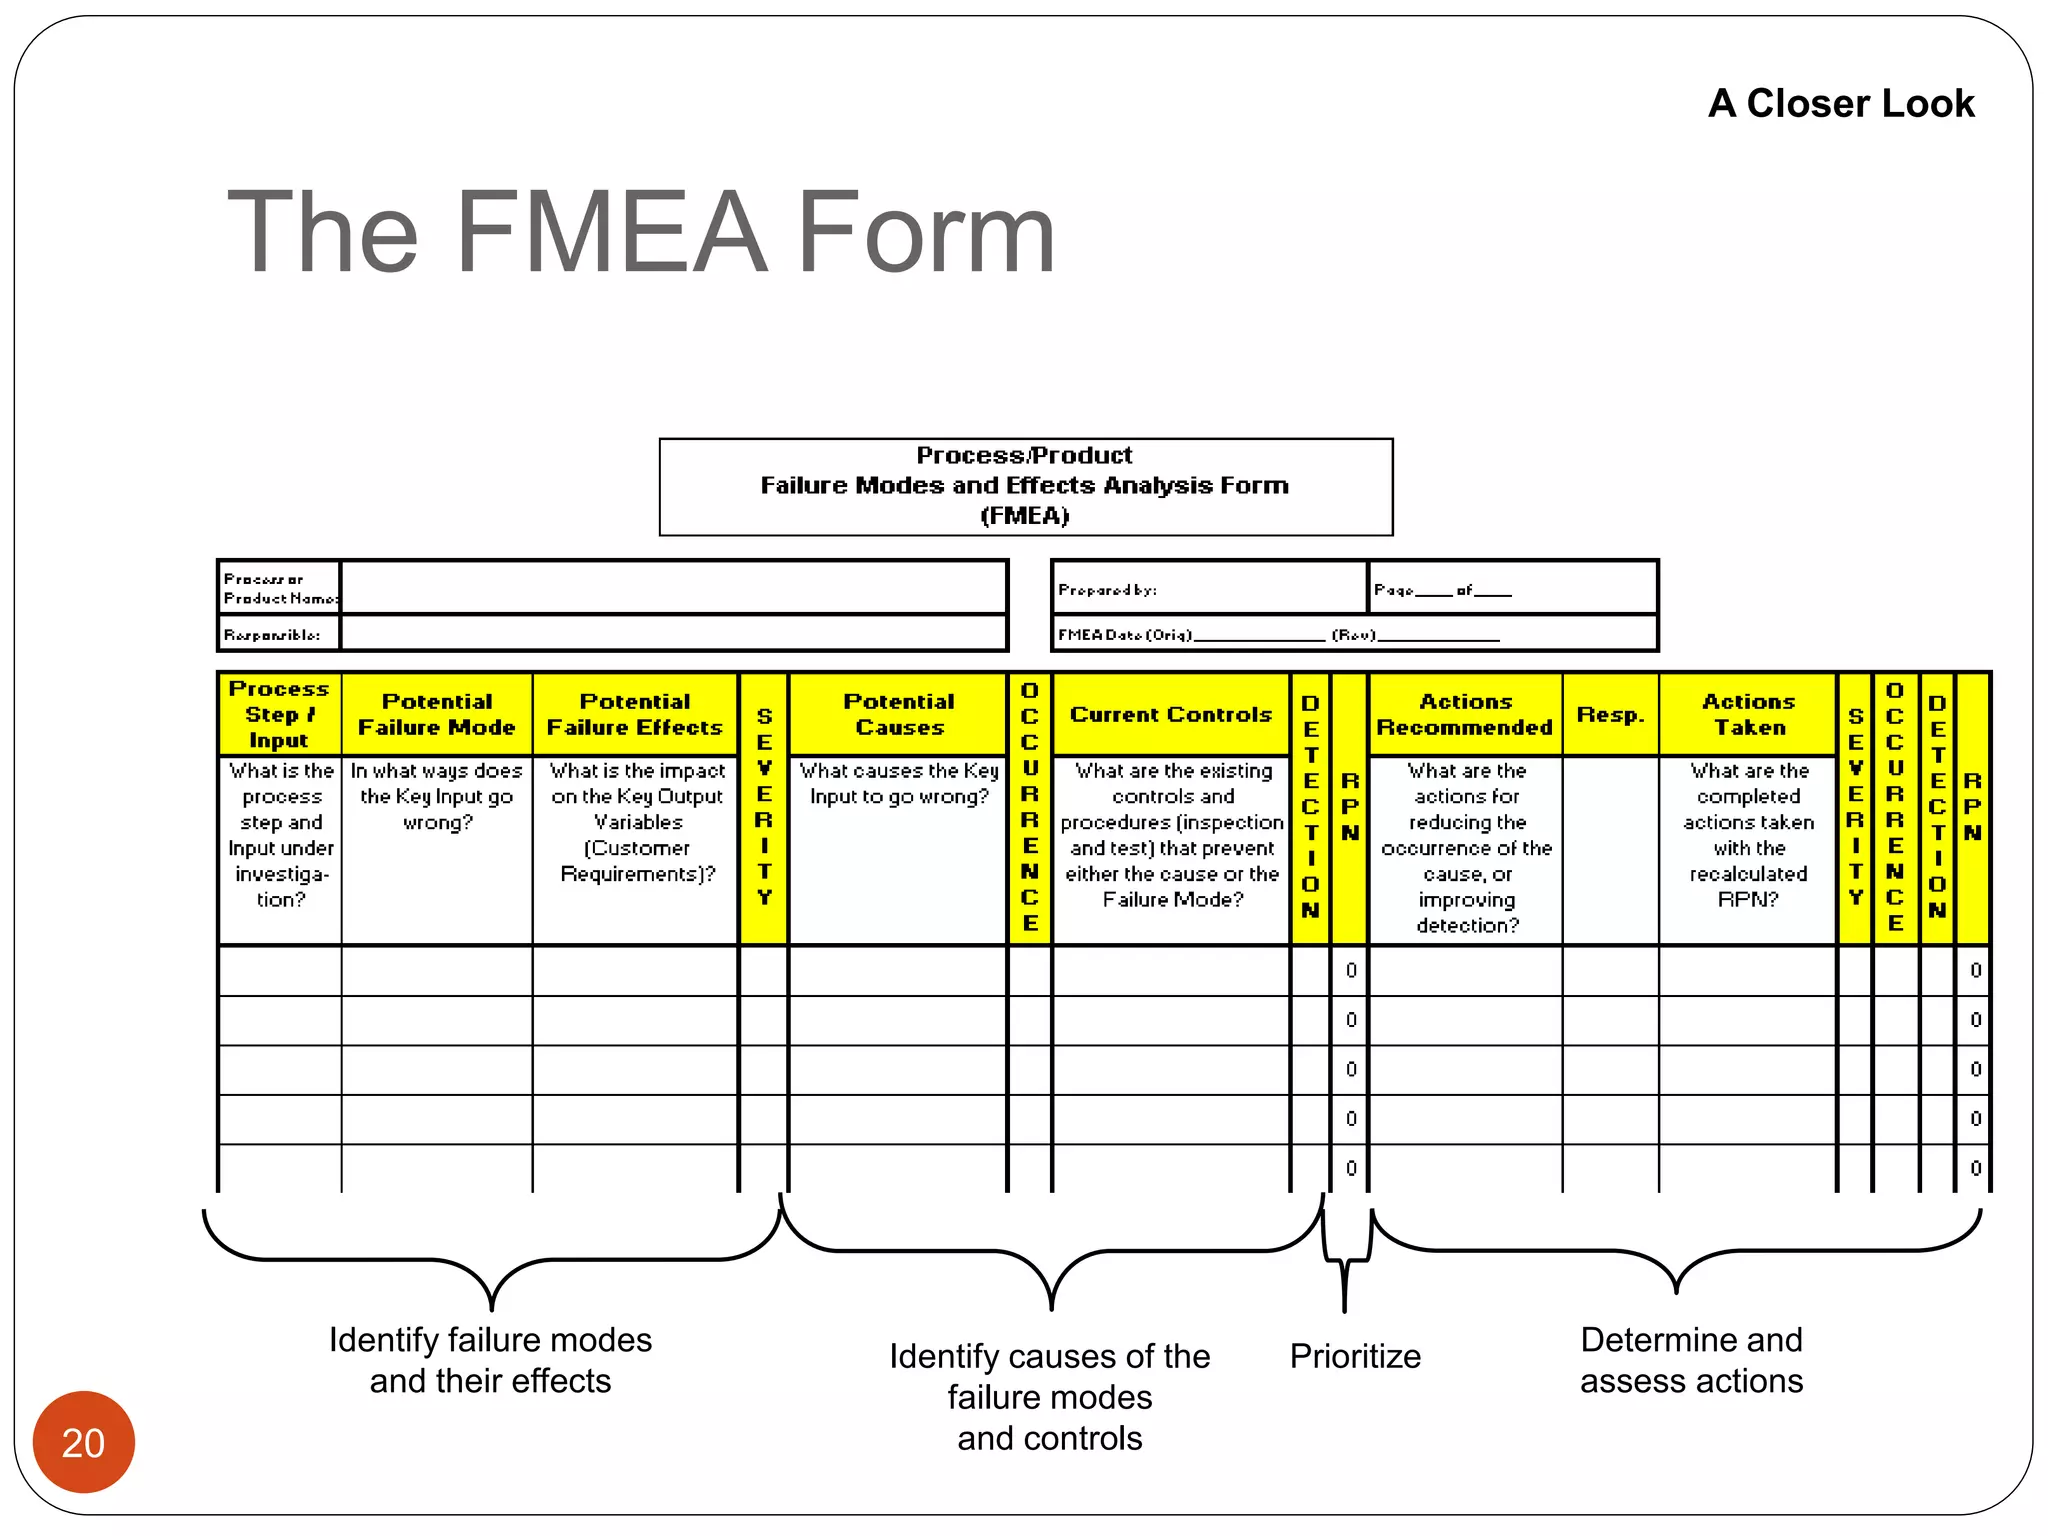
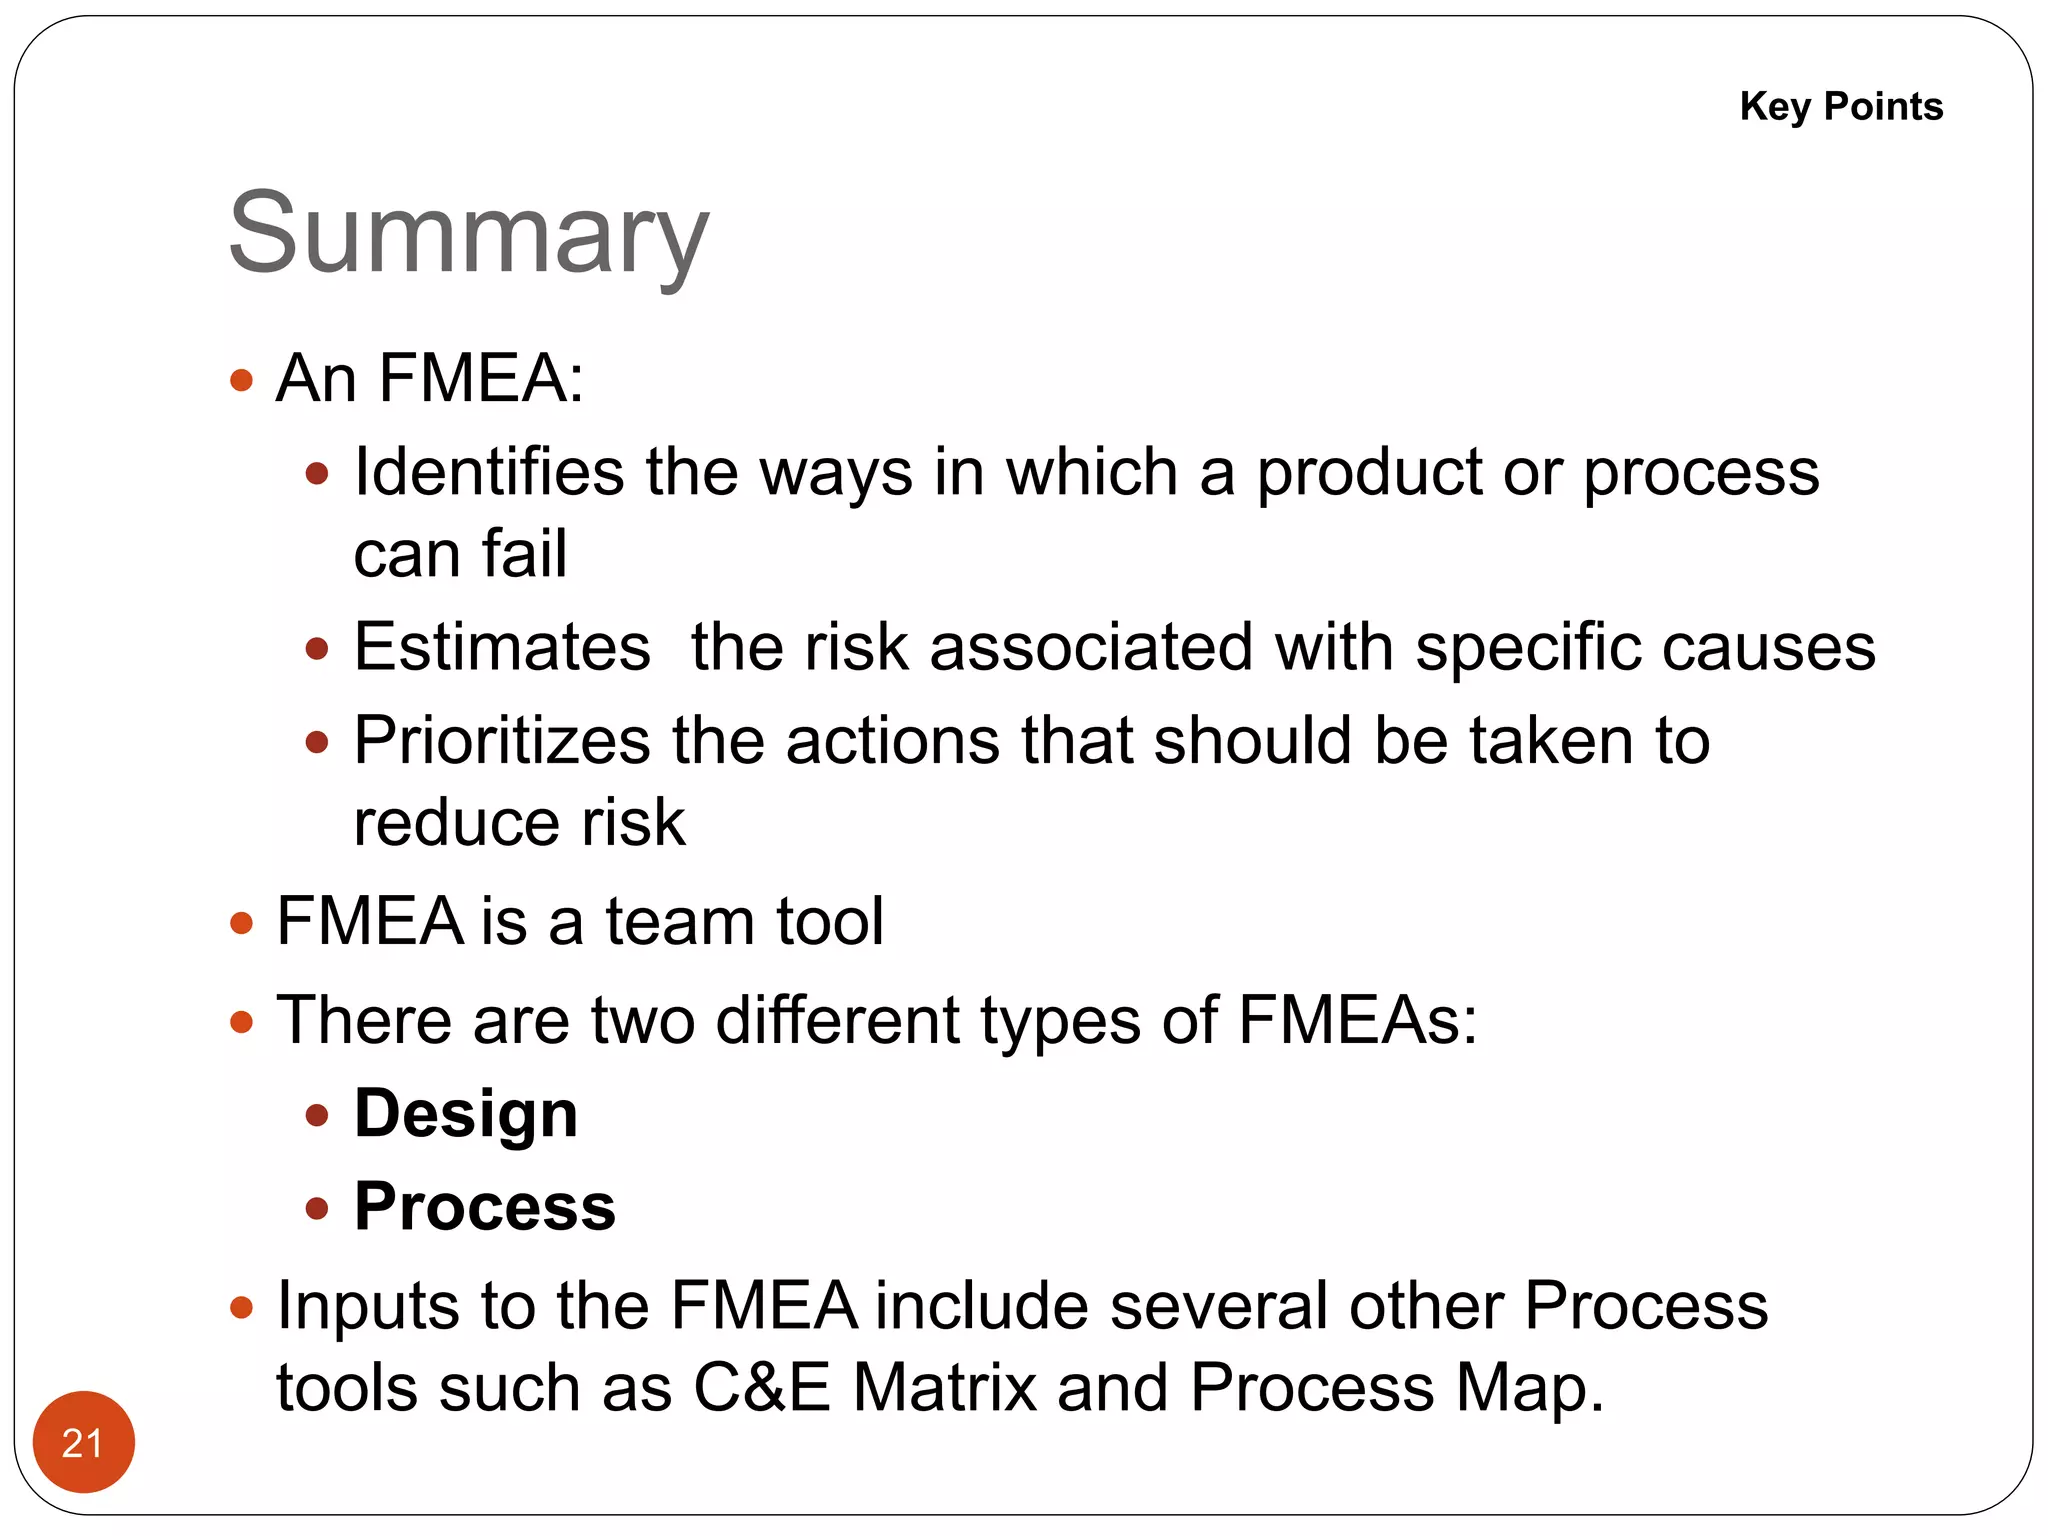
Engineering Failure Analysis
MEE 3003
Failure Modes Effect Analysis
(FMEA)
Learning Objectives
2
 To understand the use of Failure Modes Effect
Analysis (FMEA)
 To learn the steps to developing FMEAs
 To summarize the different types of FMEAs
 To learn how to link the FMEA to other
Process tools
Benefits
3
 Allows us to identify areas of our process that
most impact our customers
 Helps us identify how our process is most likely to
fail
 Points to process failures that are most difficult to
detect
Application Examples
4
 Manufacturing: A manager is responsible for moving a
manufacturing operation to a new facility. He/she
wants to be sure the move goes as smoothly as
possible and that there are no surprises.
 Design: A design engineer wants to think of all the
possible ways a product being designed could fail so
that robustness can be built into the product.
 Software: A software engineer wants to think of
possible problems a software product could fail when
scaled up to large databases. This is a core issue for
the Internet.
What Is A Failure Mode?
5
 A Failure Mode is:
 The way in which the component, subassembly,
product, input, or process could fail to perform its
intended function
 Failure modes may be the result of upstream
operations or may cause downstream operations
to fail
 Things that could go wrong
What Can Go
Wrong?
FMEA
6
 Why
 Methodology that facilitates process improvement
 Identifies and eliminates concerns early in the
development of a process or design
 Improve internal and external customer satisfaction
 Focuses on prevention
 FMEA may be a customer requirement (likely
contractual)
 FMEA may be required by an applicable
Quality Management System Standard (possibly
ISO)
FMEA
7
 A structured approach to:
 Identifying the ways in which a product or process
can fail
 Estimating risk associated with specific causes
 Prioritizing the actions that should be taken to
reduce risk
 Evaluating design validation plan (design FMEA) or
current control plan (process FMEA)
When to Conduct an FMEA
8
 Early in the process improvement investigation
 When new systems, products, and processes
are being designed
 When existing designs or processes are being
changed
 When carry-over designs are used in new
applications
 After system, product, or process functions are
defined, but before specific hardware is
selected or released to manufacturing
History of FMEA
9
 First used in the 1960’s in the Aerospace
industry during the Apollo missions
 In 1974, the Navy developed MIL-STD-1629
regarding the use of FMEA
 In the late 1970’s, the automotive industry
was driven by liability costs to use FMEA
 Later, the automotive industry saw the
advantages of using this tool to reduce risks
related to poor quality
Examples
Types of FMEAs
10
 Design
 Analyzes product design before release to
production, with a focus on product function
 Analyzes systems and subsystems in early
concept and design stages
 Process
 Used to analyze manufacturing and assembly
processes after they are implemented
Specialized
Uses
FMEA: A Team Tool
11
 A team approach is necessary.
 Team should be led by the Process Owner who is
the responsible manufacturing engineer or
technical person, or other similar individual
familiar with FMEA.
 The following should be considered for team
members:
– Design Engineers – Operators
– Process Engineers – Reliability
– Materials Suppliers – Suppliers
– Customers
Team Input
Required
FMEA Procedure
12
1. For each process input (start with high value inputs),
determine the ways in which the input can go wrong
(failure mode)
2. For each failure mode, determine effects
 Select a severity level for each effect
3. Identify potential causes of each failure mode
 Select an occurrence level for each cause
4. List current controls for each cause
 Select a detection level for each cause
Process Steps
FMEA Procedure (Cont.)
13
5. Calculate the Risk Priority Number (RPN)
6. Develop recommended actions, assign responsible
persons, and take actions
 Give priority to high RPNs
 MUST look at severities rated a 10
7. Assign the predicted severity, occurrence, and
detection levels and compare RPNs
Process Steps
FMEA Inputs and Outputs
14
FMEA
Cause & Effect
Matrix
Process Map
Process History
Procedures
Knowledge
Experience
List of actions to
prevent causes or
detect failure
modes
History of actions
taken
Inputs Outputs
Information
Flow
Ishikawa’s Cause Effect
Diagram
15
Severity, Occurrence,
and Detection
16
 Severity
 Importance of the effect on customer requirements
 Occurrence
 Frequency with which a given cause occurs and
creates failure modes (obtain from past data if
possible)
 Detection
 The ability of the current control scheme to detect
(then prevent) a given cause (may be difficult to
estimate early in process operations).
Analyzing
Failure &
Effects
Rating Scales
17
 There are a wide variety of scoring “anchors”,
both quantitative or qualitative
 Two types of scales are 1-5 or 1-10
 The 1-5 scale makes it easier for the teams to
decide on scores
 The 1-10 scale may allow for better precision
in estimates and a wide variation in scores
(most common)
Assigning
Rating
Weights
Rating Scales
18
 Severity
 1 = Not Severe, 10 = Very Severe
 Occurrence
 1 = Not Likely, 10 = Very Likely
 Detection
 1 = Easy to Detect, 10 = Not easy to Detect
Assigning
Rating
Weights
Risk Priority Number (RPN)
19
 RPN is the product of the severity, occurrence,
and detection scores.
Severity Occurrence Detection RPN
X X =
Calculating a
Composite
Score
The FMEA Form
20
Identify failure modes
and their effects
Identify causes of the
failure modes
and controls
Prioritize Determine and
assess actions
A Closer Look
Summary
21
 An FMEA:
 Identifies the ways in which a product or process
can fail
 Estimates the risk associated with specific causes
 Prioritizes the actions that should be taken to
reduce risk
 FMEA is a team tool
 There are two different types of FMEAs:
 Design
 Process
 Inputs to the FMEA include several other Process
tools such as C&E Matrix and Process Map.
Key Points
Armature example case study
22
Relationships of FMEA with other
Tools
 Fault tree analysis: FTA is a deductive analytical
technique of reliability and safety analysis
 Used for complex dynamic systems
 Provides for objective basis for analysis and
justification for changes and additions
 Developed in 1961 by Bell telephone company.
 It is a model that logically and graphically
represents the various combinations of possible
events, both faulty and normal, occurring in a
system that leads to the top undesired event.
 The tree shows a single failure at the top leading
to the root cause at the bottom. Connected to
23
Fault Tree Analysis-An example
24
Benefits of FTA
 Many logic symbols are used for the tree to
describe complex dynamic events
 This helps in visualizing the analysis
 Helps in assembly reliability
 Determines the probability of occurrence for each
of the root causes.
 Provides documented evidence for compliance
with safety.
 Assesses the impact of design changes and
alternatives
 Isolates critical safety behaviour
 Identifies failures that lead to accidents.
25
Design of Experiments
 Certain independent variables are changed to a
predefined plan and the effects are determined
on the dependent variables.
 DOE is used in reliability testing and can
identifythe primary factors causing an undesired
event.
 DOE is used in FMEA when there is concern
about several independent variables and/or an
interaction effect of casual factors.
 The quality function deployment (QFD) is a
systematic methodology that brings together the
various factions with in the corporation and
focusses them to the voice of the customer.
26
QFD
 It can help in the identification of weaknesses and
strengths in product development and TQM ( Total
Quality Management).
 This leads to operational and strategic benefits
 Reduced cost, fewer engineering changes, shorter
cycle time and large market share are the advantages
in strategic benefits.
 Is linked to other quality technologies, enhances
communication, identifies conflicting requirements
and preserves information for the future.
 A need analysis of the customer that precedes QFD
will be highly beneficial.
 Ultimately the systems engineer is responsible for
27
Thank you and Questions
?
28

Failure Mode Effect Analysis in Engineering Failures

  • 1.
    Engineering Failure Analysis MEE3003 Failure Modes Effect Analysis (FMEA)
  • 2.
    Learning Objectives 2  Tounderstand the use of Failure Modes Effect Analysis (FMEA)  To learn the steps to developing FMEAs  To summarize the different types of FMEAs  To learn how to link the FMEA to other Process tools
  • 3.
    Benefits 3  Allows usto identify areas of our process that most impact our customers  Helps us identify how our process is most likely to fail  Points to process failures that are most difficult to detect
  • 4.
    Application Examples 4  Manufacturing:A manager is responsible for moving a manufacturing operation to a new facility. He/she wants to be sure the move goes as smoothly as possible and that there are no surprises.  Design: A design engineer wants to think of all the possible ways a product being designed could fail so that robustness can be built into the product.  Software: A software engineer wants to think of possible problems a software product could fail when scaled up to large databases. This is a core issue for the Internet.
  • 5.
    What Is AFailure Mode? 5  A Failure Mode is:  The way in which the component, subassembly, product, input, or process could fail to perform its intended function  Failure modes may be the result of upstream operations or may cause downstream operations to fail  Things that could go wrong What Can Go Wrong?
  • 6.
    FMEA 6  Why  Methodologythat facilitates process improvement  Identifies and eliminates concerns early in the development of a process or design  Improve internal and external customer satisfaction  Focuses on prevention  FMEA may be a customer requirement (likely contractual)  FMEA may be required by an applicable Quality Management System Standard (possibly ISO)
  • 7.
    FMEA 7  A structuredapproach to:  Identifying the ways in which a product or process can fail  Estimating risk associated with specific causes  Prioritizing the actions that should be taken to reduce risk  Evaluating design validation plan (design FMEA) or current control plan (process FMEA)
  • 8.
    When to Conductan FMEA 8  Early in the process improvement investigation  When new systems, products, and processes are being designed  When existing designs or processes are being changed  When carry-over designs are used in new applications  After system, product, or process functions are defined, but before specific hardware is selected or released to manufacturing
  • 9.
    History of FMEA 9 First used in the 1960’s in the Aerospace industry during the Apollo missions  In 1974, the Navy developed MIL-STD-1629 regarding the use of FMEA  In the late 1970’s, the automotive industry was driven by liability costs to use FMEA  Later, the automotive industry saw the advantages of using this tool to reduce risks related to poor quality Examples
  • 10.
    Types of FMEAs 10 Design  Analyzes product design before release to production, with a focus on product function  Analyzes systems and subsystems in early concept and design stages  Process  Used to analyze manufacturing and assembly processes after they are implemented Specialized Uses
  • 11.
    FMEA: A TeamTool 11  A team approach is necessary.  Team should be led by the Process Owner who is the responsible manufacturing engineer or technical person, or other similar individual familiar with FMEA.  The following should be considered for team members: – Design Engineers – Operators – Process Engineers – Reliability – Materials Suppliers – Suppliers – Customers Team Input Required
  • 12.
    FMEA Procedure 12 1. Foreach process input (start with high value inputs), determine the ways in which the input can go wrong (failure mode) 2. For each failure mode, determine effects  Select a severity level for each effect 3. Identify potential causes of each failure mode  Select an occurrence level for each cause 4. List current controls for each cause  Select a detection level for each cause Process Steps
  • 13.
    FMEA Procedure (Cont.) 13 5.Calculate the Risk Priority Number (RPN) 6. Develop recommended actions, assign responsible persons, and take actions  Give priority to high RPNs  MUST look at severities rated a 10 7. Assign the predicted severity, occurrence, and detection levels and compare RPNs Process Steps
  • 14.
    FMEA Inputs andOutputs 14 FMEA Cause & Effect Matrix Process Map Process History Procedures Knowledge Experience List of actions to prevent causes or detect failure modes History of actions taken Inputs Outputs Information Flow
  • 15.
  • 16.
    Severity, Occurrence, and Detection 16 Severity  Importance of the effect on customer requirements  Occurrence  Frequency with which a given cause occurs and creates failure modes (obtain from past data if possible)  Detection  The ability of the current control scheme to detect (then prevent) a given cause (may be difficult to estimate early in process operations). Analyzing Failure & Effects
  • 17.
    Rating Scales 17  Thereare a wide variety of scoring “anchors”, both quantitative or qualitative  Two types of scales are 1-5 or 1-10  The 1-5 scale makes it easier for the teams to decide on scores  The 1-10 scale may allow for better precision in estimates and a wide variation in scores (most common) Assigning Rating Weights
  • 18.
    Rating Scales 18  Severity 1 = Not Severe, 10 = Very Severe  Occurrence  1 = Not Likely, 10 = Very Likely  Detection  1 = Easy to Detect, 10 = Not easy to Detect Assigning Rating Weights
  • 19.
    Risk Priority Number(RPN) 19  RPN is the product of the severity, occurrence, and detection scores. Severity Occurrence Detection RPN X X = Calculating a Composite Score
  • 20.
    The FMEA Form 20 Identifyfailure modes and their effects Identify causes of the failure modes and controls Prioritize Determine and assess actions A Closer Look
  • 21.
    Summary 21  An FMEA: Identifies the ways in which a product or process can fail  Estimates the risk associated with specific causes  Prioritizes the actions that should be taken to reduce risk  FMEA is a team tool  There are two different types of FMEAs:  Design  Process  Inputs to the FMEA include several other Process tools such as C&E Matrix and Process Map. Key Points
  • 22.
  • 23.
    Relationships of FMEAwith other Tools  Fault tree analysis: FTA is a deductive analytical technique of reliability and safety analysis  Used for complex dynamic systems  Provides for objective basis for analysis and justification for changes and additions  Developed in 1961 by Bell telephone company.  It is a model that logically and graphically represents the various combinations of possible events, both faulty and normal, occurring in a system that leads to the top undesired event.  The tree shows a single failure at the top leading to the root cause at the bottom. Connected to 23
  • 24.
  • 25.
    Benefits of FTA Many logic symbols are used for the tree to describe complex dynamic events  This helps in visualizing the analysis  Helps in assembly reliability  Determines the probability of occurrence for each of the root causes.  Provides documented evidence for compliance with safety.  Assesses the impact of design changes and alternatives  Isolates critical safety behaviour  Identifies failures that lead to accidents. 25
  • 26.
    Design of Experiments Certain independent variables are changed to a predefined plan and the effects are determined on the dependent variables.  DOE is used in reliability testing and can identifythe primary factors causing an undesired event.  DOE is used in FMEA when there is concern about several independent variables and/or an interaction effect of casual factors.  The quality function deployment (QFD) is a systematic methodology that brings together the various factions with in the corporation and focusses them to the voice of the customer. 26
  • 27.
    QFD  It canhelp in the identification of weaknesses and strengths in product development and TQM ( Total Quality Management).  This leads to operational and strategic benefits  Reduced cost, fewer engineering changes, shorter cycle time and large market share are the advantages in strategic benefits.  Is linked to other quality technologies, enhances communication, identifies conflicting requirements and preserves information for the future.  A need analysis of the customer that precedes QFD will be highly beneficial.  Ultimately the systems engineer is responsible for 27
  • 28.
    Thank you andQuestions ? 28