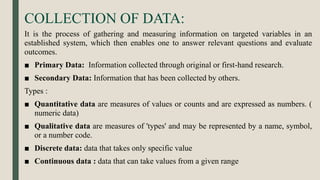
Biostatistics in simple
Presented By :
Syeda Tamanna Yasmin
ID: DU2020PHD0034
Doctoral Research Scholar
Department of Microbiology
INTRODUCTION TO BIOSTATISTICS
■ Statistics is the discipline that concerns the collection, organization, analysis,
interpretation and presentation of data
■ Biostatistics can be defined as the application of the mathematical tools used in
statistics to the fields of biological sciences and medicine.
■ It comprises a set of principles and methods for generating and using quantitative
evidence to address scientific questions, for estimating unknown quantities and for
quantifying the uncertainty in our estimates.
■ Applications :
o To study the correlation between attributes in the same population.
o Design , monitor, analyze, interpret and report of results.
o Develop statistical methods to address questions.
o Tabulations and graphical presentations of findings.
COLLECTION OF DATA:
It is the process of gathering and measuring information on targeted variables in an
established system, which then enables one to answer relevant questions and evaluate
outcomes.
■ Primary Data: Information collected through original or first-hand research.
■ Secondary Data: Information that has been collected by others.
Types :
■ Quantitative data are measures of values or counts and are expressed as numbers. (
numeric data)
■ Qualitative data are measures of 'types' and may be represented by a name, symbol,
or a number code.
■ Discrete data: data that takes only specific value
■ Continuous data : data that can take values from a given range
Sampling
The sample is the group of individuals who will actually participate in the research.
■ Sampling frame :The sampling frame is the actual list of individuals that the sample will be drawn from.
Ideally, it should include the entire target population (and nobody who is not part of that population).
■ Sample size :The number of individuals in the sample depends on the size of the population, and on how
precisely the results to be represented for the population as a whole.
There are two types of sampling methods:
Probability sampling involves random selection, allows to make statistical inferences about the whole group.
1. Simple random sampling
2. Systematic sampling
3. Stratified sampling
4. Cluster sampling
Non-probability sampling involves non-random selection based on convenience or other criteria.
1. Convenience sampling
2. Voluntary response sampling
3. Purposive sampling
4. Snowball sampling
Accuracy and Precision
■ Accuracy refers to the closeness of a measured value to a standard or known value.
■ Precision refers to the closeness of two or more measurements to each other.
■ Precision is independent of accuracy.
■ The significant figures (also known as the significant digits or precision) are the digits
of value which carry meaning towards the resolution of the measurement.
1. All non-zero numbers ARE significant.
2. Zeros between two non-zero digits ARE significant.
3. Leading zeros are NOT significant. .
4. Trailing zeros to the right of the decimal ARE significant.
5. Trailing zeros in a whole number with the decimal shown ARE significant.
6. Trailing zeros in a whole number with no decimal shown are NOT significant.
7. Exact numbers have an INFINITE number of significant figures.
8. For a number in scientific notation: N x 10x, all digits comprising N are significant by the first 6 rules; "10"
and "x" are NOT significant
ERROR
• Error :A statistical error is the (unknown) difference
between the retained value and the true value.
- Type I error is the rejection of a true null hypothesis (also
known as a "false positive" finding or conclusion).
- type I errors can be thought of as errors of commission
- Type II error is the non-rejection of a false null hypothesis
(also known as a "false negative" finding or conclusion.
- type II errors as errors of omission.
Methods of presentation of statistical data
1. Tabulation:
■ Tables are form of presenting data simply from masses of statistical data in rows and columns design.
■ In a statistical table the parts include: title, stub, caption and box, body, source and foot note
■ Tabulation can be in form of
(i) Simple Tables
(ii) Frequency distribution table (i.e., data is split into convenient groups) :It tells how often something happened. The
frequency of an observation tells the number of times the observation occurs in the data.
This class intervals has open end class, class limits, class boundaries, calculations, class mark, class width, class frequency.
Source : https://www.toppr.com/guides/maths/statistics/frequency-distribution/s
In group data :(i) Continuous class interval
(ii)Discontinuous class interval
2. Charts and Diagrams
The methods used are:
(a) Bar Charts:
They are merely a way of presenting a set of numbers by the length of a bar. The bar chart can be simple,
multiple or component type.
(b) Histogram:
It is a pictorial diagram of frequency distribution. It consists of a series of blocks. The class intervals are
given along the horizontal axis and the frequencies along the vertical axis.
(c) Frequency Polygon:
A frequency distribution may be represented diagrammatically by the frequency polygon. It is obtained by
joining the mid-points of the histogram blocks.
(d) Line Diagram:
Line diagram are used to show the trend of events with the passage of time.
(e) Pie Charts:
Instead of comparing the length of a bar, the areas of segments of a circle are compared. The area of each
segment depends upon the angle.
(f) Pictogram:
Pictogram is a popular method of presenting data to the “man in the street. Small pictures or symbols are used
to present the data.
3. Statistical Maps:
When statistical data refer to geographic or administrative areas, it is presented either as “Shaded Maps”
or “Dot Maps” according to suitability.
4. Statistical Averages:
The term “average” implies a value in the distribution, around which the other values are distributed.
The types of averages used are:
(i) The Mean (Arithmetic Mean):To obtain the mean, the individual observations are first added together, called summation or ‘S’ then
divided by the number of observations. Means is denoted by the sign X̅ (called “X bar”).
(ii) The Median:
It is an average of a different kind, which does not depend upon the total and number of items. To obtain the median, the data is first
arranged in an ascending or descending order 0 of magnitude, and then the value of the middle observation is located.
A. Simple series ( ungrouped data):
B. Grouped data:
■ (i). Discrete series
■ (ii). Continuous series
(iii) The Mode:
It is the most frequent item in series of observations.
A. Ungrouped data ( simple series)
B. Grouped series
■ ( i) Discrete series :
■ ( ii) Continuous data
5. Measures of Dispersion:
(a) The Range:
It is defined as the difference between the highest and lowest figures in a given sample. The range is taken as the difference between the
midpoints of the extreme categories. Range ( R) =Largest value ( L) – Smallest value ( S)
(b) The Mean Deviation:
It is the average of the deviations from the arithmetic mean.
(c) The Standard Deviation:
In simple terms, it is defined as “Root-Means- Square-Deviation”.
(d). Variance: The square of standard deviation is called variance and is denoted by σ2
So, variance = ( S.D) 2 = σ2
6. Theoretical distribution
Probability: Probability is the measure of the likelihood that an event will occur in a
Random Experiment. Probability is quantified as a number between 0 and 1, where,
loosely speaking, 0 indicates impossibility and 1 indicates certainty.
■ There are three major types of probabilities:
• Theoretical Probability
• Experimental Probability
• Axiomatic Probability
Formula of probability
The probability formula is defined as the possibility of an event to happen is equal to the
ratio of the number of favourable outcomes and the total number of outcomes.
Probability of event to happen P(E) = Number of favourable outcomes/Total Number of outcomes
(1) Normal Distribution:
The normal distribution or normal curve is an important concept in
statistical theory. The shape of the curve will depend upon the
mean and standard deviation which in turn will depend upon the
number and nature of observation.
(2). The binomial Distribution is a probability distribution that summarizes the likelihood that a
value will take one of two independent values under a given set of parameters or assumptions.
(3).Multimonial Distribution : Multimonial distribution is a generalization of the binomial
distribution.
(4).Poisson Distribution: a Poisson distribution is a statistical distribution that shows how many
times an event is likely to occur within a specified period of time. It is used for independent events
which occur at a constant rate within a given interval of time.
7. Tests of Significance: it is a formal procedure for comparing observed data with a claim (also called a
hypothesis), the truth of which is being assessed.
(a). Chi-Square Test:
Chi-square (x2) test offers an alternate method of testing significance of difference between two proportions. It
has advantage that it can be used when more than two groups are to be compared.
(b). Null hypothesis: A null hypothesis usually states that there is no relationship between the two variables.
(c). Alternative hypothesis :the alternative hypothesis is a position that states something is happening,
(d).Student's t-distribution (or simply the t-distribution) is any member of a family of continuous probability
distributions that arises when estimating the mean of a normally distributed population in situations where
the sample size is small and the population standard deviation is unknown
( e) Z-test to determine whether two population means are different when the variances are known and the
sample size is large. It can be used to test hypotheses in which the z-test follows a normal distribution.
(f). ANOVA : is a collection of statistical models and their associated estimation procedures (such as the
"variation" among and between groups) used to analyze the differences among group means in a sample
8.Permutation and combination
■ permutation relates to the act of arranging all the members of a set into some sequence
or order, or if the set is already ordered, rearranging its elements, a process called
permuting. Permutations occur, in more or less prominent ways, in almost every area of
mathematics. They often arise when different orderings on certain finite sets are considered.
■ combination is a way of selecting items from a collection, such that (unlike
permutations) the order of selection does not matter. In smaller cases, it is possible to
count the number of combinations. Combination refers to the combination of n things taken
k at a time without repetition. To refer to combinations in which repetition is allowed.
nPr = (n!) / (n-r)!
9.Correlation and Regression:
i. Correlation:
Measures the statistical relationship between two sets of variables, without assuming that
either is dependent or independent. C.C. of 1.0 implies exact similarity and C.C. of 0.0
means no relationship.
a. Perfect positive correlation
b. Perfect negative correlation
c. Partial Perfect positive correlation
d. Partial negative correlation
e. Absolutely no correlation
ii. Regression:
Measures relationship between two sets of variables but assumes that one is dependent and
the other is independent.
a. Simple regression
b. Multiple regression
c. Linear regression
d. Non linear regression
10. Reliability and Validity:
Reliability: The extent to which there is repeatability of an individual’s score or other’s
test result.
(a) Test Retest Reliability: High correlation between scores on the same test given on
two occasions.
(b) Alternate Form Reliability:High correlation between two forms of the same test.
(c) Split Half Reliability:High correlation between two halves of the same test.
(d) Inter Rater Reliability: High correlation between results of two or more raters of
the same test.
Validity: The extent to which a test measures what it is designed to measure
(a) Predictive Validity:Ability of the test to predict outcome.
(b) Content Validity:Whether the test selects a representative sample of the total tests
for that variable.
(c) Construct Validity:How well the experiment test the hypothesis underlying it.
Reliability Paradox:
A very reliable test may have low validity precisely because its results do not change
i.e., it does not measure true changes.
REFERENCES
■ Introduction to Biostatistics ( a textbook of biometry ) by Dr. Pranab Kr. Banarjee, S. Chand
and company pvt. Ltd.reprint 2016.
■ Statistical methods by S.P Gupta, Sultan Chand and sons educational publishers, Reprint
2019.
■ https://www.slideshare.net/DrMedical2/basic-concepts-for-biostatistics
■ https://byjus.com/maths/probability/
Biostatistics

Biostatistics

  • 1.
    Biostatistics in simple PresentedBy : Syeda Tamanna Yasmin ID: DU2020PHD0034 Doctoral Research Scholar Department of Microbiology
  • 2.
    INTRODUCTION TO BIOSTATISTICS ■Statistics is the discipline that concerns the collection, organization, analysis, interpretation and presentation of data ■ Biostatistics can be defined as the application of the mathematical tools used in statistics to the fields of biological sciences and medicine. ■ It comprises a set of principles and methods for generating and using quantitative evidence to address scientific questions, for estimating unknown quantities and for quantifying the uncertainty in our estimates. ■ Applications : o To study the correlation between attributes in the same population. o Design , monitor, analyze, interpret and report of results. o Develop statistical methods to address questions. o Tabulations and graphical presentations of findings.
  • 3.
    COLLECTION OF DATA: Itis the process of gathering and measuring information on targeted variables in an established system, which then enables one to answer relevant questions and evaluate outcomes. ■ Primary Data: Information collected through original or first-hand research. ■ Secondary Data: Information that has been collected by others. Types : ■ Quantitative data are measures of values or counts and are expressed as numbers. ( numeric data) ■ Qualitative data are measures of 'types' and may be represented by a name, symbol, or a number code. ■ Discrete data: data that takes only specific value ■ Continuous data : data that can take values from a given range
  • 4.
    Sampling The sample isthe group of individuals who will actually participate in the research. ■ Sampling frame :The sampling frame is the actual list of individuals that the sample will be drawn from. Ideally, it should include the entire target population (and nobody who is not part of that population). ■ Sample size :The number of individuals in the sample depends on the size of the population, and on how precisely the results to be represented for the population as a whole. There are two types of sampling methods: Probability sampling involves random selection, allows to make statistical inferences about the whole group. 1. Simple random sampling 2. Systematic sampling 3. Stratified sampling 4. Cluster sampling Non-probability sampling involves non-random selection based on convenience or other criteria. 1. Convenience sampling 2. Voluntary response sampling 3. Purposive sampling 4. Snowball sampling
  • 5.
    Accuracy and Precision ■Accuracy refers to the closeness of a measured value to a standard or known value. ■ Precision refers to the closeness of two or more measurements to each other. ■ Precision is independent of accuracy. ■ The significant figures (also known as the significant digits or precision) are the digits of value which carry meaning towards the resolution of the measurement. 1. All non-zero numbers ARE significant. 2. Zeros between two non-zero digits ARE significant. 3. Leading zeros are NOT significant. . 4. Trailing zeros to the right of the decimal ARE significant. 5. Trailing zeros in a whole number with the decimal shown ARE significant. 6. Trailing zeros in a whole number with no decimal shown are NOT significant. 7. Exact numbers have an INFINITE number of significant figures. 8. For a number in scientific notation: N x 10x, all digits comprising N are significant by the first 6 rules; "10" and "x" are NOT significant
  • 6.
    ERROR • Error :Astatistical error is the (unknown) difference between the retained value and the true value. - Type I error is the rejection of a true null hypothesis (also known as a "false positive" finding or conclusion). - type I errors can be thought of as errors of commission - Type II error is the non-rejection of a false null hypothesis (also known as a "false negative" finding or conclusion. - type II errors as errors of omission.
  • 7.
    Methods of presentationof statistical data 1. Tabulation: ■ Tables are form of presenting data simply from masses of statistical data in rows and columns design. ■ In a statistical table the parts include: title, stub, caption and box, body, source and foot note ■ Tabulation can be in form of (i) Simple Tables (ii) Frequency distribution table (i.e., data is split into convenient groups) :It tells how often something happened. The frequency of an observation tells the number of times the observation occurs in the data. This class intervals has open end class, class limits, class boundaries, calculations, class mark, class width, class frequency. Source : https://www.toppr.com/guides/maths/statistics/frequency-distribution/s In group data :(i) Continuous class interval (ii)Discontinuous class interval
  • 8.
    2. Charts andDiagrams The methods used are: (a) Bar Charts: They are merely a way of presenting a set of numbers by the length of a bar. The bar chart can be simple, multiple or component type. (b) Histogram: It is a pictorial diagram of frequency distribution. It consists of a series of blocks. The class intervals are given along the horizontal axis and the frequencies along the vertical axis. (c) Frequency Polygon: A frequency distribution may be represented diagrammatically by the frequency polygon. It is obtained by joining the mid-points of the histogram blocks. (d) Line Diagram: Line diagram are used to show the trend of events with the passage of time. (e) Pie Charts: Instead of comparing the length of a bar, the areas of segments of a circle are compared. The area of each segment depends upon the angle. (f) Pictogram: Pictogram is a popular method of presenting data to the “man in the street. Small pictures or symbols are used to present the data. 3. Statistical Maps: When statistical data refer to geographic or administrative areas, it is presented either as “Shaded Maps” or “Dot Maps” according to suitability.
  • 9.
    4. Statistical Averages: Theterm “average” implies a value in the distribution, around which the other values are distributed. The types of averages used are: (i) The Mean (Arithmetic Mean):To obtain the mean, the individual observations are first added together, called summation or ‘S’ then divided by the number of observations. Means is denoted by the sign X̅ (called “X bar”).
  • 10.
    (ii) The Median: Itis an average of a different kind, which does not depend upon the total and number of items. To obtain the median, the data is first arranged in an ascending or descending order 0 of magnitude, and then the value of the middle observation is located. A. Simple series ( ungrouped data): B. Grouped data: ■ (i). Discrete series ■ (ii). Continuous series
  • 11.
    (iii) The Mode: Itis the most frequent item in series of observations. A. Ungrouped data ( simple series) B. Grouped series ■ ( i) Discrete series : ■ ( ii) Continuous data
  • 12.
    5. Measures ofDispersion: (a) The Range: It is defined as the difference between the highest and lowest figures in a given sample. The range is taken as the difference between the midpoints of the extreme categories. Range ( R) =Largest value ( L) – Smallest value ( S) (b) The Mean Deviation: It is the average of the deviations from the arithmetic mean. (c) The Standard Deviation: In simple terms, it is defined as “Root-Means- Square-Deviation”. (d). Variance: The square of standard deviation is called variance and is denoted by σ2 So, variance = ( S.D) 2 = σ2
  • 13.
    6. Theoretical distribution Probability:Probability is the measure of the likelihood that an event will occur in a Random Experiment. Probability is quantified as a number between 0 and 1, where, loosely speaking, 0 indicates impossibility and 1 indicates certainty. ■ There are three major types of probabilities: • Theoretical Probability • Experimental Probability • Axiomatic Probability Formula of probability The probability formula is defined as the possibility of an event to happen is equal to the ratio of the number of favourable outcomes and the total number of outcomes. Probability of event to happen P(E) = Number of favourable outcomes/Total Number of outcomes
  • 14.
    (1) Normal Distribution: Thenormal distribution or normal curve is an important concept in statistical theory. The shape of the curve will depend upon the mean and standard deviation which in turn will depend upon the number and nature of observation. (2). The binomial Distribution is a probability distribution that summarizes the likelihood that a value will take one of two independent values under a given set of parameters or assumptions. (3).Multimonial Distribution : Multimonial distribution is a generalization of the binomial distribution. (4).Poisson Distribution: a Poisson distribution is a statistical distribution that shows how many times an event is likely to occur within a specified period of time. It is used for independent events which occur at a constant rate within a given interval of time.
  • 15.
    7. Tests ofSignificance: it is a formal procedure for comparing observed data with a claim (also called a hypothesis), the truth of which is being assessed. (a). Chi-Square Test: Chi-square (x2) test offers an alternate method of testing significance of difference between two proportions. It has advantage that it can be used when more than two groups are to be compared. (b). Null hypothesis: A null hypothesis usually states that there is no relationship between the two variables. (c). Alternative hypothesis :the alternative hypothesis is a position that states something is happening, (d).Student's t-distribution (or simply the t-distribution) is any member of a family of continuous probability distributions that arises when estimating the mean of a normally distributed population in situations where the sample size is small and the population standard deviation is unknown ( e) Z-test to determine whether two population means are different when the variances are known and the sample size is large. It can be used to test hypotheses in which the z-test follows a normal distribution. (f). ANOVA : is a collection of statistical models and their associated estimation procedures (such as the "variation" among and between groups) used to analyze the differences among group means in a sample
  • 16.
    8.Permutation and combination ■permutation relates to the act of arranging all the members of a set into some sequence or order, or if the set is already ordered, rearranging its elements, a process called permuting. Permutations occur, in more or less prominent ways, in almost every area of mathematics. They often arise when different orderings on certain finite sets are considered. ■ combination is a way of selecting items from a collection, such that (unlike permutations) the order of selection does not matter. In smaller cases, it is possible to count the number of combinations. Combination refers to the combination of n things taken k at a time without repetition. To refer to combinations in which repetition is allowed. nPr = (n!) / (n-r)!
  • 17.
    9.Correlation and Regression: i.Correlation: Measures the statistical relationship between two sets of variables, without assuming that either is dependent or independent. C.C. of 1.0 implies exact similarity and C.C. of 0.0 means no relationship. a. Perfect positive correlation b. Perfect negative correlation c. Partial Perfect positive correlation d. Partial negative correlation e. Absolutely no correlation ii. Regression: Measures relationship between two sets of variables but assumes that one is dependent and the other is independent. a. Simple regression b. Multiple regression c. Linear regression d. Non linear regression
  • 18.
    10. Reliability andValidity: Reliability: The extent to which there is repeatability of an individual’s score or other’s test result. (a) Test Retest Reliability: High correlation between scores on the same test given on two occasions. (b) Alternate Form Reliability:High correlation between two forms of the same test. (c) Split Half Reliability:High correlation between two halves of the same test. (d) Inter Rater Reliability: High correlation between results of two or more raters of the same test. Validity: The extent to which a test measures what it is designed to measure (a) Predictive Validity:Ability of the test to predict outcome. (b) Content Validity:Whether the test selects a representative sample of the total tests for that variable. (c) Construct Validity:How well the experiment test the hypothesis underlying it. Reliability Paradox: A very reliable test may have low validity precisely because its results do not change i.e., it does not measure true changes.
  • 19.
    REFERENCES ■ Introduction toBiostatistics ( a textbook of biometry ) by Dr. Pranab Kr. Banarjee, S. Chand and company pvt. Ltd.reprint 2016. ■ Statistical methods by S.P Gupta, Sultan Chand and sons educational publishers, Reprint 2019. ■ https://www.slideshare.net/DrMedical2/basic-concepts-for-biostatistics ■ https://byjus.com/maths/probability/