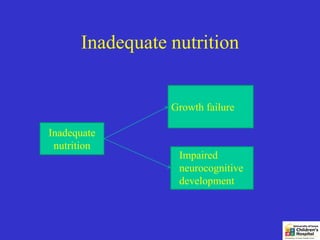
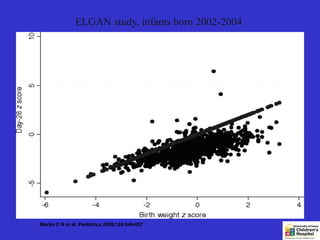
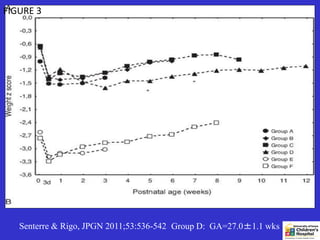
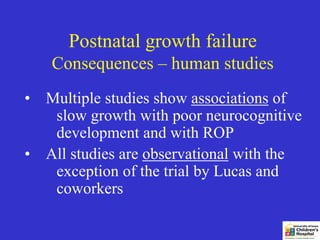
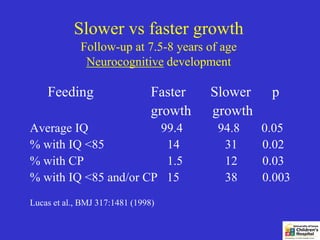
Postnatal growth failure
  and its prevention

    Ekhard E. Ziegler, M.D.
  Fomon Infant Nutrition Unit
      University of Iowa
Outline
Growth failure
Nutritional support - General
Early enteral nutrition = Gut priming
Transition feeding
Late enteral nutrition
Post-discharge nutrition
1995; 26-29 weeks gestation
NICHD Growth Observational Study
                  2000
                              Extrauterine          50th         10th

                              Growth
                              Restriction
                  1500
 Weight (grams)


                  1000
                                                                  Intrauterine growth
                                                                  (50th and 10th percentile)
                                                                  24-25 weeks
                                                                  26-27 weeks
                                                                  28-29 weeks
                   500


                         24              28                 32                                 36

Ehrenkranz RA, et al. Pediatrics
                                     Postmenstrual Age (weeks)                                      4
1999;104:280-9.
Postnatal growth failure

     Consequences
McCance and Widdowson
Postnatal growth failure
   Consequences – human studies
• Multiple studies show associations of
   slow growth with poor neurocognitive
   development and with ROP
• All studies are observational with the
   exception of the trial by Lucas and
   coworkers
Postnatal growth failure and
         neurocognitive outcome 8-20-12
                        Birth year   Age at FU
Weisglas-Kuperus 2009   1983          19 yr
Hack 1991               1977-79        8 yr
Lucas 1998              1982-84        8 yr
Kan et al. 2008         1991-92        8 yr
Claas 2011              1996-2005      5.5 yr
Franz 2009              1996-99        5 yr
Latal-Hajnal 2003       1983-94*       2 yr
Ehrenkranz 2006         1994-95        2 yr
Belfort 2011            2001-06        2yr
Rozé 2012               2003-08        2 yr
Georgieff 1985          1983           1 yr
Postnatal growth failure and
        neurocognitive outcome 8/20/12
                        Birth year   Age at FU
Hack 1991               1977-79        8 yr
Lucas 1998              1982-84        8 yr
Weisglas-Kuperus 2009   1983          19 yr
Latal-Hajnal 2003       1983-94        2 yr
Georgieff 1985          1983           1 yr
Kan et al. 2008         1991-92        8 yr
Ehrenkranz 2006         1994-95        2 yr
Franz 2009              1996-99        5 yr
Claas 2011              1996-05        5.5 yr
Belfort 2011            2001-06        2yr
Rozé 2012               2003-08        2 yr
Slower vs faster growth
             Follow-up at 7.5-8 years of age
              Neurocognitive development

    Feeding                     Faster   Slower    p
                                growth   growth
Average IQ             99.4               94.8    0.05
% with IQ <85           14                 31     0.02
% with CP               1.5                12     0.03
% with IQ <85 and/or CP 15                 38     0.003
Lucas et al., BMJ 317:1481 (1998)
VLBW infants (<1250 g), N= 219, z-scores for weight


From Latal-Hajnal et al., J Pediat 2003;143:163
Extrauterine growth failure
   B. Latal-Hajnal et al., J Pediat 2003;143:163-70

            MDI at age 2 yr
AGA, no growth failure                    101.7
SGA, catch-up                              98.2

AGA, growth failure                         94.9
SGA, no catch-up                            94.7
Growth failure and neuro-
           developmental outcome
         Ehrenkranz et al., Pediatrics 2006;117:1253
Setting: NICHD Neonatal Network
Subjects: Infants born September 1994 and August 1995
      with birth weight 500–1000 g (N=600 discharged)
Outcomes: 1. Follow-up at 18-22 months (MDI,
               PDI, neurologic assessment (N=495)
            2. Weight gain from regained birth weight to
                    discharge
Growth failure and neuro-developmental
outcome
Ehrenkranz et al., Pediatrics 2006;117:1253

                                   Q1         Q2     Q3     Q4
 Weight gain (g/kg/d)             12.0        15.6   17.8   21.2
 Head circ. gain (cm/week) 0.77               0.90   0.96   1.07
 Cerebral palsy (%)               21          13     13     6
 MDI <70 (%)                      39          37     34     21
 PDI <70 (%)                      35          32     18     14
 Neurodev. impairm. (%)           55          49     41     29
25

       20

       15
% CP


       10

        5

        0
                   Q1                Q2                Q3     Q4
                                        Weight Gain

       Data of Ehrenkranz et al., Pediatrics 2006; 117:1253
Growth 1 Week to Term and
        18-month Bayley scores
Belfort et al., Pediatrics 2011;128:e899-e906
(Data from Australian DINO study [high-dose DHA] conducted by
   Makrides & Gibson 2001-2005; infants <33 wks)
                          Points per 1 z-score increment
                           MDI                       PDI
All infants             2.4 (0.8 - 3.9)         2.7 ( 1.2 - 4.2)
<1250 g                 4.7 (2.1 - 7.4)         5.9 ( 3.2 - 8.6)
>1250 g                 1.0 (-0.8 - 2.8)        0.8 (-0.9 - 2.5)
AGA                     1.6 (0.0 - 3.3)         1.9 (0.3 - 3.5)
SGA                    11.7 (4.5 - 18.8)       11.2 (1.8 - 20.7)
Does slow growth have positive
           effects?
Slow growth may lead to more favorable
      cardiovascular health outcomes
It definitely leads to bad neurocognitive
      outcomes
Therefore, slow growth is unequivocally
      worse than faster growth
Disadvantages clearly outweigh advantages
Slow weight gain and ROP
The relative risk of Severe ROP for each
10 g/day lowering of weight gain was
           1.15 (CI 1.06-1.24)

Binenbaum et al., Pediatrics 2011;127:e607-14
ELBW Infants enrolled in Need of Transfusion study
2000-2003
Early growth and risk of ROP
1. Wallace et al., J AAPOS 2000;4:343-7
    Threshold ROP was associated with GA at
    birth, weight gain, volume of transfused
    RBC, sepsis
2. Allegaert et al., J AAPOS 2003;7:34-37
    IUGR and postnatal weight gain are risk
    factors for threshold ROP
Postnatal growth failure

Q: How does growth failure cause poor
   neurocognitive development, ROP?
A: It does not
Q: Then how is the association explained?
A: Both have the same cause – inadequate
   nutrition
Inadequate nutrition


                 Growth failure

Inadequate
 nutrition
                  Impaired
                  neurocognitive
                  development
Postnatal growth failure

       Cause(s)
Nutrient requirements
Protein and energy requirements of
         preterm infants (parenteral)

Body weight (g)    Protein    Energy     Prot/Energy
                  (g/kg/d)   (kcal/kg/d) (g/100 kcal)
 500- 700            3.5        89          3.9
 700- 900            3.5        92          3.8
 900-1200            3.5       101          3.5
1200-1500            3.4       108          3.1
1500-1800            3.2       109          2.9
1800-2200            3.0       111          2.7
Protein and energy requirements of
         preterm infants (enteral)

Body weight   Protein      Energy      Prot/Energy
  (g)         (g/kg/d)   (kcal/kg/d)   (g/100 kcal)
 500-700        4.0         105           3.8
 700-900        4.0         108           3.7
 900-1200       4.0         119           3.4
1200-1500       3.9         125           3.1
1500-1800       3.6         128           2.8
1800-2200       3.4         131           2.6
Recommended Intakes
         ESPGHAN 2010*
                        Protein
                   g/kg/d           g/100 kcal
Weight <1000g      4.0-4.5           3.6-4.1
Weight 1000-1800 g 3.5-4.0           3.2-3.6
                        Energy
                     110-135 kcal/kg/d

*J Pediat Gast Nut 2010;50:85-91
Protein and energy intakes (per kg body weight)

                   Year    N       BW          Age            Age
                                  (GA)       4 weeks        6 weeks
                                    g    Energy Protein Energy Protein
Simmer      Aus   92-94    90   <2078     109      2.5   114      2.7
Carlson     US       95    39   <1300      97      2.6   103      2.7
Olsen       US    94-96   564   <1500     102      2.5    -         -
Radmacher   US    97-00   220   <1000      98      2.8   108      2.9
Regan       NZ       98    37   <32 wk    108      2.3   149      3.0
Embleton    UK       99    38   <1750     121      3.1    -         -
Carlson     US       01    46   <1000     107      3.1   116      3.2
Cormack     NZ    03-04    34   <1790     140      2.8    -         -
Carlson     US       06    68   <1000     110      3.3   118      3.4
Postnatal growth failure
                 Cause
Q: How do we know that inadequate protein
   intakes is causing growth failure?
A: 1. Protein is limiting for growth
   2. Calories are not limiting if >100 kcal/kg
   3. Protein intakes are generally less than
     required for growth similar to the fetus
Postnatal growth failure
                  Cause
• All studies reporting nutrient intakes
  show inadequate intakes
• Inadequate intakes are linked to poor
  neurocognitive outcome
Postnatal growth failure
                  Definition

• Falling off of fetal growth trajectory

• AGA at birth, SGA at 36 weeks PMA
 (for comparative purposes)
Can we define a degree of growth
failure that is free of adverse effects?

                No
Postnatal growth failure

  Do we still have it?
Postnatal growth failure

   Is alive and well
Henriksen et al. Br J Nutr 2009;102;1179-86   VLBW infants born 2003-2005
ELGAN study, infants born 2002-2004


Martin C R et al. Pediatrics 2009;124:649-657
FIGURE 3


   Senterre & Rigo, JPGN 2011;53:536-542 Group D: GA=27.0±1.1 wks   2
Prevention of postnatal growth
            failure
Postnatal growth failure


Prevention begins at birth and
comes through good nutrition
Objective of nutritional support


   To protect the brain
Phases of nutritional support
Phase 1: - Parenteral nutrition
         - Gut priming
Phase 2: Transition feeding: Enteral
           phased in, parenteral phased
out
Phase 3: Enteral (late)
Phase 4: Post-discharge
Early nutrition period
Phases of nutritional support
Phase 1: Parenteral
Parenteral nutrition of premature
               infants
Q: Why parenteral nutrition?
A: Because immaturity of the gut precludes
     enteral nutition in adequate amounts
Q: Who needs parenteral nutrition?
A: All infants weighing <1800 g (optional for
     infants >1800 g)
Parenteral nutrition
                Recent history
Before 1999: - Glucose only from birth
     - Amino acids started on Day 3-4, low
     dose, gradually increased
     - Lipids Day 4-5, low dose, slowly increased
About 1999: Amino acids Day 1-2, still low dose
About 2002: Amino acids at time zero, 1.5 g/kg/d
2005: te Baake et al., time zero at 2.6 g/kg/d
2010: Transition to time zero nearly complete,
           dose 3.0 to 3.5 g/kg/d
Data of B E Stephens et al., Pediatrics 2009;123:1337 124 ELBW infants born in 2000 and 2001
Data from BE Stephens et al., Pediatrics 2009;123:1337
Data of B E Stephens et al., Pediatrics 2009;123:1337   124 ELBW infants born in 2000 and 2001
Data from BE Stephens et al., Pediatrics 2009;123:1337
Parenteral nutrition of premature
             infants
                 Principles
• Start AA at birth, lipids within 24 hrs
• Push GIR
• Keep as short as possible but as long as
     necessary
Parenteral nutrition of the premature
                infant
             Starter NVN at Iowa
•   First intravenous fluid
•   (30 -) 60 ml/kg/d
•   10% glucose, 5% amino acids,
•   Na 10 mEq/L (as phosphate)
•   Ca 20 mEq/L (as gluconate)
•   Mg 4 mEq/L
•   No potassium, trace elements, vitamins
3/12/10
Parenteral nutrition

          Full NVN as soon as possible
•   10% Glucose, increase GIR q 12 hrs
•   3.5 g/kg/d of amino acids (no need to go
                               to 4 g/kg/d)
•   Full electrolytes, minerals, trace minerals,
        vitamins
•   Don't look at BUN
From: Ridout et al., J Perinatol. 2005;25:130
Parenteral nutrition of premature
             infants
              Amino acids
• No need to go higher than 3.5 g/kg/day
• No need (excuse) for going below 3.5 g/
     kg/day
                Glucose
• Push GIR
Parenteral nutrition
                 Lipids
• Start within 24 hrs of birth
• Primary reason is DHA
• Dose 1 g/kg/d
• Give slowly
• No need to monitor triglycerides
Intralipid
Soybean oil                  20 g/dl
Egg yolk phospholipids         1.2 g/dl
Fatty acids
       Linoleic acid   50 %         bad
       Linolenic acid   7%
       Arachidonic      0.3 %
       DHA              0.34 %      good
Alpha-tocopherol             1.45 mg/dl
Parenteral nutrition of VLBW infants
                Good practice 2011
• Start amino acids within 2 hrs of birth
• Start with 3 g/kg/d (minimum of 1.5 g/kg/dkg/d)
       and increase to maximum 3.5 g/kg/d
• Start lipids within 24 hrs of birth at 1.0 g/kg/d and
       increase to 2.0 g/kg/d
• Start glucose at 4 mg/kg/min and increase daily by
       1-2 mg/kg/min if maintaining euglycemia
• Don’t stop TPN until enteral feeds are >90% of full
The importance of parenteral nutrition


        It protects the brain
Good nutrition does not save
            lives
      It saves brains
Fenton chart

Postnatal growth failure and its prevention

  • 1.
    Postnatal growth failure and its prevention Ekhard E. Ziegler, M.D. Fomon Infant Nutrition Unit University of Iowa
  • 2.
    Outline Growth failure Nutritional support- General Early enteral nutrition = Gut priming Transition feeding Late enteral nutrition Post-discharge nutrition
  • 3.
  • 4.
    NICHD Growth ObservationalStudy 2000 Extrauterine 50th 10th Growth Restriction 1500 Weight (grams) 1000 Intrauterine growth (50th and 10th percentile) 24-25 weeks 26-27 weeks 28-29 weeks 500 24 28 32 36 Ehrenkranz RA, et al. Pediatrics Postmenstrual Age (weeks) 4 1999;104:280-9.
  • 5.
  • 6.
  • 7.
    Postnatal growth failure Consequences – human studies • Multiple studies show associations of slow growth with poor neurocognitive development and with ROP • All studies are observational with the exception of the trial by Lucas and coworkers
  • 8.
    Postnatal growth failureand neurocognitive outcome 8-20-12 Birth year Age at FU Weisglas-Kuperus 2009 1983 19 yr Hack 1991 1977-79 8 yr Lucas 1998 1982-84 8 yr Kan et al. 2008 1991-92 8 yr Claas 2011 1996-2005 5.5 yr Franz 2009 1996-99 5 yr Latal-Hajnal 2003 1983-94* 2 yr Ehrenkranz 2006 1994-95 2 yr Belfort 2011 2001-06 2yr Rozé 2012 2003-08 2 yr Georgieff 1985 1983 1 yr
  • 9.
    Postnatal growth failureand neurocognitive outcome 8/20/12 Birth year Age at FU Hack 1991 1977-79 8 yr Lucas 1998 1982-84 8 yr Weisglas-Kuperus 2009 1983 19 yr Latal-Hajnal 2003 1983-94 2 yr Georgieff 1985 1983 1 yr Kan et al. 2008 1991-92 8 yr Ehrenkranz 2006 1994-95 2 yr Franz 2009 1996-99 5 yr Claas 2011 1996-05 5.5 yr Belfort 2011 2001-06 2yr Rozé 2012 2003-08 2 yr
  • 10.
    Slower vs fastergrowth Follow-up at 7.5-8 years of age Neurocognitive development Feeding Faster Slower p growth growth Average IQ 99.4 94.8 0.05 % with IQ <85 14 31 0.02 % with CP 1.5 12 0.03 % with IQ <85 and/or CP 15 38 0.003 Lucas et al., BMJ 317:1481 (1998)
  • 11.
    VLBW infants (<1250g), N= 219, z-scores for weight From Latal-Hajnal et al., J Pediat 2003;143:163
  • 12.
    Extrauterine growth failure B. Latal-Hajnal et al., J Pediat 2003;143:163-70 MDI at age 2 yr AGA, no growth failure 101.7 SGA, catch-up 98.2 AGA, growth failure 94.9 SGA, no catch-up 94.7
  • 13.
    Growth failure andneuro- developmental outcome Ehrenkranz et al., Pediatrics 2006;117:1253 Setting: NICHD Neonatal Network Subjects: Infants born September 1994 and August 1995 with birth weight 500–1000 g (N=600 discharged) Outcomes: 1. Follow-up at 18-22 months (MDI, PDI, neurologic assessment (N=495) 2. Weight gain from regained birth weight to discharge
  • 14.
    Growth failure andneuro-developmental outcome Ehrenkranz et al., Pediatrics 2006;117:1253 Q1 Q2 Q3 Q4 Weight gain (g/kg/d) 12.0 15.6 17.8 21.2 Head circ. gain (cm/week) 0.77 0.90 0.96 1.07 Cerebral palsy (%) 21 13 13 6 MDI <70 (%) 39 37 34 21 PDI <70 (%) 35 32 18 14 Neurodev. impairm. (%) 55 49 41 29
  • 15.
    25 20 15 % CP 10 5 0 Q1 Q2 Q3 Q4 Weight Gain Data of Ehrenkranz et al., Pediatrics 2006; 117:1253
  • 16.
    Growth 1 Weekto Term and 18-month Bayley scores Belfort et al., Pediatrics 2011;128:e899-e906 (Data from Australian DINO study [high-dose DHA] conducted by Makrides & Gibson 2001-2005; infants <33 wks) Points per 1 z-score increment MDI PDI All infants 2.4 (0.8 - 3.9) 2.7 ( 1.2 - 4.2) <1250 g 4.7 (2.1 - 7.4) 5.9 ( 3.2 - 8.6) >1250 g 1.0 (-0.8 - 2.8) 0.8 (-0.9 - 2.5) AGA 1.6 (0.0 - 3.3) 1.9 (0.3 - 3.5) SGA 11.7 (4.5 - 18.8) 11.2 (1.8 - 20.7)
  • 17.
    Does slow growthhave positive effects? Slow growth may lead to more favorable cardiovascular health outcomes It definitely leads to bad neurocognitive outcomes Therefore, slow growth is unequivocally worse than faster growth Disadvantages clearly outweigh advantages
  • 18.
    Slow weight gainand ROP The relative risk of Severe ROP for each 10 g/day lowering of weight gain was 1.15 (CI 1.06-1.24) Binenbaum et al., Pediatrics 2011;127:e607-14 ELBW Infants enrolled in Need of Transfusion study 2000-2003
  • 19.
    Early growth andrisk of ROP 1. Wallace et al., J AAPOS 2000;4:343-7 Threshold ROP was associated with GA at birth, weight gain, volume of transfused RBC, sepsis 2. Allegaert et al., J AAPOS 2003;7:34-37 IUGR and postnatal weight gain are risk factors for threshold ROP
  • 20.
    Postnatal growth failure Q:How does growth failure cause poor neurocognitive development, ROP? A: It does not Q: Then how is the association explained? A: Both have the same cause – inadequate nutrition
  • 21.
    Inadequate nutrition Growth failure Inadequate nutrition Impaired neurocognitive development
  • 22.
  • 23.
  • 26.
    Protein and energyrequirements of preterm infants (parenteral) Body weight (g) Protein Energy Prot/Energy (g/kg/d) (kcal/kg/d) (g/100 kcal) 500- 700 3.5 89 3.9 700- 900 3.5 92 3.8 900-1200 3.5 101 3.5 1200-1500 3.4 108 3.1 1500-1800 3.2 109 2.9 1800-2200 3.0 111 2.7
  • 27.
    Protein and energyrequirements of preterm infants (enteral) Body weight Protein Energy Prot/Energy (g) (g/kg/d) (kcal/kg/d) (g/100 kcal) 500-700 4.0 105 3.8 700-900 4.0 108 3.7 900-1200 4.0 119 3.4 1200-1500 3.9 125 3.1 1500-1800 3.6 128 2.8 1800-2200 3.4 131 2.6
  • 28.
    Recommended Intakes ESPGHAN 2010* Protein g/kg/d g/100 kcal Weight <1000g 4.0-4.5 3.6-4.1 Weight 1000-1800 g 3.5-4.0 3.2-3.6 Energy 110-135 kcal/kg/d *J Pediat Gast Nut 2010;50:85-91
  • 29.
    Protein and energyintakes (per kg body weight) Year N BW Age Age (GA) 4 weeks 6 weeks g Energy Protein Energy Protein Simmer Aus 92-94 90 <2078 109 2.5 114 2.7 Carlson US 95 39 <1300 97 2.6 103 2.7 Olsen US 94-96 564 <1500 102 2.5 - - Radmacher US 97-00 220 <1000 98 2.8 108 2.9 Regan NZ 98 37 <32 wk 108 2.3 149 3.0 Embleton UK 99 38 <1750 121 3.1 - - Carlson US 01 46 <1000 107 3.1 116 3.2 Cormack NZ 03-04 34 <1790 140 2.8 - - Carlson US 06 68 <1000 110 3.3 118 3.4
  • 30.
    Postnatal growth failure Cause Q: How do we know that inadequate protein intakes is causing growth failure? A: 1. Protein is limiting for growth 2. Calories are not limiting if >100 kcal/kg 3. Protein intakes are generally less than required for growth similar to the fetus
  • 31.
    Postnatal growth failure Cause • All studies reporting nutrient intakes show inadequate intakes • Inadequate intakes are linked to poor neurocognitive outcome
  • 32.
    Postnatal growth failure Definition • Falling off of fetal growth trajectory • AGA at birth, SGA at 36 weeks PMA (for comparative purposes)
  • 33.
    Can we definea degree of growth failure that is free of adverse effects? No
  • 34.
    Postnatal growth failure Do we still have it?
  • 35.
    Postnatal growth failure Is alive and well
  • 37.
    Henriksen et al.Br J Nutr 2009;102;1179-86 VLBW infants born 2003-2005
  • 38.
    ELGAN study, infantsborn 2002-2004 Martin C R et al. Pediatrics 2009;124:649-657
  • 39.
    FIGURE 3 Senterre & Rigo, JPGN 2011;53:536-542 Group D: GA=27.0±1.1 wks 2
  • 40.
  • 41.
    Postnatal growth failure Preventionbegins at birth and comes through good nutrition
  • 43.
    Objective of nutritionalsupport To protect the brain
  • 44.
    Phases of nutritionalsupport Phase 1: - Parenteral nutrition - Gut priming Phase 2: Transition feeding: Enteral phased in, parenteral phased out Phase 3: Enteral (late) Phase 4: Post-discharge
  • 45.
  • 46.
    Phases of nutritionalsupport Phase 1: Parenteral
  • 47.
    Parenteral nutrition ofpremature infants Q: Why parenteral nutrition? A: Because immaturity of the gut precludes enteral nutition in adequate amounts Q: Who needs parenteral nutrition? A: All infants weighing <1800 g (optional for infants >1800 g)
  • 48.
    Parenteral nutrition Recent history Before 1999: - Glucose only from birth - Amino acids started on Day 3-4, low dose, gradually increased - Lipids Day 4-5, low dose, slowly increased About 1999: Amino acids Day 1-2, still low dose About 2002: Amino acids at time zero, 1.5 g/kg/d 2005: te Baake et al., time zero at 2.6 g/kg/d 2010: Transition to time zero nearly complete, dose 3.0 to 3.5 g/kg/d
  • 49.
    Data of BE Stephens et al., Pediatrics 2009;123:1337 124 ELBW infants born in 2000 and 2001
  • 50.
    Data from BEStephens et al., Pediatrics 2009;123:1337
  • 51.
    Data of BE Stephens et al., Pediatrics 2009;123:1337 124 ELBW infants born in 2000 and 2001
  • 52.
    Data from BEStephens et al., Pediatrics 2009;123:1337
  • 53.
    Parenteral nutrition ofpremature infants Principles • Start AA at birth, lipids within 24 hrs • Push GIR • Keep as short as possible but as long as necessary
  • 54.
    Parenteral nutrition ofthe premature infant Starter NVN at Iowa • First intravenous fluid • (30 -) 60 ml/kg/d • 10% glucose, 5% amino acids, • Na 10 mEq/L (as phosphate) • Ca 20 mEq/L (as gluconate) • Mg 4 mEq/L • No potassium, trace elements, vitamins 3/12/10
  • 55.
    Parenteral nutrition Full NVN as soon as possible • 10% Glucose, increase GIR q 12 hrs • 3.5 g/kg/d of amino acids (no need to go to 4 g/kg/d) • Full electrolytes, minerals, trace minerals, vitamins • Don't look at BUN
  • 56.
    From: Ridout etal., J Perinatol. 2005;25:130
  • 57.
    Parenteral nutrition ofpremature infants Amino acids • No need to go higher than 3.5 g/kg/day • No need (excuse) for going below 3.5 g/ kg/day Glucose • Push GIR
  • 58.
    Parenteral nutrition Lipids • Start within 24 hrs of birth • Primary reason is DHA • Dose 1 g/kg/d • Give slowly • No need to monitor triglycerides
  • 59.
    Intralipid Soybean oil 20 g/dl Egg yolk phospholipids 1.2 g/dl Fatty acids Linoleic acid 50 % bad Linolenic acid 7% Arachidonic 0.3 % DHA 0.34 % good Alpha-tocopherol 1.45 mg/dl
  • 60.
    Parenteral nutrition ofVLBW infants Good practice 2011 • Start amino acids within 2 hrs of birth • Start with 3 g/kg/d (minimum of 1.5 g/kg/dkg/d) and increase to maximum 3.5 g/kg/d • Start lipids within 24 hrs of birth at 1.0 g/kg/d and increase to 2.0 g/kg/d • Start glucose at 4 mg/kg/min and increase daily by 1-2 mg/kg/min if maintaining euglycemia • Don’t stop TPN until enteral feeds are >90% of full
  • 61.
    The importance ofparenteral nutrition It protects the brain
  • 62.
    Good nutrition doesnot save lives It saves brains
  • 63.