Downloaded 117 times


![INFATRINI
per L
Energy (kJ) 4200kJ
Energy (kcal) 1000 kcal
Protein (g) 26
Fat (g) 54 [LCP’s]
CHO (g) 103
Calcium 800mg
Phosphorous 400 mg
Sodium 250 mg
Iron 10 mg
Zinc 9 mg
Vitamin A 810 µg RE
Vitamin D 17 µg
Potassium 930 mg
GOS/FOS 8 g
Osmolality
mOsm/kg/H2O
345
Osmolarity
mOsmol/L
295
Duggan C, et al. Nutrition in Pediatrics. 4th ed. Hamilton, Ontario, Canada: BC Decker Inc; 2008.](https://image.slidesharecdn.com/faltringgrowth-161103194508/85/Faltring-growth-35-320.jpg)


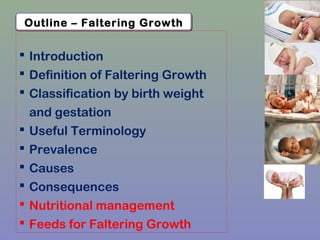
The document discusses 'faltering growth' in infants and children, emphasizing its prevalence, causes, and nutritional management. It highlights the severe implications of malnutrition, including increased morbidity and mortality rates, and outlines the necessity for early identification and intervention. Additionally, it reviews the classification of faltering growth by gestational age and birth weight, alongside tailored feeding strategies to support optimal growth and development.


