Downloaded 132 times
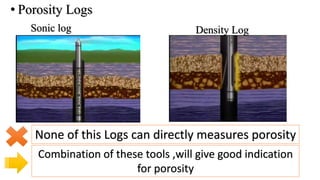
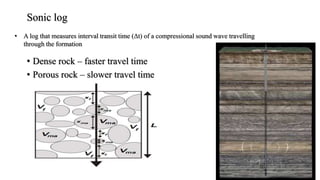
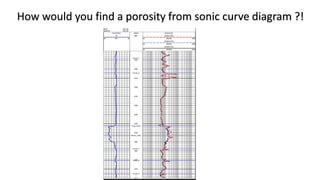
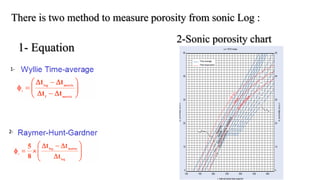
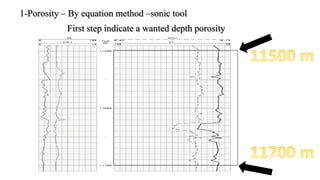
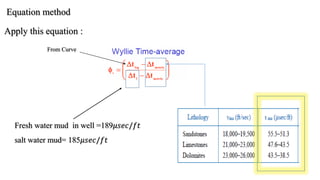
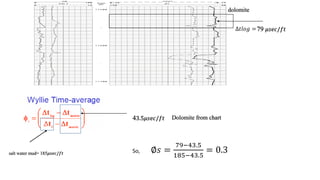
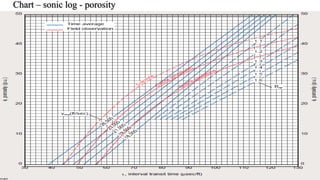

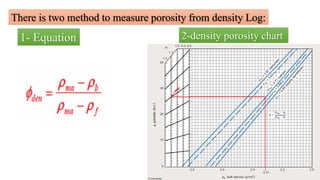


Porosity can be measured using sonic and density logs. Sonic logs measure the interval transit time of a sound wave through rock, with denser rock having faster transit times and more porous rock having slower times. There are two methods to calculate porosity from sonic logs: using an equation involving transit time and mud/rock properties, or using a sonic porosity chart. Similarly for density logs, porosity can be calculated from an equation using bulk and grain densities of the formation and mud, or looked up on a density porosity chart. Together, sonic and density logs provide good indications of porosity when used in combination.


![Well Log Interpretation and Petrophysical Analisis in [Autosaved]](https://cdn.slidesharecdn.com/ss_thumbnails/a24a638f-02ab-4332-9396-89ba2cdd02b4-161128031018-thumbnail.jpg?width=640&height=640&fit=bounds)


