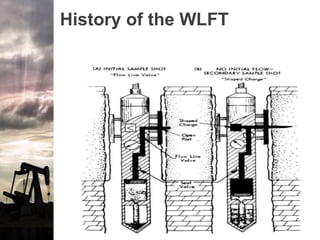
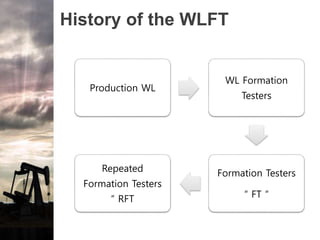
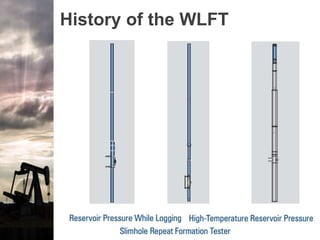
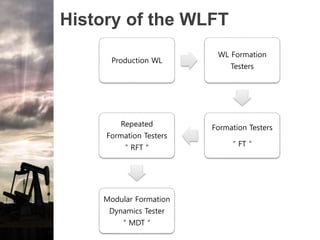
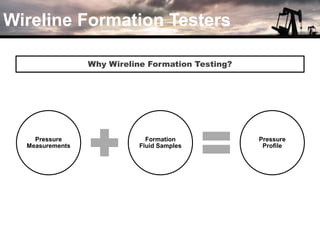
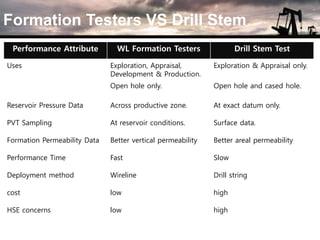
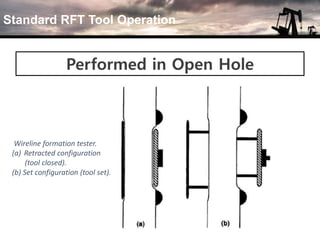
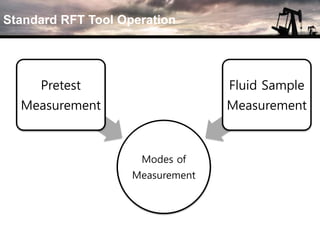
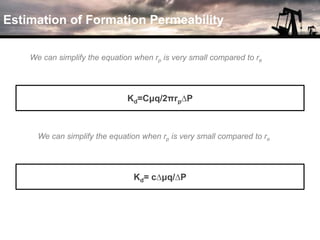
Omar Anwar ElGanzoury
Kirelos Saad Samir
REPEATED
FORMATION
TESTER
History of the WLFT
Production WL
WL Formation
Testers
Formation Testers
“ FT “
History of the WLFT
History of the WLFT
Production WL
WL Formation
Testers
Formation Testers
“ FT “
Repeated
Formation Testers
“ RFT
History of the WLFT
History of the WLFT
Production WL
WL Formation
Testers
Formation Testers
“ FT “
Repeated
Formation Testers
“ RFT “
Modular Formation
Dynamics Tester
“ MDT “
History of the WLFT
Wireline Formation Testers
Pressure
Measurements
Formation
Fluid Samples
Pressure
Profile
Why Wireline Formation Testing?
Formation Testers VS Drill Stem
Performance Attribute WL Formation Testers Drill Stem Test
Uses Exploration, Appraisal,
Development & Production.
Exploration & Appraisal only.
Open hole only. Open hole and cased hole.
Reservoir Pressure Data Across productive zone. At exact datum only.
PVT Sampling At reservoir conditions. Surface data.
Formation Permeability Data Better vertical permeability Better areal permeability
Performance Time Fast Slow
Deployment method Wireline Drill string
cost low high
HSE concerns low high
STANDARD
RFT TOOL
OPERATION
Standard RFT Tool Operation
Performed in Open Hole
Wireline formation tester.
(a) Retracted configuration
(tool closed).
(b) Set configuration (tool set).
Standard RFT Tool Operation
Modes of
Measurement
Pretest
Measurement
Fluid Sample
Measurement
Dual pretest formation tester sampling system.
ANALYSIS OF
PRESSURE
MEASUREMENT
Analysis of Pressure Measurement
A
Initial Pressure
Compression Effect
B
First Chamber
C
Chamber full
D E
Second Chamber
F
Both Chambers
are full
G
Final pressure reading
Analysis of Pressure Measurement
STUCK TOOL
PLUGGING
SEAL FAILURE
TIGHT TEST
MEASUREMENT
PROBLEMS
Analysis of Pressure Measurement
Depletion Profile Uses
Development
Reservoir
Connectivity
Reservoir
Quality
LOG
PRESENTATION
The pressures are given in analogue and digital form.
RFT DATA
INTERPRETATION
RFT Data Interpretation
What we get from interpreting pressure profiles
1. Diagnosing fluid-contact levels.
2. Identifying pressure transition-zone intervals.
3. Mapping reservoir fluid nature and trends and compartmentalization of res
ervoir.
RFT Data Interpretation
Distinguish fluid-contact levels and transition-zone intervals
The density of the fluid
represented by a
line ρfluid = 1/(9.81*G).
RFT Data Interpretation
Distinguish fluid-contact levels and transition-zone intervals
RFT Data Interpretation
Seal
Reservoir
Transition zones
Distinguish fluid-contact levels and transition-zone intervals
RFT Data Interpretation
Vertical Barriers
RFT Data Interpretation
Horizontal barriers
PRESSURE POFILES
CORRECTION WITH
OTHER LOGS
Pressure Profiles Corrections
ESTIMATION OF
FORMATION
PERMEABILITY
Estimation of Formation Permeability
∆P= (Cμq/2πrpkd) ∆(1-rp/re)
Where:
∆P is the drawdown pressure.
C is the geometric shape factor for flow.
q is the flow rate, cm/s.
μ is the viscosity of the fluid, cp.
rp is the effective probe radius, cm.
re is the outer radius of investigation of the flowing field, cm.
kd is the effective permeability
Estimation of Formation Permeability
Kd=Cμq/2πrp∆P
We can simplify the equation when rp is very small compared to re
Kd= c∆μq/∆P
We can simplify the equation when rp is very small compared to re
Estimation of Formation Permeability
Reason of
spurious
data points
reservoir
heterogeneity
over pressuresupercharging
References

Repeated Formation Testers