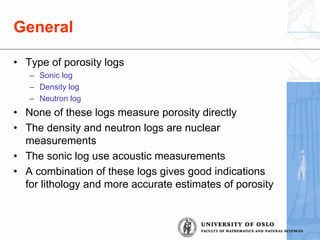
This document discusses different well log measurements for determining porosity: sonic, density, and neutron logs. It provides details on how each log works, the parameters it measures, and how porosity can be derived from each log. A key point is that no single log directly measures porosity. By combining the logs, a more accurate estimate of porosity can be obtained by accounting for factors like lithology, fluid type, and borehole conditions. Secondary effects that can impact porosity calculations from each log are also reviewed.


![Neutron-Density: Special Case
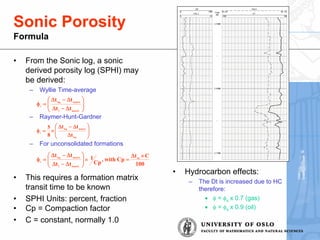
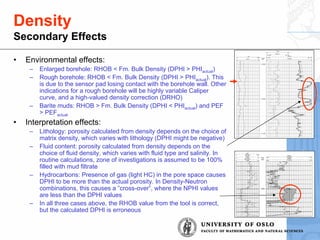
• Gas detection:
– Density porosity is too high
– Neutron porosity is too low
– Neutron porosity < Density porosity
– Cross-over
– Be aware, cross-overs may also be caused by lithological
differences as an affect of the scaling
D
N
2
D
2
N
ND
3
2
3
1
2
φ
×
+
φ
×
≈
φ
+
φ
=
φ
Porosity of a gas-bearing formation
SSTVD
6750
6760
6770
6780
6790
6800
6810
6820
6830
6840
6850
(6856)
6746
5.28 144.68
GR
0.3000 -0.0100
PHIN
0.3000 -0.0100
PHID
0.00 20.00
Pe
CaseStudy7 [SSTVD]](https://image.slidesharecdn.com/bwla-porositylogs-210214072811/85/Bwla-porosity-logs-28-320.jpg)


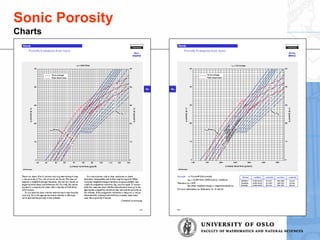
![PSP definition
• pseudostatic spontaneous potential
1. n. [Formation Evaluation]
The ideal spontaneous potential (SP) that would be observed opposite a shaly, permeable
bed if the SP currents were prevented from flowing. In the middle of a thick, permeable bed
whose resistivity is not too high, the SP reads close to the pseudostatic spontaneous
potential (PSP). In other conditions, however, the SP may be significantly less than the
PSP. The PSP ignores other potential sources and assumes that a surrounding shale is a
perfect cationic membrane. The ratio of the PSP to the static spontaneous potential is
known as the SP reduction factor, alpha. Alpha is less than 1 and is a function of the
shaliness, or cation-exchange capacity, within the sand. The higher this cation-exchange
capacity, the larger the internal membrane potential. The latter has the opposite polarity to
the liquid-junction potential and reduces the SP.
The PSP, and alpha, are reduced when hydrocarbons are introduced into shaly sands,
because the cation-exchange capacity in the sands is forced into a smaller conductive pore
volume and therefore has a larger relative effect.
Conclusion: PSP is difficult to determine](https://image.slidesharecdn.com/bwla-porositylogs-210214072811/85/Bwla-porosity-logs-37-320.jpg)
![Vsh by GR
( )
( )
[ ]
( ) rocks
older
for
),
1969
(
Larionov
,
1
2
33
.
0
V
)
1971
(
Clavier
,
7
.
0
I
38
.
3
7
.
1
V
)
1970
(
Steiber
,
I
2
3
I
V
rocks
Tertiary
),
1969
(
Larionov
,
1
2
08
.
0
V
estimate
order
st
1
,
response
Linear
,
I
V
GR
GR
I
2
shale
2
1
2
GR
shale
GR
GR
shale
I
7
.
3
shale
GR
shale
−
×
=
−
−
−
=
×
−
=
−
=
=
⋅
⋅
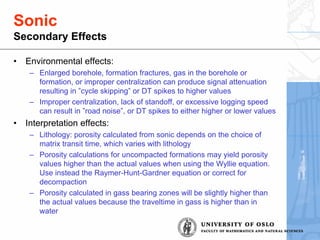
IGR = Gamma Ray index GRlog = GR reading from the log
GRmin = minimum GR GRmax = maximum GR
min
max
min
log
GR
GR
GR
GR
GR
I
−
−
=
Gamma Ray Index](https://image.slidesharecdn.com/bwla-porositylogs-210214072811/85/Bwla-porosity-logs-38-320.jpg)