This document defines key vocabulary terms related to population studies:
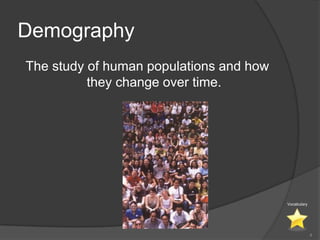
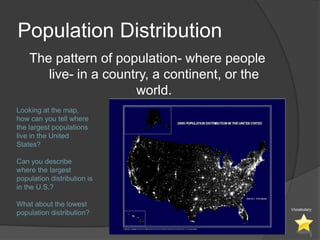
- Demography is the study of human populations and how they change over time. Other terms defined include population distribution, density, birth and death rates, life expectancy, demographic transition model, population pyramid, replacement rate, and dependency ratio. These concepts are used to analyze and understand population changes and characteristics around the world.