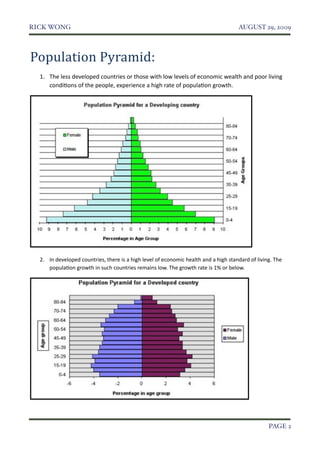
This document discusses topics related to population geography, including population growth rates, distribution, and density. It provides definitions and factors that influence high and low population growth rates. Countries with low economic development often have high growth rates due to high birth rates and low death rates. Developed countries typically have low growth rates because of low birth and death rates, attributed to factors like access to family planning, health care, and nutrition. The document also examines actions taken to control high or low growth rates and the consequences of each.
This document discusses key concepts in population geography and demography. It covers topics like population growth trends, fertility and mortality rates, population pyramids, and the demographic transition. The world population has grown exponentially from 5-10 million 12,000 years ago to over 6.5 billion in 2006 due to declining death rates as societies developed. Regional differences exist in population measures due to varying economic and social conditions.
The document discusses population trends and theories in the Philippines. It provides population statistics from 2005-2010 that show the total population and breakdown by sex is increasing. It also discusses population density and lists the most and least populated provinces. Several theories on population are explained, including Malthusian theory that population will outpace food supply, and demographic transition theory that describes declining death rates and eventual population stabilization. Both opportunities and challenges of a large population for economic development are noted.
The document discusses several topics related to population density, distribution, and growth rates:
- World population is around 6 billion, with 3/4 living in densely populated areas in East Asia and South Asia. China and India have the largest populations.
- Total fertility rates vary widely between countries, from over 7 children per woman in Niger and Mali to just over 1 in Italy and Japan. The US rate is 2.5.
- Infant mortality rates range from 3 per 1000 births in Singapore and Iceland to over 150 in Sierra Leone and Afghanistan. The US rate is just over 6.
- The demographic transition model outlines four stages of population growth as countries develop from pre-industrial to industrialized economies
The document discusses population distribution and demography. It defines key population terms like population density, birth rate, death rate, and population pyramids. It notes that population distribution is uneven worldwide, with more people living near coastal regions and cities. Europe's population is currently falling due to low birth rates, though migration can help offset this decline. The global population is growing, with China and India having the largest populations currently.
GROWTH RATE & ESTIMATED POPULATION INDUSTRIALIZATION/URBANIZTIONKanav Bhanot
A BRIEF PRESENTATION ON GROWTH RATE & ESTIMATED POPULATION INDUSTRIALIZATION/URBANIZTION
NOTE- FONTS MAY APPEAR WEIRD BCOZ THE FONTS I USED DO NOT APPEAR IN THIS PPT.
Population studies involve acquiring knowledge about factors influencing population and its distribution. Population refers to the number of people in a given area. Population geography studies the distribution of human populations in a location. Population dynamics examines changes in population numbers due to factors like fertility, mortality, and migration. Population is both impacted by development processes and environmental factors, and influences development as a resource that transforms the environment. Key population terms include aging population, life expectancy, child and infant mortality rates, fertility rates, and dependency ratios. Physical factors like climate and terrain, and human factors like economic opportunities and transportation influence population distribution and density.
Demography is the statistical study of human populations with regards to births, deaths, and migration. It examines the size, structure, and distribution of populations over time. Key factors that influence population growth rates are birth rates, death rates, immigration, and emigration. India's population is growing rapidly due to high birth rates and declining death rates. This population growth creates challenges for the economy and environment. The government is trying to address this through family planning programs and education initiatives. Accurate population data in India comes from sources like the census, civil registration system, sample surveys, and sample registration system.
Class 12th Chapter 2(the world population) Geography Book Fundamentals of Human Development Complete Explanation of all concept of NCERT class 12th
It is easy to understand
All concept are taken under Guidance of Mrs Kavita Chabbra
The document provides an overview of population growth trends globally and in India. It discusses key topics like the demographic transition model, past and projected world population growth, and current population growth rates in different countries and regions. The demographic transition model outlines the typical stages that societies progress through as mortality and birth rates change due to factors like industrialization, urbanization, and increased access to family planning. World population grew slowly until the 18th century but has increased rapidly in recent centuries, reaching 6.8 billion in 2010, with most growth occurring in developing countries still in the early stages of the demographic transition.
The document defines key terms related to population and resources:
- Overpopulation occurs when resources are insufficient to maintain living standards for a country's population. Underpopulation is when resources exceed what the population can use. Optimum population balances resources and population.
- Resources include natural resources like raw materials and human resources like people and capital. Birth rate is births per 1000 people annually. Death rate is deaths per 1000 people annually.
- GDP is the value of goods/services produced divided by population. GNP includes goods/services produced abroad. Fertility is the average children per woman during her fertile years.
Causes and Consequences of Rapid Population GrowthUnica Chiara
Well, I'm not used of using too much words in my slides instead I used more pictures for clearer representation and just its title. I just emphasize those important details. And I hope this could help you out! Good luck! :)
This document discusses human population growth trends over time. It notes that the global human population reached 1 billion in 1830, 2 billion in 1930, 3 billion in 1960, 4 billion in 1975, 5 billion in 1987, 6 billion in 1999, and 7 billion in 2011. It also provides estimates of current birth and death rates worldwide. The document then discusses factors that have allowed unprecedented human population growth, such as advances in agriculture, medicine, and public health. It examines some potential problems associated with high population growth, especially in developing countries, including environmental degradation and resource scarcity. Finally, it outlines the demographic transition process and considers predictions for future global population size and stability.
The document discusses patterns in world population growth, comparing trends in more economically developed world (MEDW) and less economically developed world (LEDW) populations. MEDW populations are growing more slowly with fertility rates below replacement level, while LEDW continue to grow at 1.8% annually, though rates are declining as countries develop. The concepts of overpopulation, underpopulation, and optimum population are introduced based on relationships between population size, resources, technology, and living standards.
This document discusses demographic indicators such as birth rate, death rate, and migration rate in Pakistan. It provides details on how each indicator is calculated, recent statistics for Pakistan, and comparisons to other countries. The birth rate in Pakistan in 2010 was 27.28 per 1,000 people, while the death rate was 6.69 per 1,000 people in 2013. Net migration in Pakistan was negative, with nearly 2 million more people leaving the country than entering in 2010. The document also covers types and reasons for migration like push/pull factors.
The document provides information about world population trends, including definitions of key demographic concepts. It discusses topics like population growth rates, birth and death rates, life expectancy, fertility rates, rural vs urban populations, and UN Millennium Development Goals. Data on population figures, distributions and projections for different countries and world regions are presented.
World human population growth through historyBiswajit Das
The human population has grown exponentially since 1350 AD, reaching over 7 billion currently. It took until 1800 for the population to reach 1 billion, but only 127 years to double to 2 billion in 1927. Rapid growth was driven by improved agriculture, medicine, and sanitation. Currently, the population grows by around 75 million per year and is expected to reach 8.5-10.9 billion by 2050. Population growth rates vary by region and development level, with less developed countries having higher birth rates and shorter doubling times. Continued rapid growth could stress environmental resources if not balanced.
Human beings are considered the most important resource for a country's development. A country's human resources are not evenly distributed and differ based on factors like education, sex, age, and characteristics. A population pyramid can show the composition of a country's population, including the percentage of males and females in different age groups. It reveals features like birth and death rates, number of dependents, and size of the labor force. Countries with high birth and death rates have broad bases and narrow tops in their pyramids, while countries with declining death rates have broader bases, representing more surviving children.
The document discusses two major revolutions that shaped human geography: the Agricultural Revolution began around 10,000 years ago as humans transitioned from hunting and gathering to farming, settling into villages. The Industrial Revolution began in 18th century Europe and was driven by technological innovations that increased agricultural and later industrial productivity. It also discusses models of population growth and debates around addressing overpopulation through reducing birth rates versus letting death rates increase.
This document discusses human resource distribution and population trends around the world. It notes that 90% of the world's population lives in just 10% of the land area, with certain regions like South and Southeast Asia, Europe and Northeastern North America being more densely populated. Population density is highest in South Central Asia at an average of 45 people per square km globally. Factors that influence population distribution include geography, climate, resources, as well as social and economic conditions. The document also examines population change through birth and death rates and provides population pyramid examples for India and China.
This document discusses various topics related to human resources and population distribution. It defines human resources as the ultimate resource and discusses how population is unevenly distributed worldwide based on geographical, social, cultural and economic factors. Some key points are: populations are concentrated in Asia and Africa, birth rates exceeding death rates have led to rapid global population growth, and population pyramids provide information on a country's population composition and dependency levels.
Population lesson 1 world population growthMs Geoflake
The world population grew slowly until 1900 but then increased rapidly, reaching 1 billion in 1900, 2.5 billion in 1950, and 7 billion in 2011. Most population growth occurs in developing countries with high birth rates, like India and China. While populations in developed countries are stable or declining, populations in developing countries continue to rise due to historically high birth rates and increasing lifespans. Rapid population growth creates challenges for governments to provide resources and threatens the environment, food security, and political stability.
The document discusses human resources and population distribution, density, and composition. It notes that over 90% of the world's population lives in 30% of the land area, with dense populations in South and Southeast Asia, Europe, and Northeastern North America. Population distribution is affected by geographical features like climate and resources. The average global population density is 51 people per square km, with South-Central Asia having the highest density. Population composition examines factors like age, sex, occupation, and can be viewed through population pyramids.
Here are the key features of this population pyramid:
- It has a very wide base, indicating high birth and fertility rates
- The population decreases rapidly as the age groups increase, showing high mortality rates, especially among males
- The pyramid narrows significantly at older age groups, demonstrating low life expectancy
- The shape is characteristic of a developing country with high birth/death rates and a youthful population
The document discusses population topics including population structure, population pyramids, census data collection, and the demographic transition model. It describes how population pyramids show the age and gender composition of a population and can reveal changes over time. It also explains that censuses aim to count every person in a country and collect key data like age, gender, occupation that help governments plan services. The demographic transition model shows typical stages of population change from high birth/death rates to low as countries develop.
The document discusses human resources and population distribution. It notes that people are a nation's greatest resource and turn natural resources into usable resources. It then discusses how human resources, like other resources, are unevenly distributed worldwide and vary in factors like education, age, and sex. More than 90% of the world's population lives in 10% of the land area. The distribution is uneven with some areas like South and Southeast Asia being very crowded and others like deserts and high altitude areas being sparsely populated. Climate, resources, and economic opportunities also influence population distribution and change over time.
The document discusses various topics relating to world population, including:
1. The current world population is approximately 7 billion as of 2012 and is expected to reach 11 billion by 2100. Global population growth is around 80 million people annually.
2. Population growth rates vary significantly between countries, with some experiencing major increases and others experiencing declines. A nation's population can increase through higher birth rates than death rates or through immigration.
3. The distribution of the world's population is uneven, with some areas being sparsely populated and others being densely populated. Tokyo has a population of over 25 million people.
The world population distribution, density and growthAshaJegadeesan
The document discusses key topics related to world population including:
1. The current world population is 7.8 billion as of 2020 and is unevenly distributed across the world.
2. Population density varies based on factors like climate, resources, and level of development. densely populated areas have over 200 people per square km while sparsely populated areas have under 1 person per square km.
3. Population growth is influenced by birth rates, death rates, and migration patterns. Most countries have experienced a demographic transition from high birth/death rates to low birth/death rates as development increased.
This document defines key vocabulary terms related to population studies:
- Demography is the study of human populations and how they change over time. Other terms defined include population distribution, density, birth and death rates, life expectancy, demographic transition model, population pyramid, replacement rate, and dependency ratio. These concepts are used to analyze and understand population changes and characteristics around the world.
This document provides an overview of key topics relating to world population, including growth trends, population structures, migration patterns, and aging populations. Specifically, it notes that the world population has grown rapidly to over 7 billion currently and is projected to reach 9 billion by 2050. Fertility rates have fallen globally but vary significantly between developed and developing regions. Population aging is occurring due to declining birth rates and increasing lifespans. Migration occurs internationally and within countries, with economic factors being a primary driver of movement.
This document discusses human population distribution and key issues related to demographics. It notes that three quarters of the world's population lives in only 5% of the land area, with two thirds living near oceans or rivers. Major population concentrations exist in East Asia including China, South Asia including India, Europe, and North America's northeast corridor. The document outlines the demographic transition from high birth and death rates to low rates, fueled by improved agriculture and medicine. It analyzes population growth trends, policies, and impacts of aging and disease using population pyramids.
This document discusses key concepts relating to population geography, including:
1) Population growth has increased dramatically over time, from 250 million people in 0 AD to over 6 billion in 1998.
2) Population is concentrated in regions like East Asia, South Asia, Europe, and North America, while sparsely populated areas include dry lands, wet lands, high lands, and cold lands.
3) Demographic transition refers to the change in population characteristics as a country develops, typically moving from high birth/death rates to low birth/death rates.
- There are over 7 billion people living unequally distributed across Earth's surface due to physical and human factors. Physical factors like climate, topography, soil and water availability influence where people live. Human factors like political, economic and technological decisions also impact population distribution.
- Asia has the largest population due to high birth rates and increased life expectancy. Africa has a young population with high birth rates, though also high death rates. Europe and North America have stabilized populations with low birth and death rates. There are global disparities in development between wealthy developed nations and poorer developing nations.
This document discusses factors that affect population distribution and differences in global population patterns. Physical factors like climate, topography, soil quality, and access to water influence where people live. Human factors such as economic opportunities, political decisions, and technology development also impact population distribution. There are large inequalities in population numbers and characteristics between more developed and less developed regions. Asia has the largest population while Oceania has the smallest population. Most countries in Africa and Asia have high population growth rates while rates are lower in Europe, North America, and Oceania.
World population is unevenly distributed, with 90% living in just 10% of the Earth's land area. The main geographic factors that influence population distribution are the availability of water, fertile land, a comfortable climate, and mineral resources. Areas with more economic opportunities like cities, industrial belts, and places with religious significance tend to have denser populations. Population change is measured by birth rate, death rate, and migration. While it took millions of years for the global population to reach 1 billion, it only took 12 years to grow from 5 to 6 billion due to declining mortality rates.
The document discusses human population growth and its environmental impacts. It notes that the world population grew from 300 billion in AD 1 to over 6 billion in 2000 and is projected to reach over 9 billion by 2050. This rapid growth is called a population explosion. The explosion is driven by decreased mortality rates due to improvements in food production, public health, and medicine. Effects of the explosion include overstressing natural resources, increased pollution, food shortages, and unemployment. Air and water pollution increase as industries and vehicles grow to serve larger populations, which also leads to deforestation for new lands. Managing this explosion will be a major challenge going forward.
People are considered a nation's most important resource as it is humans who transform natural resources into useful goods through intelligence and labor. The distribution of human population across the world is uneven, with over 90% living in just 10% of the land, concentrated most densely in parts of Asia, Europe, and Northeastern North America. Key factors that influence population patterns include the environment, resources, infrastructure, culture, religion, and economic opportunities in different areas.
Human beings are the ultimate resource of a nation as they transform natural resources into useful goods through intelligence and labor. The distribution of human population across the globe is uneven, with over 90% living in just 10% of the world's land area, concentrated most densely in South and Southeast Asia, Europe, and Northeastern North America. Almost three quarters of the global population resides in just two continents - Asia and Africa. Factors like climate, resources, infrastructure, culture and religion all impact population distribution patterns around the world.
More than 90% of the world's population lives in just 30% of the land area, with 60% residing in 10 countries alone. Population density refers to the number of people per unit area and is affected by geographical factors like climate, soil fertility, availability of water, and presence of minerals. Social, cultural, and economic considerations also influence population distribution patterns. Population change is driven by birth and death rates as well as migration patterns. Composition of a population can be understood by analyzing factors such as age, sex, education level, occupation, income, and health status using tools like population pyramids.
This document provides an overview of population ecology, including terminology, patterns of dispersion, population growth, survival patterns, factors influencing population growth, methods for determining population size, human population trends, and social organization. Some key points include:
- Population ecology is the study of populations in relation to their environment. A population is a group of the same species in the same area. Density, dispersion, demography, birth and death rates are important concepts.
- Population growth can follow exponential or logistic patterns. Carrying capacity is the maximum population an environment can sustain. Survival patterns include Type I, II, and III curves.
- Population growth is influenced by density-dependent factors like competition, disease, predation, and
Population ecology studies populations in relation to their environment. Key concepts include population density, dispersion patterns, growth rates, and factors influencing population size like competition and predation. Population size can be estimated using methods like mark-recapture. Human populations have grown exponentially but are slowing, with developing regions still experiencing most growth. Community structures involve interactions between species like competition, predation, herbivory and symbiosis. Ecological succession over time involves communities changing from pioneers to a climax.
This document discusses several key topics related to populations and the environment:
1. It describes characteristics of populations like population size, density, distribution, and age structure.
2. It discusses factors that influence population size such as births, deaths, immigration and emigration.
3. Several issues related to population growth are outlined, including impacts on public health, food supply, freshwater, coastlines, forests, biodiversity, and climate change.
4. Steps that can be taken to promote sustainability and stabilize world population are proposed.
Population growth, demographic transition model and overpopulated placesdavidgeo3eso
This document discusses population growth and the demographic transition model. It explains that a population's growth is determined by the birth rate and death rate. If births exceed deaths, the population increases, and vice versa. It then outlines the 5 stages of the demographic transition model: 1) high birth and death rates with steady population, 2) high births and falling deaths leads to rapid growth, 3) falling birth and death rates leads to rapid growth, 4) continuing fall in rates leads to slower growth, 5) potential future stage with below replacement fertility and stable/falling population. The document provides examples of countries at different stages of the model.
This document discusses key concepts related to population studies including:
1. It defines population and demography, and describes sources used to obtain population information like censuses and municipal registers.
2. It explains factors that influence population distribution including physical conditions, human conditions, and population density which is used to measure distribution.
3. It describes natural population change through births and deaths, and how birth rates and death rates are calculated and vary between developed and developing countries. Natural increase is the difference between births and deaths.
4. It discusses regular and migratory population movement, with migratory movement including emigration and immigration between places.
The document discusses the demographic transition model (DTM) which describes 5 stages of population change that countries typically pass through as they develop economically and socially. Stage 1 involves high and fluctuating birth and death rates, resulting in a stable population. Stages 2-3 involve declining death rates leading to population growth. Stage 4 has low and stable birth and death rates. Stage 5 has declining birth rates below death rates. The document provides details on characteristics and drivers of population change at each stage.
1. RICK WONG! AUGUST 29, 2009
Geography
Topics covered
- Population Growth
- Population Distribution
- Population Density
- Factors leading to a low death rate
- Factors leading to a high death rate
- Consequences of a high rate of population growth
- Actions to control a high rate of population growth (Overpopulation)
- Low rate of population growth
- Factors that lead to a low death rate/What causes a low death rate
- Factors that lead to a low birth rate/What causes a low rate of popula-
tion growth
- Consequences of a low rate of population growth
- Actions to manage a low rate of population growth (Underpopulation)
- Actions to manage an ageing population
- Definitions
! PAGE 1
2. RICK WONG! AUGUST 29, 2009
Population
Pyramid:
1. The
less
developed
countries
or
those
with
low
levels
of
economic
wealth
and
poor
living
condi8ons
of
the
people,
experience
a
high
rate
of
popula8on
growth.
2. In
developed
countries,
there
is
a
high
level
of
economic
health
and
a
high
standard
of
living.
The
popula8on
growth
in
such
countries
remains
low.
The
growth
rate
is
1%
or
below.
! PAGE 2
3. RICK WONG! AUGUST 29, 2009
Population Growth
- Population growth refers to a change in population size. This change can be posi-
tive or negative. There are also instances where there is no change in population
numbers, which is other wise known as zero population growth.
Factors affecting the world growth rate
- Changes in the world population growth rate are due to t wo factors: a rise in birth
rates and a fall in death rates.
Birth rate
- Number of live births per 1000 people per year. E.g. if the birth rate of a country
is 21 live births per 1000 people per year, it means that for every 1000 people in
the country, 21 people were born in that year.
Death rate
- Number of deaths per 1000 people that year. E.g. if the death rate of a country is
9 deaths per 1000 people per year, it means that for every 1000 people in the
country, 9 people died that year.
If there are more births than deaths/if the birth rate is higher than the death
rate, the country experiences an increase in population. Thus, the rate of natural
increase is positive
If there are more deaths than births/if the death rate is higher than the birth
rate, the country experiences a decrease in population. Thus the rate of natural in-
crease is negative.
If both the birth rate death rate is equal, we say that the growth rate is zero.
Therefore the population size remains the same.
Population Distribution
- The way people are spread out over an area of land.
Most of the world’s population lives on only 10% of the Earth’s surface and even so,
it is not evenly spread out. Some places like Switzerland have small populations
while others like China and India have large populations. Thus, the population distri-
bution is uneven.
RICK WONG! PAGE 3
4. RICK WONG! AUGUST 29, 2009
Factors influencing population distribution
-Physical Environment
Places that has more population
-Volcanoes
1) This is because the foot of the volcano has very fertile soil. Each time a volcano
erupts, a big amount of volcanic ash is released. This ash contains many minerals
which make the soil very fertile and helps crops to grow well.
2) Many people also travel to view the spectacular scenery of volcanoes, such as its
lava fountains, geysers and even its eruptions. Locals earn money from providing
services, such as conducting guided tours or trekking trips up the volcano. There are
also hot springs and inns to provide a home for the tourists when they are there.
3) The villagers living in the vicinity of the volcano can also make use of the heat to
obtain geothermal energy.
-River Deltas
This is because river deltas usually have large populations as the soil is very fertile due
to sediments deposited by the rivers. Examples include the Nile Delta in Egypt and the
Ganges River Delta bet ween India and Bangladesh.
Places that have less population
-Mountains
This is because mountains cannot support settlements as they have steep slopes. The
temperature on the mountains decreases as the altitude increases and the atmos-
phere also gets thinner. Such conditions are unsuitable for humans to live in.
-Deserts
This is because the climate in deserts is hot and dry and these conditions are also un-
suitable for humans to live in as they will not be able to obtain enough food and wa-
ter. The temperature in deserts are also to hot in the morning and too cold at night for
humans to tolerate.
Therefore, for a place to have a lot of population, the weather and climate must not
be too extreme, as well as the temperature range. There must also be natural re-
sources, attractions and undulating land to facilitate agriculture, human activities
and settlements.
Level of technology
Technology here refers to the knowledge, skills and tools that people use to meet their
needs. With improvements in technology, environments which were previously un-
suitable for living can be converted into suitable living environments. For example
people can live in a desert if water can be channeled from a river to their living envi-
ronment.
RICK WONG! PAGE 4
5. RICK WONG! AUGUST 29, 2009
Population density
Population density gives us an idea of the number of people living in a particular area.
It is usually expressed in terms of the number of people per square kilometer of land.
Population density= Total number of people/Total land area
Population density varies from place to place. For example, Canada has a population
density of 3 people per square meter while Bangladesh has a population density of
1042 people per square meter. We say that Canada has a relatively sparse population,
and that Bangladesh has a relatively dense population.
Singapore has a population density of 6000 people per square meter. This is one of the
highest population densities in the world.
However, the population density doesn’t tell us about the actual number of people in an
area of the country. This is because even within a country, people are not evenly dis-
tributed and some regions are more crowded than others.
Cities generally have high population densities while countrysides and areas such as
deserts and forests usually have low population densities.
High rates and Low rates of Population growth
- High rate of population growth
The fastest population growth in the world today is experienced in less developed
countries. Less developed countries refer to countries with low levels of economic
wealth and poor living conditions. These countries usually experience a high rate of
population growth. Examples of such countries are found in Africa, South America and
some parts of Asia. India is one of the countries in Asia experiencing a population ex-
plosion. India’s population rose from 360 million in 1950 to over one billion in 2004.
We can use a population pyramid to show this pattern of population growth. A popula-
tion pyramid is a graph that gives us information about the number or percentage of
people in different age groups, and the proportion of males to females in a place. The
vertical scale tells us the age group of the population while the horizontal scale repre-
sents the percentage or the total number of people within that age group.
RICK WONG! PAGE 5
6. RICK WONG! AUGUST 29, 2009
Factors leading to a low death rate
1) Better medical and health care
Medical care refers to the availability of hospitals, clinics, doctors, medical equipment,
medicine and medical knowledge. Health care refers to immunization, nutritional
knowledge, the availability of community hospitals and other measures aimed at im-
proving the quality of life.
Better medical and health care have enabled many babies to survive beyond their first
year. When few babies die within the first year of birth, we say that the infant mortal-
ity rate is low. The infant mortality rate is the number of deaths among infants under
one year of age for every 1000 live births per year.
Also, when the elderly receive better medical care, they are able to live longer. We say
that the life expectancy has increased. Life expectancy refers to the average number of
years a person living in a particular area is expected to live. When people enjoy a longer
life expectancy, the death rate will fall.
2) Better hygiene
People are less prone to falling sick and contracting diseases if their living conditions
are clean and hygienic. In many countries, the death rate as greatly decreased when
there is a supply of clean water, and when the environment is clear of disease-carrying
pests and insects.
Factors leading to a high birth rate
1) Lack of family planning
Family planning refers to how many children a couple plans to have. In many less devel-
oped countries, people are less educated and know little about family planning methods.
They may also end up having children because of deep-rooted traditional beliefs and val-
ues, or religious beliefs. For example, some Hindu ceremonies require sons to perform re-
ligious rituals for parents. Therefore, couples may continue to have children until they
succeed in having a son.
2) Early marriages
Couples who marry at an early age tend to have larger families than those who marry
at a later age. This is because the number of years that women who marry early have
for childbearing is higher. Hence, in countries where people marry young, such as in cer-
tain parts of India, the birth rates tend to be high.
3) Preference for sons
Some societies such as those in rural parts of China or India, place a lot of importance on
having sons. Sons are seen as being capable of carrying on the family name or surname
when they marry while daughters are not. In addition, sons are able to continue working
on the farm when the parents grow old, unlike daughters, who will move away from the
family when they get married. Thus, couples continue to have children until they suc-
ceed in having sons.
RICK WONG! PAGE 6
7. RICK WONG! AUGUST 29, 2009
4) Need for farm labour
People in many less developed countries depend on farming to earn a living. Farm
work requires much labour and large families are therefore preferred as there will be
more hands to work on the land.
Consequences of a high rate of population growth
1) Higher demand for resources
With more people, the demand for resources such as food and water also increases. In
fact, many less developed countries suffer from shortage of food because not enough
food is being produced to feed the rapidly growing population.
2) Higher demand for housing
A rapid increase in population would also result in competition for housing. This is es-
pecially so in cities of less developed countries, which do not have sufficient housing
for its growing population. In some cities in India, for example, it is common to see
many people living in temporary shelters made of cardboard or wooden planks.
3) Higher demand for education
With more babies born every year, there is a need to ensure that there are sufficient
schools and teachers to educate the young. Less developed countries may lack the
funds to build more schools. As a result, not everyone will be able to attend school and
obtain a good education.
4) Higher demand for jobs
In a country with rapid population growth, there will be a lot of people competing for
a limited number of jobs. It has been estimated that about 30 million new jobs have
to be created in the world every year if every new person reaching working age is to
have a job!
5) Environmental problems
With a larger population, not only are the resources used by people, more waste, such
as used paper, empty bottles and sewage are produced. In less developed countries,
waste disposal ser vices and other public services are lacking. This has led to water
and land pollution.
RICK WONG! PAGE 7
8. RICK WONG! AUGUST 29, 2009
Actions to control a high rate of population growth (Overpopulation)
1) Education on family planning
In many countries, couples are taught various methods of controlling the size of their
family. For example, in India and Bangladesh, women from family planning agencies
have been sent to rural areas to educated the people and give advice on family plan-
ning.
2) Incentives and penalties
Rewards in the form of monetary incentives may be given to couples who have fewer
children. In contrast, those with more children could be penalized, for example, by
having to pay higher taxes.
China uses both incentives and penalties as means to slow down population growth.
The ‘One child policy’ was implemented in 1979 in response to rapid population
growth. This policy allowed each couple in the country to have only one child. Incen-
tives in the form of housing and education subsidies were given to couples who pledged
to have only one child. Couples who had more than one child had to pay heavy fines to
the government. In recent times however, some exceptions and revisions have been
made to the policy to allow certain couples to have more children. For example, if a
couple are each an only child, they would be allowed to have t wo children. This is to
prevent an imbalance in the population, because with so few babies born, there may
be less young people to care for the elderly in the future.
Low rate of population growth
The slowest rate of population growth today is experienced in developed countries.
Developed countries refer to countries with high levels of economic wealth and living
conditions. These countries usually experience a low rate of population growth. Exam-
ples of such countries are Japan and the United Kingdom.
Causes of a low rate of population growth
It has been obser ved that countries that experience a low rate of population growth
usually experience a low death rate as well as a low birth rate. In these countries,
people tend to live longer and fewer babies are born each year.
RICK WONG! PAGE 8
9. RICK WONG! AUGUST 29, 2009
Factors that lead to a low death rate/What causes a low death rate
1) Higher standards of living
In countries with high standards of hygiene, there is clean food, water and air. People
are less prone to contracting diseases such as cholera, which is associated with unhy-
gienic living conditions.
2) Better nutrition
In developed countries, people generally enjoy higher levels of income and can afford to
buy sufficient food and water. Food shortages are also rare in these countries.
3) Better medical and health care
With better medical and health care, people are able to enjoy longer and healthier
lives. For example, when vaccinations are easily available to the public, diseases can be
prevented from spreading in the country. In Singapore, all children are given vaccina-
tions to protect them from illnesses such as smallpox and measles. In addition, world-
class hospitals and well-trained doctors in Singapore enable people to enjoy excellent
medical care.
Factors that lead to a low birth rate/What causes a low rate of population growth
1) Later marriages
More people are marrying later and having children later in their lives. This could be
due to the fact that more women now have higher academic qualifications than before
and thus may choose to pursue a career before settling down and having children.
Since most women cannot conceive babies after they reach the age of 50, those who
marry later or delay having children are left with fewer years to have babies.
2) Fewer marriages
As more people choose to remain single, there will be fewer families and birth rates
will fall. With fewer births, the number of young people in a population decreases.
3) Preference for smaller families
Increasingly, people in developed countries prefer to have smaller families. This is
partly due to the increasing number of working women who find it difficult to balance
work and family and hence choose to have fewer children. More people today also feel
that the cost of raising children has increased. Such changing trends and values have
led to some couples not preferring to have children at all!
RICK WONG! PAGE 9
10. RICK WONG! AUGUST 29, 2009
Consequences of a low rate of population growth
1) Ageing population
Countries with low rate of population growth often have a growing percentage of elderly people com-
pared to young people in their population. These countries are said to have an ageing population. Exam-
ples of such countries include France, Germany and Japan.
With more elderly people and fewer youths joining the workforce, the burden on the working popula-
tion will increase.
2) Higher taxes
Public projects such as the building of hospitals and community centres are funded taxes collected
from the working population. With a shrinking population, fewer people will be in the workforce. This
will mean that each working person will have to pay more taxes to fund public projects, such as build-
ing more public facilities like swimming pools and libraries.
3) Smaller talent pool
With a low rate of population growth, there will be fewer people to lead and ser ve the country. This is
a problem for countries like Singapore, which already has a small population. Hence, it is necessary
for these countries to attract foreign talent.
Actions to manage a low rate of population growth (Underpopulation)
1) Encouraging marriage and childbearing
One solution to the problems is to increase birth rates. The government can encourage married couples
to have more children. In Singapore, couples are now encouraged to have three or more children. For
example, women who have more children when they are younger are given more tax rebates, that is,
the amount of taxes that they have to pay is reduced. The government has also encouraged the setting
up of more child care centres to look after children while their parents are at work.
2) Promoting facilities through tax incentives so that married couples would be encouraged to produce
more babies.
3) Providing facilities that promote marriage and parenthood.
4) Carrying out advertising campaigns to educate the public on benefits of getting married and having
children.
Consequences of an ageing population
1) When there is more elderly people, more funds are needed to provide medical care for the elderly
who fall sick quite often. Therefore there will be a strain in the government money as more funds are
needed to provide medical care to the elderly.
2) Government have to provide more pensions. This is because there are many elderly people and there-
fore the government has to provide more pensions.
RICK WONG! PAGE 10
11. RICK WONG! AUGUST 29, 2009
3) Government have to provide more care-homes. Since there are more elderly people,
some of the young children have no time and will therefore send their parents to care-
homes. Therefore the government has to provide more care-homes.
4) All of the above means more taxes on the workers, as more money is needed by the
government, and it's from the workers that they get that money. Therefore people
will have to pay higher taxes.
5) There will be lesser working population as many elderly people would have retired,
and there might be not enough workers to provide for the elderly population, there-
fore the country’s economy is at a high risk.
Actions to manage an ageing population
1) Meeting the needs of the elderly
As one of the consequences of a low rate of population growth is an ageing population,
countries with a low rate of population growth also need to address the challenges of
an ageing population. These include building special facilities for the elderly, helping
them to keep healthy and encouraging their families to care for them.
2) Building special facilities
More clinics and hospitals that specialise in the care of illnesses specific to the elderly
would have to be built. The need for homes catering to the elderly and other elderly-
friendly facilities will also increase.
3) Helping the elderly keep healthy
It is important for the elderly to keep healthy and active both physically and men-
tally. In Singapore, healthy living for the elderly is promoted through posters and
television programmes. Exercise classes and courses for lifelong learning at commu-
nity centres are also organized for them.
4) Encouraging families to look after the elderly
With their years of experience, the elderly have an important role to play in society.
As such, more families should take it upon themselves to look after the elderly. Various
community programmes as well as government incentives can help encourage this.
For example, family ties are promoted through various privileges and tax subsidies for
families that support their parents and grandparents.
RICK WONG! PAGE 11
12. RICK WONG! AUGUST 29, 2009
5) Extending working life
In an ageing population, unless the elderly can be persuaded to remain in the work-
force, the number of people in the workforce will slowly decrease. This means that
the working population will face a heavy burden of supporting the elderly. One way to
solve this problem is by raising the retirement age. In Japan, where one in every five
people are aged 65 years and above, the current retirement age is 65 and set to in-
crease. In Singapore, adjustments have also been made to the retirement age. In 1993,
the retirement age was fixed at 60 years. Six years later, the retirement age was
raised to 62. However, as Singapore faces an ageing population and rising health care
costs, the government is considering the possibility of increasing the retirement age
once again.
6) Encouraging family planning
The elderly need to have a home and enough money to live comfortably. To ensure this,
people need to have enough financial resources when they retire. With early plan-
ning, they will have sufficient resources to meet one’s life goals. This is also known as
financial planning.
The government can also play a part in encouraging financial planning through social
security schemes, pension schemes and retirement funds. For example, in Singapore,
the government ensures that all working Singaporeans have to set aside a portion of
their monthly salary in their Central Provident Fund (CPF). This sum of money will ac-
cumulate in their CPF and eventually be returned to them when they are older. When
they turn 55, they can withdraw a portion of the money from their CPF savings.
Upon turning 62, they can opt to have the rest of the money returned to them on a
monthly basis. This ensures that the elderly are able to maintain a good quality of life
when they retire.
RICK WONG! PAGE 12
13. RICK WONG! AUGUST 29, 2009
Glossary
Ageing population - A population that comprises a growing percentage of elderly peo-
ple.
Birth rate - The number of live births per 1000 people per year.
Death rate - The number of deaths per 1000 people per year.
Financial planning - Early planning to ensure people have enough resources to meet
their life’s goals.
High rate of population - Rapid increase in population.
Low rate of population - Slow increase in population.
Population density - Number of people living in a unit area of land.
Population distribution - The spread of people over a unit area of land.
Population growth - The change in population size. It can be positive or negative. In
instances where there is no change in population, the population growth is said to be
zero.
Rate of natural increase - Can be calculated by subtracting the death rate from the
birth rate.
Infant mortality rate - The number of deaths among infants under one year of age
for every 1000 live births per year.
Life expectancy - The average number of years a person living in a particular area is
expected to live.
RICK WONG! PAGE 13
14. RICK WONG! AUGUST 29, 2009
Deforestation
Causes of Deforestation
1) Used for Urban and Construction Purposes: The cutting down of trees for lumber
that is used for building materials, furniture, and paper products. Forests are also
cleared in order to accommodate expanding urban areas.
2) To Grow Crops: Forests are also cut down in order to clear land for growing crops.
3) To Create Grazing Land: Forests are cut down in order create land for grazing cat-
tle.
4) Used for Fuel: Trees are cut down in developing countries to be used as firewood or
turned into charcoal, which are used for cooking and heating purposes
Some of the other causes of deforestation are: clearing forests for oil and mining ex-
ploitation; to make highways and roads; slash and burn farming techniques; wildfires;
and acid rain.
Effects of deforestation
1) Erosion of Soil: When forest areas are cleared, it results in exposing the soil to the
sun, making it very dry and eventually, infertile, due to volatile nutrients such as ni-
trogen being lost. In addition, when there is rainfall, it washes away the rest of the
nutrients, which flow with the rainwater into water ways. Because of this, merely
replanting trees may not help in solving the problems caused by deforestation, for by
the time the trees mature, the soil will be totally devoid of essential nutrients. Ulti-
mately, cultivation in this land will also become impossible, resulting in the land be-
coming useless. Large tracts of land will be rendered permanently impoverished due to
soil erosion.
2) Disruption of the Water Cycle: Trees contribute in a large way in maintaining the
water cycle. They draw up water via their roots, which is then released into the at-
mosphere. A large part of the water that circulates in the ecosystem of rainforests,
for instance, remains inside the plants. When these trees are cut down it results in
the climate getting drier in that area.
3) Loss of Biodiversity: The unique biodiversity of various geographical areas is being
lost on a scale that is quite unprecedented. Even though tropical rainforests make up
just 6 percent of the surface area of the Earth, about 80-90 percent of the entire
species of the world exist here. Due to massive deforestation, about 50 to 100 species
of animals are being lost each day. The outcome of which is the extinction of animals
and plants on a massive scale.
RICK WONG! PAGE 14
15. RICK WONG! AUGUST 29, 2009
4) Flooding and Drought: One of the vital functions of forests is to absorb and store
great amounts of water quickly when there are heavy rains. When forests are cut
down, this regulation of the flow of water is disrupted, which leads to alternating
periods of flood and then drought in the affected area.
5) Climate Change: It is well known that global warming is being caused largely due
to emissions of greenhouse gases like carbon dioxide into the atmosphere. However,
what is not known quite as well is that deforestation has a direction association
with carbon dioxide emissions into the atmosphere. Trees act as a major storage de-
pot for carbon, since they absorb carbon dioxide from the atmosphere, which is then
used to produce carbohydrates, fats, and proteins that make up trees. When defores-
tation occurs, many of the trees are burnt or they are allowed to rot, which results
in releasing the carbon that is stored in them as carbon dioxide. This, in turn, leads to
greater concentrations of carbon dioxide in the atmosphere.
Direct causes of deforestation
The most important direct causes of deforestation include logging, the conversion of
forested lands for agriculture and cattle-raising, urbanization, mining and oil ex-
ploitation, acid rain and fire. However, there has been a tendency of highlighting
small-scale migratory farmers or "poverty" as the major cause of forest loss. Such
farmers tend to settle along roads through the forest, to clear a patch of land and to
use it for growing subsistence or cash crops. In tropical forests, such practices tend
to lead to rapid soil degradation as most soils are too poor to sustain agriculture.
Consequently, the farmer is forced to clear another patch of forest after a few
years. The degraded agricultural land is often used for a few years more for cattle
raising. This is a death sentence for the soil, as cattle remove the last scarce traces
of fertility. The result is an entirely degraded piece of land which will be unable to re-
cover its original biomass for many years. It is a major mistake to think that such
unsustainable agricultural practices only take place in tropical countries. Many
parts of North America and western Europe have become deforested due to unsus-
tainable agriculture, leading to severe soil degradation and in many cases abandon-
ment of the area by the farmers.
In other countries, clearcut logging practices have been the main reason for forest
loss. In the early nineties, Canada and Malaysia were famous examples of countries
where logging companies ruthlessly cleared mile upon mile of precious primary for-
ests. Here too, the historical perspective should not be overlooked. Countries like
Ireland and Scotland used to be almost entirely forested, but were nearly completely
cleared under British rule to provide timber for English shipbuilders. Today, logging
still forms the most important direct threat to forests in regions like the Guianan
shield (stable area of low relief in the Earth's crust), Central Africa, East Siberia and
British Columbia.
RICK WONG! PAGE 15
16. RICK WONG! AUGUST 29, 2009
The underlying causes of deforestation and forest degradation
During the last few decades, the forest crisis has prompted many international, re-
gional and national preser vation initiatives, yet many have had little success. There
is general agreement that this is due to the fact that these strategies were too fo-
cused on the immediate causes of deforestation, and neglected the underlying causes
which are multiple and interrelated. In some cases they are related to major interna-
tional economic phenomena, such as macro-economic strategies which provide a
strong incentive for short-term profit-making instead of long-term sustain ability.
Also important are deep-rooted social structures, which result in inequalities in land
tenure, discrimination against indigenous peoples, subsistence farmers and poor peo-
ple in general. In other cases they include political factors such as the lack of partici-
patory democracy, the influence of the military and the exploitation of rural areas by
urban elites. Overconsumption by consumers in high-income countries constitutes
another of the major underlying causes of deforestation, while in some regions un-
controlled industrialization is at the heart of forest degradation with widespread
pollution resulting in acid rain.
The causes of deforestation are many and varied, and it is impossible to cover them
all. However some examples can show how these causes are closely interrelated one
to each other.
The forces behind unsustainable agriculture
According to the FAO, 90 per cent of deforestation is caused by unsustainable agricul-
tural practices, while logging and plantation forestry play a greater role in forest
degradation. However debatable these figures may be, unsustainable agriculture is
undoubtedly one of the major direct causes of deforestation and forest degradation in
many countries of the world. A simplistic approach to the problem would imply blam-
ing the "ignorance" of the farmers involved in this process. The process is however
more complex. Few people actually decide that they want to leave their native land,
go to the forest, cut it and convert it into agricultural land. They are driven to such
actions by national and international forces with interests different to theirs. In
some countries, forests act as safety-valves to avoid social uprisings, in the following
way. The concentration of power and land in few hands results in large groups of dis-
possessed people, which may lead to confrontation. To avoid conflict, some of these
people are offered free land within the forests. Access to forests is made possible
through government-promoted road projects, either built to open up and "develop" the
forests or resulting from the commercial activities of logging, mining, and energy
generation. In the above example, it is clear that deforestation can take place only
because a number of government policies - social and economic - indirectly promote it.
Whilst the poor may operate the chainsaws or set the forest on fire, it is mostly gov-
ernments and corporations who are behind such actions.
RICK WONG! PAGE 16
17. RICK WONG! AUGUST 29, 2009
The far-reaching consequences of globalization
In other cases, forests are opened up for modern large-scale agriculture or cattle-
raising aimed at the export market. For example, forests have been converted for
cattle in Central America, for soy bean production in Brazil and for pulpwood in In-
donesia. In the first case, the process originated in the explosive development of a
fast food - hamburger - market in the US which required vast amounts of low-
quality cheap meat which could be produced in nearby tropical countries. The result
was widespread deforestation in Central America. Subsidized and highly intensive
meat production in Europe requires an ever-increasing supply of grains to feed live-
stock. Soy bean is one of the major inputs for such production and enormous patches
of forest have been opened up in Brazil - and in many other Southern countries - to
ensure the economic sustainability of that sector through the supply of cheap grain.
A similar situation occurs with paper: the continued growth of paper consumption,
particularly in high income countries, depends on the availability of cheap wood or
pulp to feed the paper mills. Forests are thus being cleared in Indonesia - and many
other parts of the world - to give way to eucalyptus plantations aimed at supplying
that market with increasing amounts of cheap raw material.
In the above cases, it is clear that the production of hamburgers in the US, of meat in
Europe and of paper in high-income countries are a contributory cause of deforesta-
tion in Central America, Brazil and Indonesia.
RICK WONG! PAGE 17