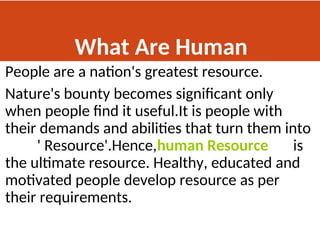
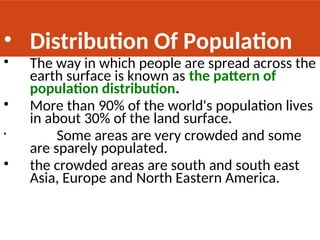
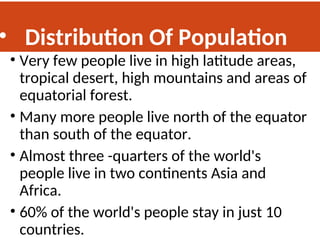
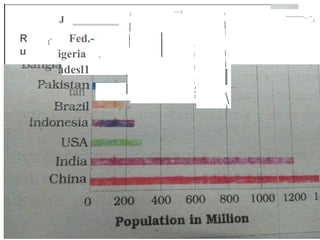
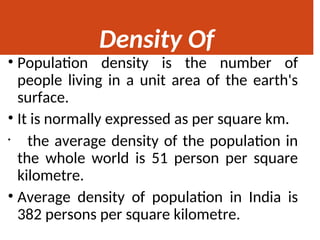
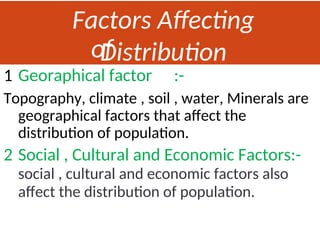
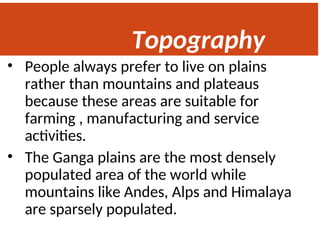
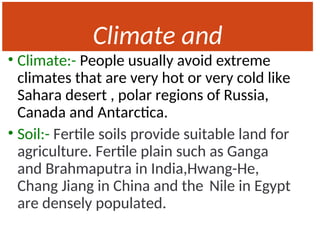
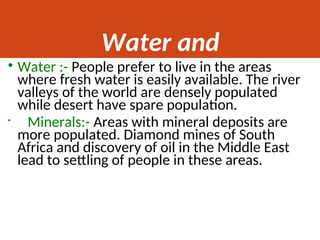
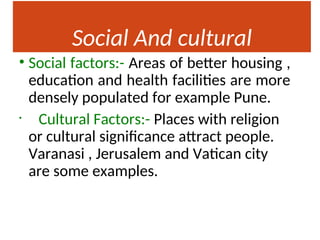
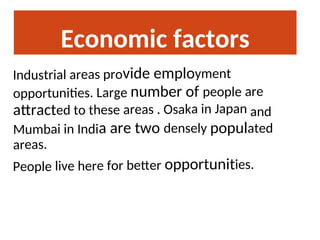
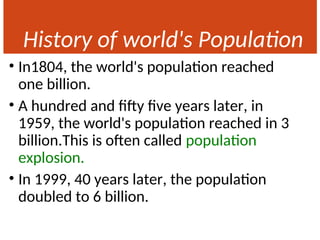
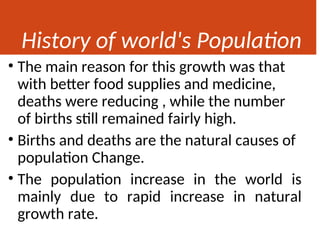
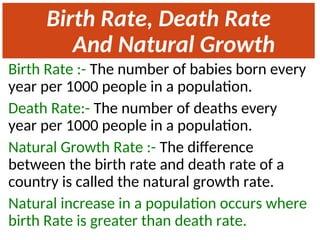
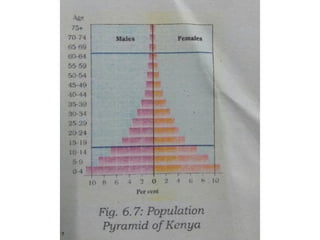
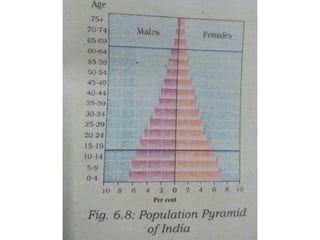
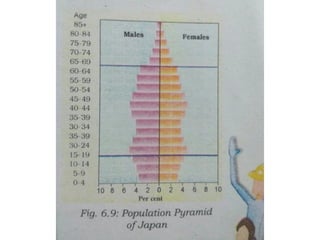
Human Resources
Class- 8th
Subject - Geography
Name of the teacher - Krati
Tomar
TGT S.ST.
What Are Human
Resources
People are a nation's greatest resource.
Nature's bounty becomes significant only
when people find it useful.It is people with
their demands and abilities that turn them into
' Resource'.Hence,human Resource is
the ultimate resource. Healthy, educated and
motivated people develop resource as per
their requirements.
• Distribution Of Population
• The way in which people are spread across the
earth surface is known as the pattern of
population distribution.
• More than 90% of the world's population lives
in about 30% of the land surface.
• Some areas are very crowded and some
are sparely populated.
• the crowded areas are south and south east
Asia, Europe and North Eastern America.
• Distribution Of Population
• Very few people live in high latitude areas,
tropical desert, high mountains and areas of
equatorial forest.
• Many more people live north of the equator
than south of the equator.
• Almost three -quarters of the world's
people live in two continents Asia and
Africa.
• 60% of the world's people stay in just 10
countries.
J ---r
-------...-
J
r
I
t •
I II
I
I
R
u
I
I
•
I
I
I
I
I
i
l I
l
.
l
I
Fed.-
igeria .
adesl1
tan
.
I
j"
'
I
I

I
J
o
I
l
Density Of
Population
• Population density is the number of
people living in a unit area of the earth's
surface.
• It is normally expressed as per square km.
• the average density of the population in
the whole world is 51 person per square
kilometre.
• Average density of population in India is
382 persons per square kilometre.
Factors Affecting
Distribution
of
Population
1 Georaphical factor :-
Topography, climate , soil , water, Minerals are
geographical factors that affect the
distribution of population.
2 Social , Cultural and Economic Factors:-
social , cultural and economic factors also
affect the distribution of population.
Topography
• People always prefer to live on plains
rather than mountains and plateaus
because these areas are suitable for
farming , manufacturing and service
activities.
• The Ganga plains are the most densely
populated area of the world while
mountains like Andes, Alps and Himalaya
are sparsely populated.
Climate and
Soil
• Climate:- People usually avoid extreme
climates that are very hot or very cold like
Sahara desert , polar regions of Russia,
Canada and Antarctica.
• Soil:- Fertile soils provide suitable land for
agriculture. Fertile plain such as Ganga
and Brahmaputra in India,Hwang-He,
Chang Jiang in China and the Nile in Egypt
are densely populated.
Water and
Minerals
• Water :- People prefer to live in the areas
where fresh water is easily available. The river
valleys of the world are densely populated
while desert have spare population.
• Minerals:- Areas with mineral deposits are
more populated. Diamond mines of South
Africa and discovery of oil in the Middle East
lead to settling of people in these areas.
Social And cultural
Factors
• Social factors:- Areas of better housing ,
education and health facilities are more
densely populated for example Pune.
• Cultural Factors:- Places with religion
or cultural significance attract people.
Varanasi , Jerusalem and Vatican city
are some examples.
Economic factors
Industrial areas provide employment
opportunities. Large number of people are
attracted to these areas . Osaka in Japan and
Mumbai in India are two densely populated
areas.
People live here for better opportunities.
History of world's
Population
• For an extremely long period of Human
history, until the 1800s, the world's population
grew steadily but slowly.
•Large numbers of babies were born , but
they died early too.
•This was as there were no proper health
facilities.
•Farmers were not able to produce enough to
meet the food requirements of all the people.
History of world's Population
• In1804, the world's population reached
one billion.
• A hundred and fifty five years later, in
1959, the world's population reached in 3
billion.This is often called population
explosion.
• In 1999, 40 years later, the population
doubled to 6 billion.
History of world's Population
• The main reason for this growth was that
with better food supplies and medicine,
deaths were reducing , while the number
of births still remained fairly high.
• Births and deaths are the natural causes of
population Change.
• The population increase in the world is
mainly due to rapid increase in natural
growth rate.
Birth Rate, Death Rate
And Natural Growth
Rate
Birth Rate :- The number of babies born every
year per 1000 people in a population.
Death Rate:- The number of deaths every
year per 1000 people in a population.
Natural Growth Rate :- The difference
between the birth rate and death rate of a
country is called the natural growth rate.
Natural increase in a population occurs where
birth Rate is greater than death rate.
Birth Rate, Death Rate
And Natural Growth
Rate
• When birth Rate is more than death rate
this situation is called Population increase.
• When birth rate and death rate are same
this situation is called Population Steady.
• When death rate is more than birth rate
this situation is called Population decrease.
Patterns of Population
Change
• Rates of population growth vary across
the world .
• Although , the world's total population is
rising rapidly, not all countries are
experiencing this growth rates.
• Some countries like Kenya have high
population growth rates.
• In the other countries like United Kingdom
population growth rate is slow.
Population
Change
• Population Change refers to change in the
number of people during a specific time.
• The world population has not been stable.
• This is actually due to change in the number of
births and deaths.
• Births are usually measured using the Birth
rate.
• Deaths are usually measured in Death rate.
Population
Composition
• To understand the role of people as a
resource, we need to know more about
their qualities.
• People vary greatly in their age,sex,
literacy level , health condition ,
occupation and income level.
• It is essential to understand these
characteristics of the people.
• Population Composition refers to the
structure of population.
Population Composition
• The composition of population helps us to
know how many are males or females,
which age group they belong to , how
educated they are and what type of
occupation they are employed in, what their
income level and health condition are.
• An interesting way of studying population
Composition of a country is by looking
population pyramid.
Population
Pyramid
• Population Pyramid is also called an age -
sex
pyramid .
•It shows the total number of population divided
into various age groups, e.g., 5 to 9 years, 10 to
14 years.
•It shows the percentage of the total population,
subdivided in to males and females, in each of
those groups.
•The shape of population pyramid tells the story
of the people living in that particular country .
Population Pyramid
•The numbers of children (below 15 years)
are shown at the bottom and reflect the level
of births.
•The size of the top shows the number of
aged people ( above 65 years) and reflects
the number of deaths.
•It also tells us how many dependents there
are in a country. There are two groups of
dependents - young dependents and elderly
dependents.
Population Pyramid of
Kenya
•The population pyramid of a country in
which birth and death rates both are
high is broad at the base and rapidly
narrows towards the top.
•This is because although many
children are born , a large percentage
of them die in their infancy , relatively
few become adults and there are very
few old .
Population Pyramid of
India
• In the countries where death rates
( especially amongst the very young) are
decreasing , the pyramid is broad in the
younger age groups, because more infant
survive to adulthood.
• Such population contain a relatively large
number of young people and which
means a strong and expanding labour
force.
Population Pyramid of Japan
• In countries like Japan, low birth rate
make the pyramid narrow at the base.
• Decreased death rates allow numbers of
people to reach old age .
Conclusion
•Skilled, spirited and hopeful young people
endowed with a positive outlook are the
future of any nation.
•We in India are fortunate to have such a
resource .
•They must be educated and provided
skills and opportunities to become able
and productive.
Thank you

Ch 6 Human Resources 1.pptx....ppt.........

  • 2.
    Human Resources Class- 8th Subject- Geography Name of the teacher - Krati Tomar TGT S.ST.
  • 3.
    What Are Human Resources Peopleare a nation's greatest resource. Nature's bounty becomes significant only when people find it useful.It is people with their demands and abilities that turn them into ' Resource'.Hence,human Resource is the ultimate resource. Healthy, educated and motivated people develop resource as per their requirements.
  • 4.
    • Distribution OfPopulation • The way in which people are spread across the earth surface is known as the pattern of population distribution. • More than 90% of the world's population lives in about 30% of the land surface. • Some areas are very crowded and some are sparely populated. • the crowded areas are south and south east Asia, Europe and North Eastern America.
  • 5.
    • Distribution OfPopulation • Very few people live in high latitude areas, tropical desert, high mountains and areas of equatorial forest. • Many more people live north of the equator than south of the equator. • Almost three -quarters of the world's people live in two continents Asia and Africa. • 60% of the world's people stay in just 10 countries.
  • 6.
    J ---r -------...- J r I t • III I I R u I I • I I I I I i l I l . l I Fed.- igeria . adesl1 tan . I j" ' I I I J o I l
  • 7.
    Density Of Population • Populationdensity is the number of people living in a unit area of the earth's surface. • It is normally expressed as per square km. • the average density of the population in the whole world is 51 person per square kilometre. • Average density of population in India is 382 persons per square kilometre.
  • 8.
    Factors Affecting Distribution of Population 1 Georaphicalfactor :- Topography, climate , soil , water, Minerals are geographical factors that affect the distribution of population. 2 Social , Cultural and Economic Factors:- social , cultural and economic factors also affect the distribution of population.
  • 9.
    Topography • People alwaysprefer to live on plains rather than mountains and plateaus because these areas are suitable for farming , manufacturing and service activities. • The Ganga plains are the most densely populated area of the world while mountains like Andes, Alps and Himalaya are sparsely populated.
  • 10.
    Climate and Soil • Climate:-People usually avoid extreme climates that are very hot or very cold like Sahara desert , polar regions of Russia, Canada and Antarctica. • Soil:- Fertile soils provide suitable land for agriculture. Fertile plain such as Ganga and Brahmaputra in India,Hwang-He, Chang Jiang in China and the Nile in Egypt are densely populated.
  • 11.
    Water and Minerals • Water:- People prefer to live in the areas where fresh water is easily available. The river valleys of the world are densely populated while desert have spare population. • Minerals:- Areas with mineral deposits are more populated. Diamond mines of South Africa and discovery of oil in the Middle East lead to settling of people in these areas.
  • 12.
    Social And cultural Factors •Social factors:- Areas of better housing , education and health facilities are more densely populated for example Pune. • Cultural Factors:- Places with religion or cultural significance attract people. Varanasi , Jerusalem and Vatican city are some examples.
  • 13.
    Economic factors Industrial areasprovide employment opportunities. Large number of people are attracted to these areas . Osaka in Japan and Mumbai in India are two densely populated areas. People live here for better opportunities.
  • 14.
    History of world's Population •For an extremely long period of Human history, until the 1800s, the world's population grew steadily but slowly. •Large numbers of babies were born , but they died early too. •This was as there were no proper health facilities. •Farmers were not able to produce enough to meet the food requirements of all the people.
  • 15.
    History of world'sPopulation • In1804, the world's population reached one billion. • A hundred and fifty five years later, in 1959, the world's population reached in 3 billion.This is often called population explosion. • In 1999, 40 years later, the population doubled to 6 billion.
  • 16.
    History of world'sPopulation • The main reason for this growth was that with better food supplies and medicine, deaths were reducing , while the number of births still remained fairly high. • Births and deaths are the natural causes of population Change. • The population increase in the world is mainly due to rapid increase in natural growth rate.
  • 17.
    Birth Rate, DeathRate And Natural Growth Rate Birth Rate :- The number of babies born every year per 1000 people in a population. Death Rate:- The number of deaths every year per 1000 people in a population. Natural Growth Rate :- The difference between the birth rate and death rate of a country is called the natural growth rate. Natural increase in a population occurs where birth Rate is greater than death rate.
  • 18.
    Birth Rate, DeathRate And Natural Growth Rate • When birth Rate is more than death rate this situation is called Population increase. • When birth rate and death rate are same this situation is called Population Steady. • When death rate is more than birth rate this situation is called Population decrease.
  • 19.
    Patterns of Population Change •Rates of population growth vary across the world . • Although , the world's total population is rising rapidly, not all countries are experiencing this growth rates. • Some countries like Kenya have high population growth rates. • In the other countries like United Kingdom population growth rate is slow.
  • 20.
    Population Change • Population Changerefers to change in the number of people during a specific time. • The world population has not been stable. • This is actually due to change in the number of births and deaths. • Births are usually measured using the Birth rate. • Deaths are usually measured in Death rate.
  • 22.
    Population Composition • To understandthe role of people as a resource, we need to know more about their qualities. • People vary greatly in their age,sex, literacy level , health condition , occupation and income level. • It is essential to understand these characteristics of the people. • Population Composition refers to the structure of population.
  • 23.
    Population Composition • Thecomposition of population helps us to know how many are males or females, which age group they belong to , how educated they are and what type of occupation they are employed in, what their income level and health condition are. • An interesting way of studying population Composition of a country is by looking population pyramid.
  • 24.
    Population Pyramid • Population Pyramidis also called an age - sex pyramid . •It shows the total number of population divided into various age groups, e.g., 5 to 9 years, 10 to 14 years. •It shows the percentage of the total population, subdivided in to males and females, in each of those groups. •The shape of population pyramid tells the story of the people living in that particular country .
  • 25.
    Population Pyramid •The numbersof children (below 15 years) are shown at the bottom and reflect the level of births. •The size of the top shows the number of aged people ( above 65 years) and reflects the number of deaths. •It also tells us how many dependents there are in a country. There are two groups of dependents - young dependents and elderly dependents.
  • 26.
    Population Pyramid of Kenya •Thepopulation pyramid of a country in which birth and death rates both are high is broad at the base and rapidly narrows towards the top. •This is because although many children are born , a large percentage of them die in their infancy , relatively few become adults and there are very few old .
  • 28.
    Population Pyramid of India •In the countries where death rates ( especially amongst the very young) are decreasing , the pyramid is broad in the younger age groups, because more infant survive to adulthood. • Such population contain a relatively large number of young people and which means a strong and expanding labour force.
  • 30.
    Population Pyramid ofJapan • In countries like Japan, low birth rate make the pyramid narrow at the base. • Decreased death rates allow numbers of people to reach old age .
  • 32.
    Conclusion •Skilled, spirited andhopeful young people endowed with a positive outlook are the future of any nation. •We in India are fortunate to have such a resource . •They must be educated and provided skills and opportunities to become able and productive.
  • 33.