Download to read offline
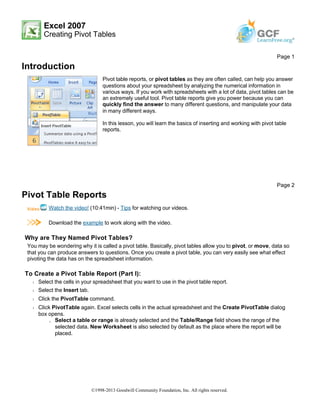


Pivot table reports allow users to analyze and manipulate spreadsheet data in different ways to answer questions. They can be used to summarize large amounts of data. To create a pivot table, users select cells of data and insert a pivot table, which displays fields for the different data categories. Users can then drag fields into different areas to produce summaries, like showing total sales by salesperson. Filters can also be added to focus on specific regions or categories. The pivot table can then be pivoted or manipulated further by dragging fields to different areas. A pivot chart can also be created to visualize the pivot table data.