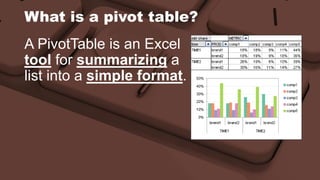
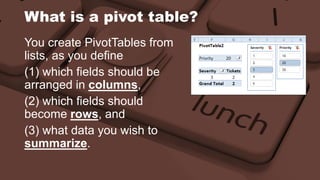
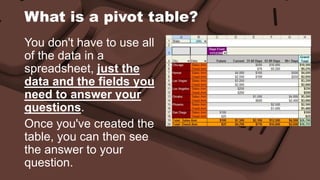
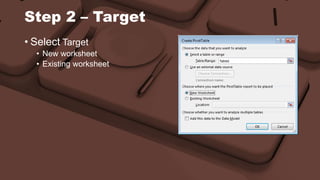
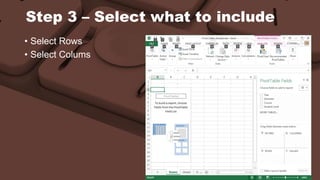
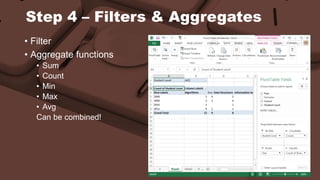
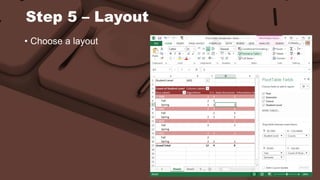
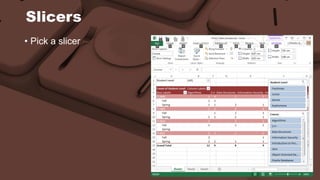
Windows 
Handy shortcuts and file handling
Excel 
Pivot tables
What is a pivot table? 
A PivotTable is an Excel 
tool for summarizing a 
list into a simple format.
What is a pivot table? 
You create PivotTables from 
lists, as you define 
(1) which fields should be 
arranged in columns, 
(2) which fields should 
become rows, and 
(3) what data you wish to 
summarize.
What is a pivot table? 
You don't have to use all 
of the data in a 
spreadsheet, just the 
data and the fields you 
need to answer your 
questions. 
Once you've created the 
table, you can then see 
the answer to your 
question.
Aggregate functions 
• Sum 
• Count 
• Average 
• Min 
• Max 
• StdDev 
• …
Step 1 – Source 
• Start by selecting your 
source range 
• Tip: use a table/range. 
• Insert -> Pivot Table
Step 2 – Target 
• Select Target 
• New worksheet 
• Existing worksheet
Step 3 – Select what to include 
• Select Rows 
• Select Colums
Step 4 – Filters & Aggregates 
• Filter 
• Aggregate functions 
• Sum 
• Count 
• Min 
• Max 
• Avg 
Can be combined!
Step 5 – Layout 
• Choose a layout
Slicers 
• Pick a slicer
Delve 
• Get more detail 
• Double click a value
Misc 
• Refresh data 
• Show/hide totals 
• Add extra lines 
• Change field layout 
• Recommended tables
Q&A 
Future questions? 
• ICT intranet 
 Training 
 ICT Service Lunch ‘n Learn 
• Helpdesk 
http://ict.coleurope.eu 
helpdesk.be@coleurope.eu 
Tel 050 47 70 00

Lunch 'n Learn - Excel: Pivot tables

  • 1.
    Windows Handy shortcutsand file handling
  • 2.
  • 3.
    What is apivot table? A PivotTable is an Excel tool for summarizing a list into a simple format.
  • 4.
    What is apivot table? You create PivotTables from lists, as you define (1) which fields should be arranged in columns, (2) which fields should become rows, and (3) what data you wish to summarize.
  • 5.
    What is apivot table? You don't have to use all of the data in a spreadsheet, just the data and the fields you need to answer your questions. Once you've created the table, you can then see the answer to your question.
  • 6.
    Aggregate functions •Sum • Count • Average • Min • Max • StdDev • …
  • 7.
    Step 1 –Source • Start by selecting your source range • Tip: use a table/range. • Insert -> Pivot Table
  • 8.
    Step 2 –Target • Select Target • New worksheet • Existing worksheet
  • 9.
    Step 3 –Select what to include • Select Rows • Select Colums
  • 10.
    Step 4 –Filters & Aggregates • Filter • Aggregate functions • Sum • Count • Min • Max • Avg Can be combined!
  • 11.
    Step 5 –Layout • Choose a layout
  • 12.
  • 13.
    Delve • Getmore detail • Double click a value
  • 14.
    Misc • Refreshdata • Show/hide totals • Add extra lines • Change field layout • Recommended tables
  • 15.
    Q&A Future questions? • ICT intranet  Training  ICT Service Lunch ‘n Learn • Helpdesk http://ict.coleurope.eu helpdesk.be@coleurope.eu Tel 050 47 70 00