Key
Benefits
1. POWERFUL
-Uncover insightsand answer key questions about your data
2. BEAUTIFUL
-Apply custom styles and conditional formatting rules to bring your
Pivots to life
3. FAST
-Create custom views, filters, and calculated fields on the fly
4. ACCURATE
-Automate calculations to minimize human error
5. FLEXIBLE
-Manipulate table layouts and create dynamic views in seconds
3.
Data Analysis
Reporting
• Representation of information is more
organized.
• It provides a clear data analysis.
• It can link data to extended sources.
• Data can combined from multiple
sheets.
• It can compresses large amount of data
to a summary.
• Quick access to data report.
4.
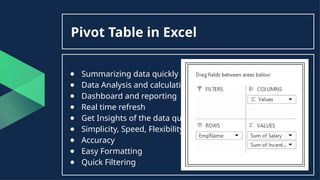
Pivot Table inExcel
● Summarizing data quickly
● Data Analysis and calculations
● Dashboard and reporting
● Real time refresh
● Get Insights of the data quickly
● Simplicity, Speed, Flexibility
● Accuracy
● Easy Formatting
● Quick Filtering
5.
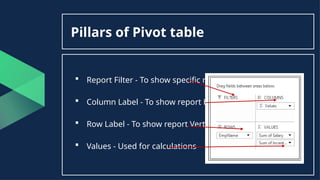
Pillars of Pivottable
Report Filter - To show specific report
Column Label - To show report Horizontally
Row Label - To show report Vertically
Values - Used for calculations
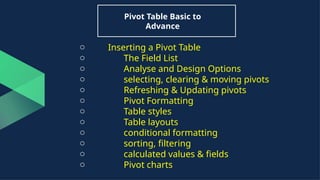
6.
Pivot Table Basicto
Advance
o Inserting a Pivot Table
o The Field List
o Analyse and Design Options
o selecting, clearing & moving pivots
o Refreshing & Updating pivots
o Pivot Formatting
o Table styles
o Table layouts
o conditional formatting
o sorting, filtering
o calculated values & fields
o Pivot charts
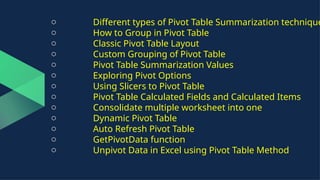
7.
o Different typesof Pivot Table Summarization technique
o How to Group in Pivot Table
o Classic Pivot Table Layout
o Custom Grouping of Pivot Table
o Pivot Table Summarization Values
o Exploring Pivot Options
o Using Slicers to Pivot Table
o Pivot Table Calculated Fields and Calculated Items
o Consolidate multiple worksheet into one
o Dynamic Pivot Table
o Auto Refresh Pivot Table
o GetPivotData function
o Unpivot Data in Excel using Pivot Table Method
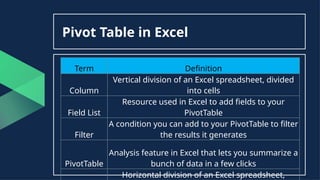
Pivot Table inExcel
Term Definition
Column
Vertical division of an Excel spreadsheet, divided
into cells
Field List
Resource used in Excel to add fields to your
PivotTable
Filter
A condition you can add to your PivotTable to filter
the results it generates
PivotTable
Analysis feature in Excel that lets you summarize a
bunch of data in a few clicks
Horizontal division of an Excel spreadsheet,
10.
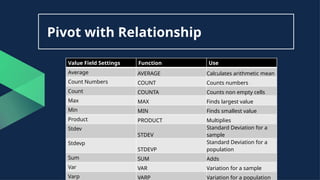
Pivot with Relationship
ValueField Settings Function Use
Average AVERAGE Calculates arithmetic mean
Count Numbers COUNT Counts numbers
Count COUNTA Counts non empty cells
Max MAX Finds largest value
Min MIN Finds smallest value
Product PRODUCT Multiplies
Stdev
STDEV
Standard Deviation for a
sample
Stdevp
STDEVP
Standard Deviation for a
population
Sum SUM Adds
Var VAR Variation for a sample
Varp VARP Variation for a population
11.
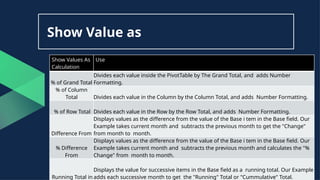
Show Value as
ShowValues As
Calculation
Use
% of Grand Total
Divides each value inside the PivotTable by The Grand Total, and adds Number
Formatting.
% of Column
Total Divides each value in the Column by the Column Total, and adds Number Formatting.
% of Row Total Divides each value in the Row by the Row Total, and adds Number Formatting.
Difference From
Displays values as the difference from the value of the Base i tem in the Base field. Our
Example takes current month and subtracts the previous month to get the "Change"
from month to month.
% Difference
From
Displays values as the difference from the value of the Base i tem in the Base field. Our
Example takes current month and subtracts the previous month and calculates the "%
Change" from month to month.
Running Total in
Displays the value for successive items in the Base field as a running total. Our Example
adds each successive month to get the "Running" Total or "Cummulative" Total.