Downloaded 20 times


![( )
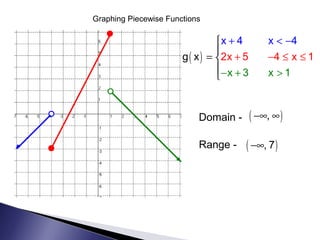
3 7 x 4
1
x 2 4 x 0
2
1
x 4
x
0 x 5
5 x 7
g
−
− −
− <
− − <
=
<
< ≤ −
+ ≤ ≤
≤
Domain - (-7, 7]
Range - (-4, -2), [-1, 4]](https://image.slidesharecdn.com/piecewisefunctionsupdated2016-190813002906/85/Piecewise-functions-updated_2016-11-320.jpg)
![( )
1
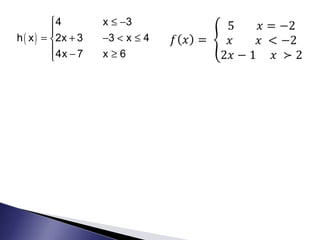
x 6 x 3
3
x 1 3 x 0h x
x 4 0 x 3
x 3 3 x 7
− − ≤ ≤ −
+ − < ≤=
+ < <
− + ≤ ≤
Domain - [-6, 7]
Range - [-4, 2], (4, 7)](https://image.slidesharecdn.com/piecewisefunctionsupdated2016-190813002906/85/Piecewise-functions-updated_2016-12-320.jpg)
![Piecewise Function – Domain and Range
Domain -
Range -
Domain - (-6, 7)
Range - [-1, 5 )
[-7, 7]
(-4.5,-1], [0, 4)](https://image.slidesharecdn.com/piecewisefunctionsupdated2016-190813002906/85/Piecewise-functions-updated_2016-14-320.jpg)
![Domain -
Range -
Domain -
Range -
(-7, -1), (-1, 7]
[-1, 5), [6, 6]
(-7, 4), [5, 7)
[-7, -5), (-2, 7)](https://image.slidesharecdn.com/piecewisefunctionsupdated2016-190813002906/85/Piecewise-functions-updated_2016-15-320.jpg)
![Domain -
Range -
Domain -
Range -
( ),−∞ ∞
( ], 4−∞
[-1, 5]
[-5, 3]](https://image.slidesharecdn.com/piecewisefunctionsupdated2016-190813002906/85/Piecewise-functions-updated_2016-16-320.jpg)

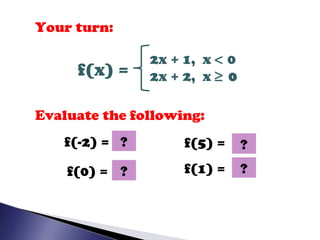
A piecewise function is defined by two or more separate functions over different parts of the domain. It can be evaluated by substituting values into the appropriate function based on the domain, and graphed by separately graphing each function over its domain and connecting the pieces. The document provides examples of evaluating and graphing piecewise functions, determining domains and ranges, and practicing evaluating additional functions.