Jimma university collageof
public health and medical science
Research presentation
On
Epidemiological study designs
by G-3studentes
2.
GROUP MEMBERS
Name IDNO TaCK
1. Derbie Alemu RM0532/09 Medical microbiology
2.Mesele Mekuria RM0393/09 Reproductive health
3. Mohamed Reshad epidemiology
4. Lire erdolo
5. Gemechu Gude
nutrition
2
3.
Learning Objectives:
At theend of this session, you should be able to:
– Describe the basic concepts of different types
epidemiological study designs
– Describe how to carry out of different types
epidemiological study designs
– Describe the limitations and strength of different types
of epidemiological study designs
3
4.
Epidemiological study designs
4
•Study design: A specific plan for conducting an empirical
investigation to assess a conceptual hypothesis about the
relationship between one or more exposures and a health
outcome.
• The purpose of the study design is to transform the conceptual
hypothesis into an operational hypothesis that can be empirically
tested.
• Since all study designs are potentially flawed, it is therefore
important to understand the specific strengths and limitations of
each design.
5.
5
Epidemiological study designs…
Epidemiology:is primarily concerned with the
distribution and determinants of disease in human
population.
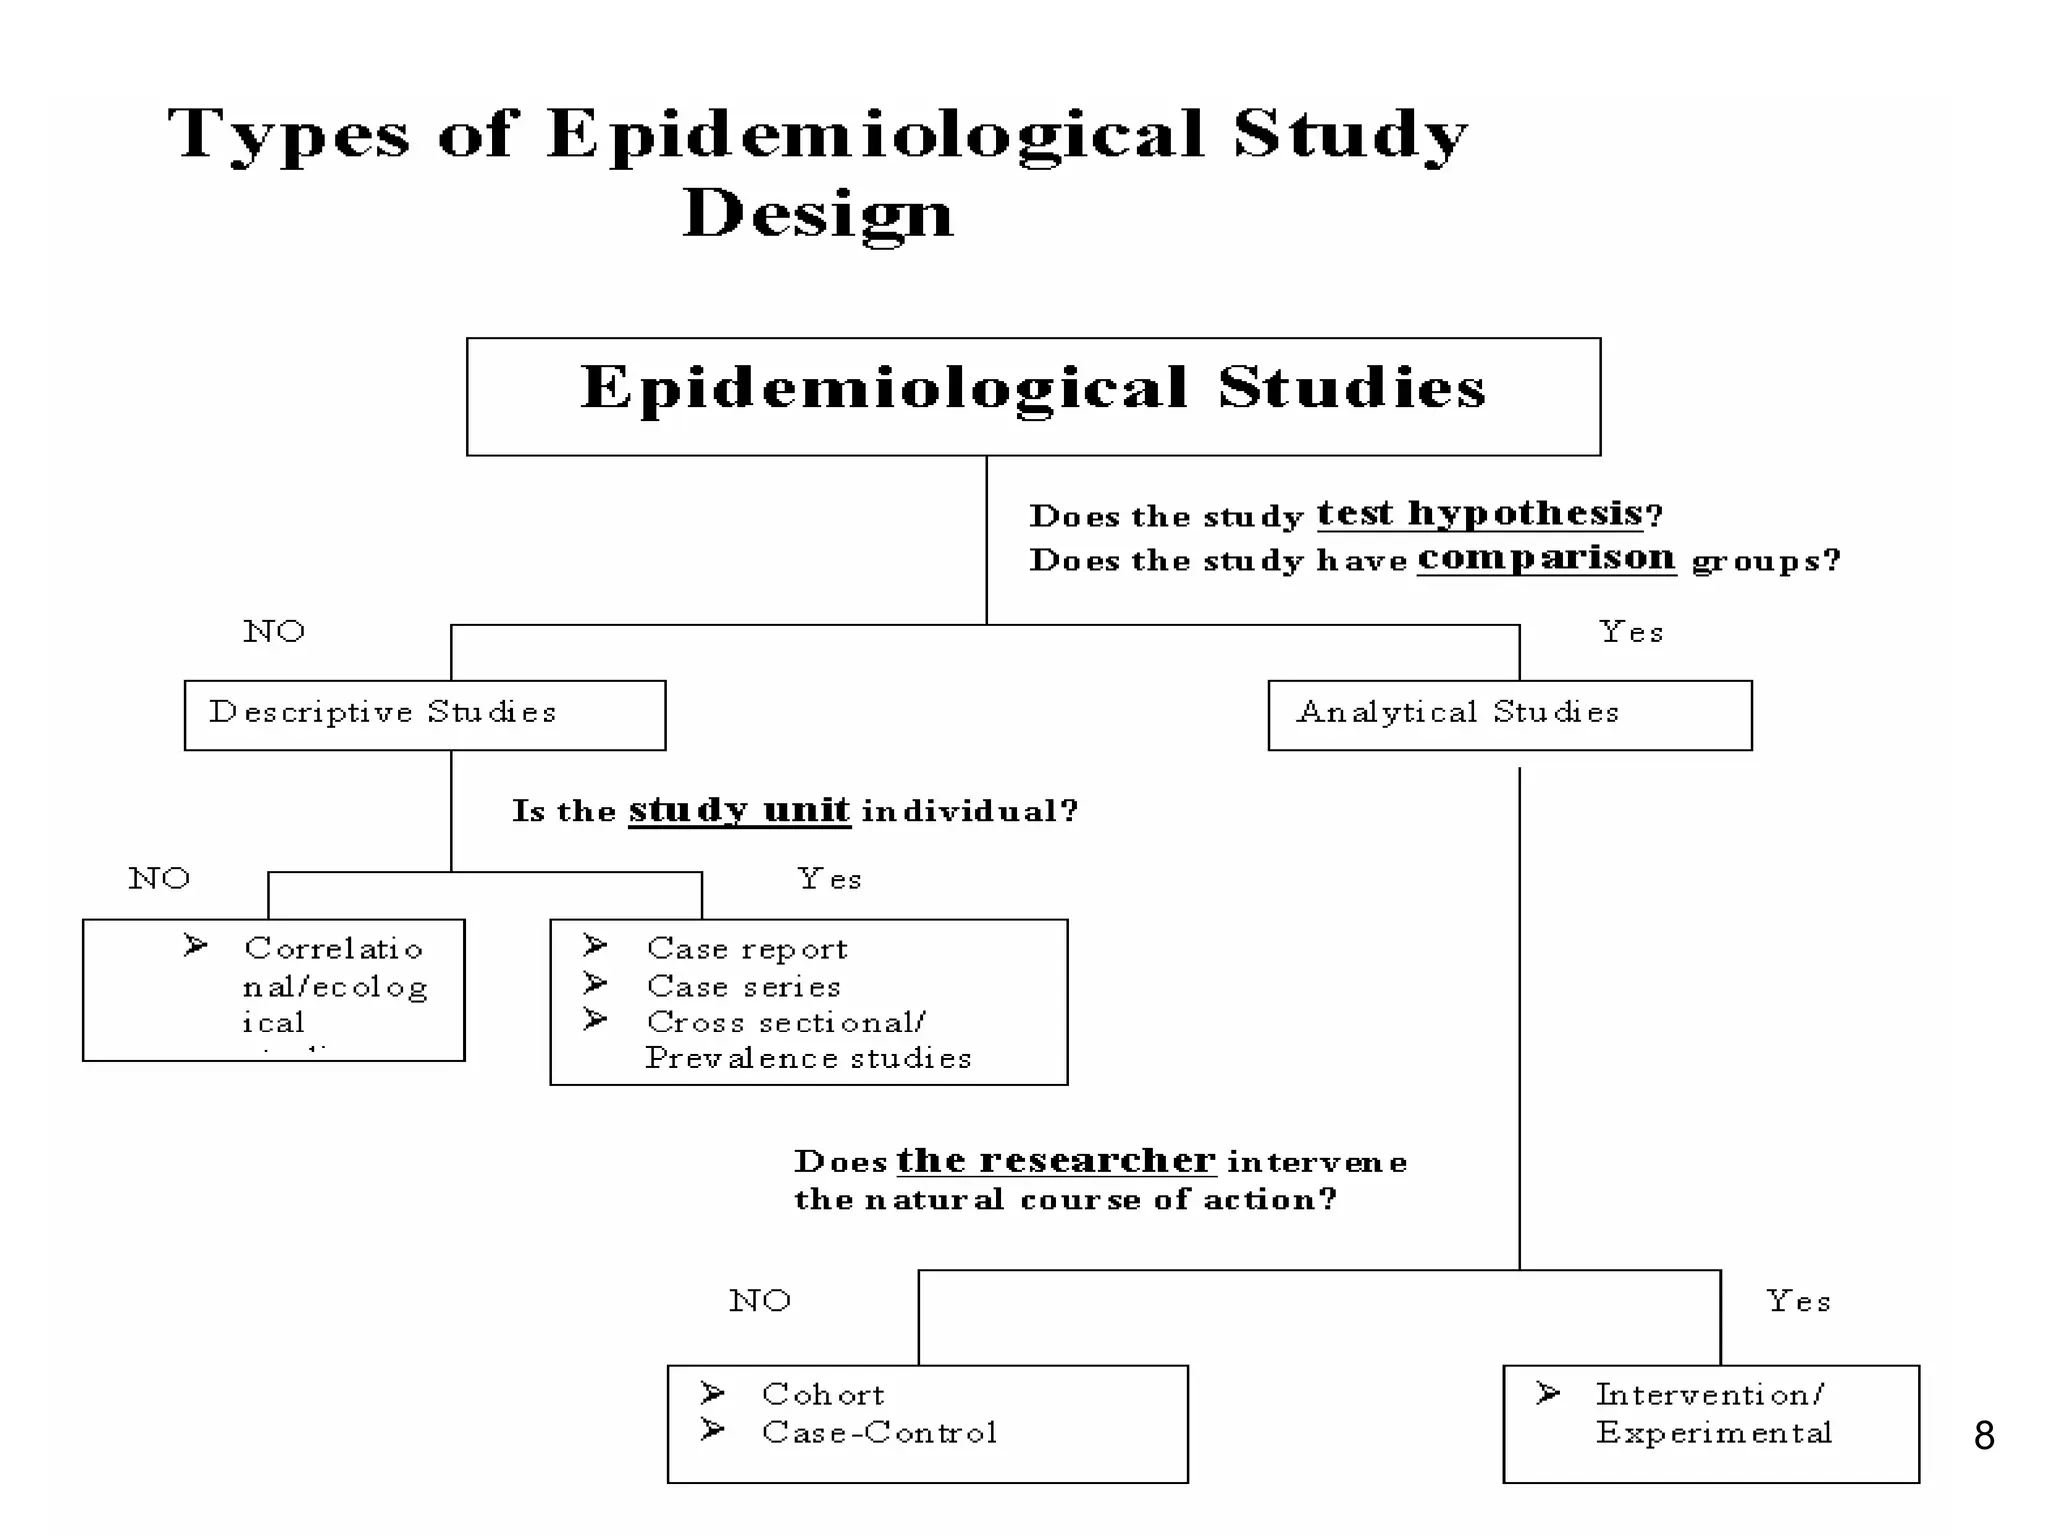
Broad categories of epidemiological studies: according to
their focus of investigation
• Descriptive studies: focus on the distribution of disease
• Analytic studies: focus in elucidating the determinants
of disease
6.
6
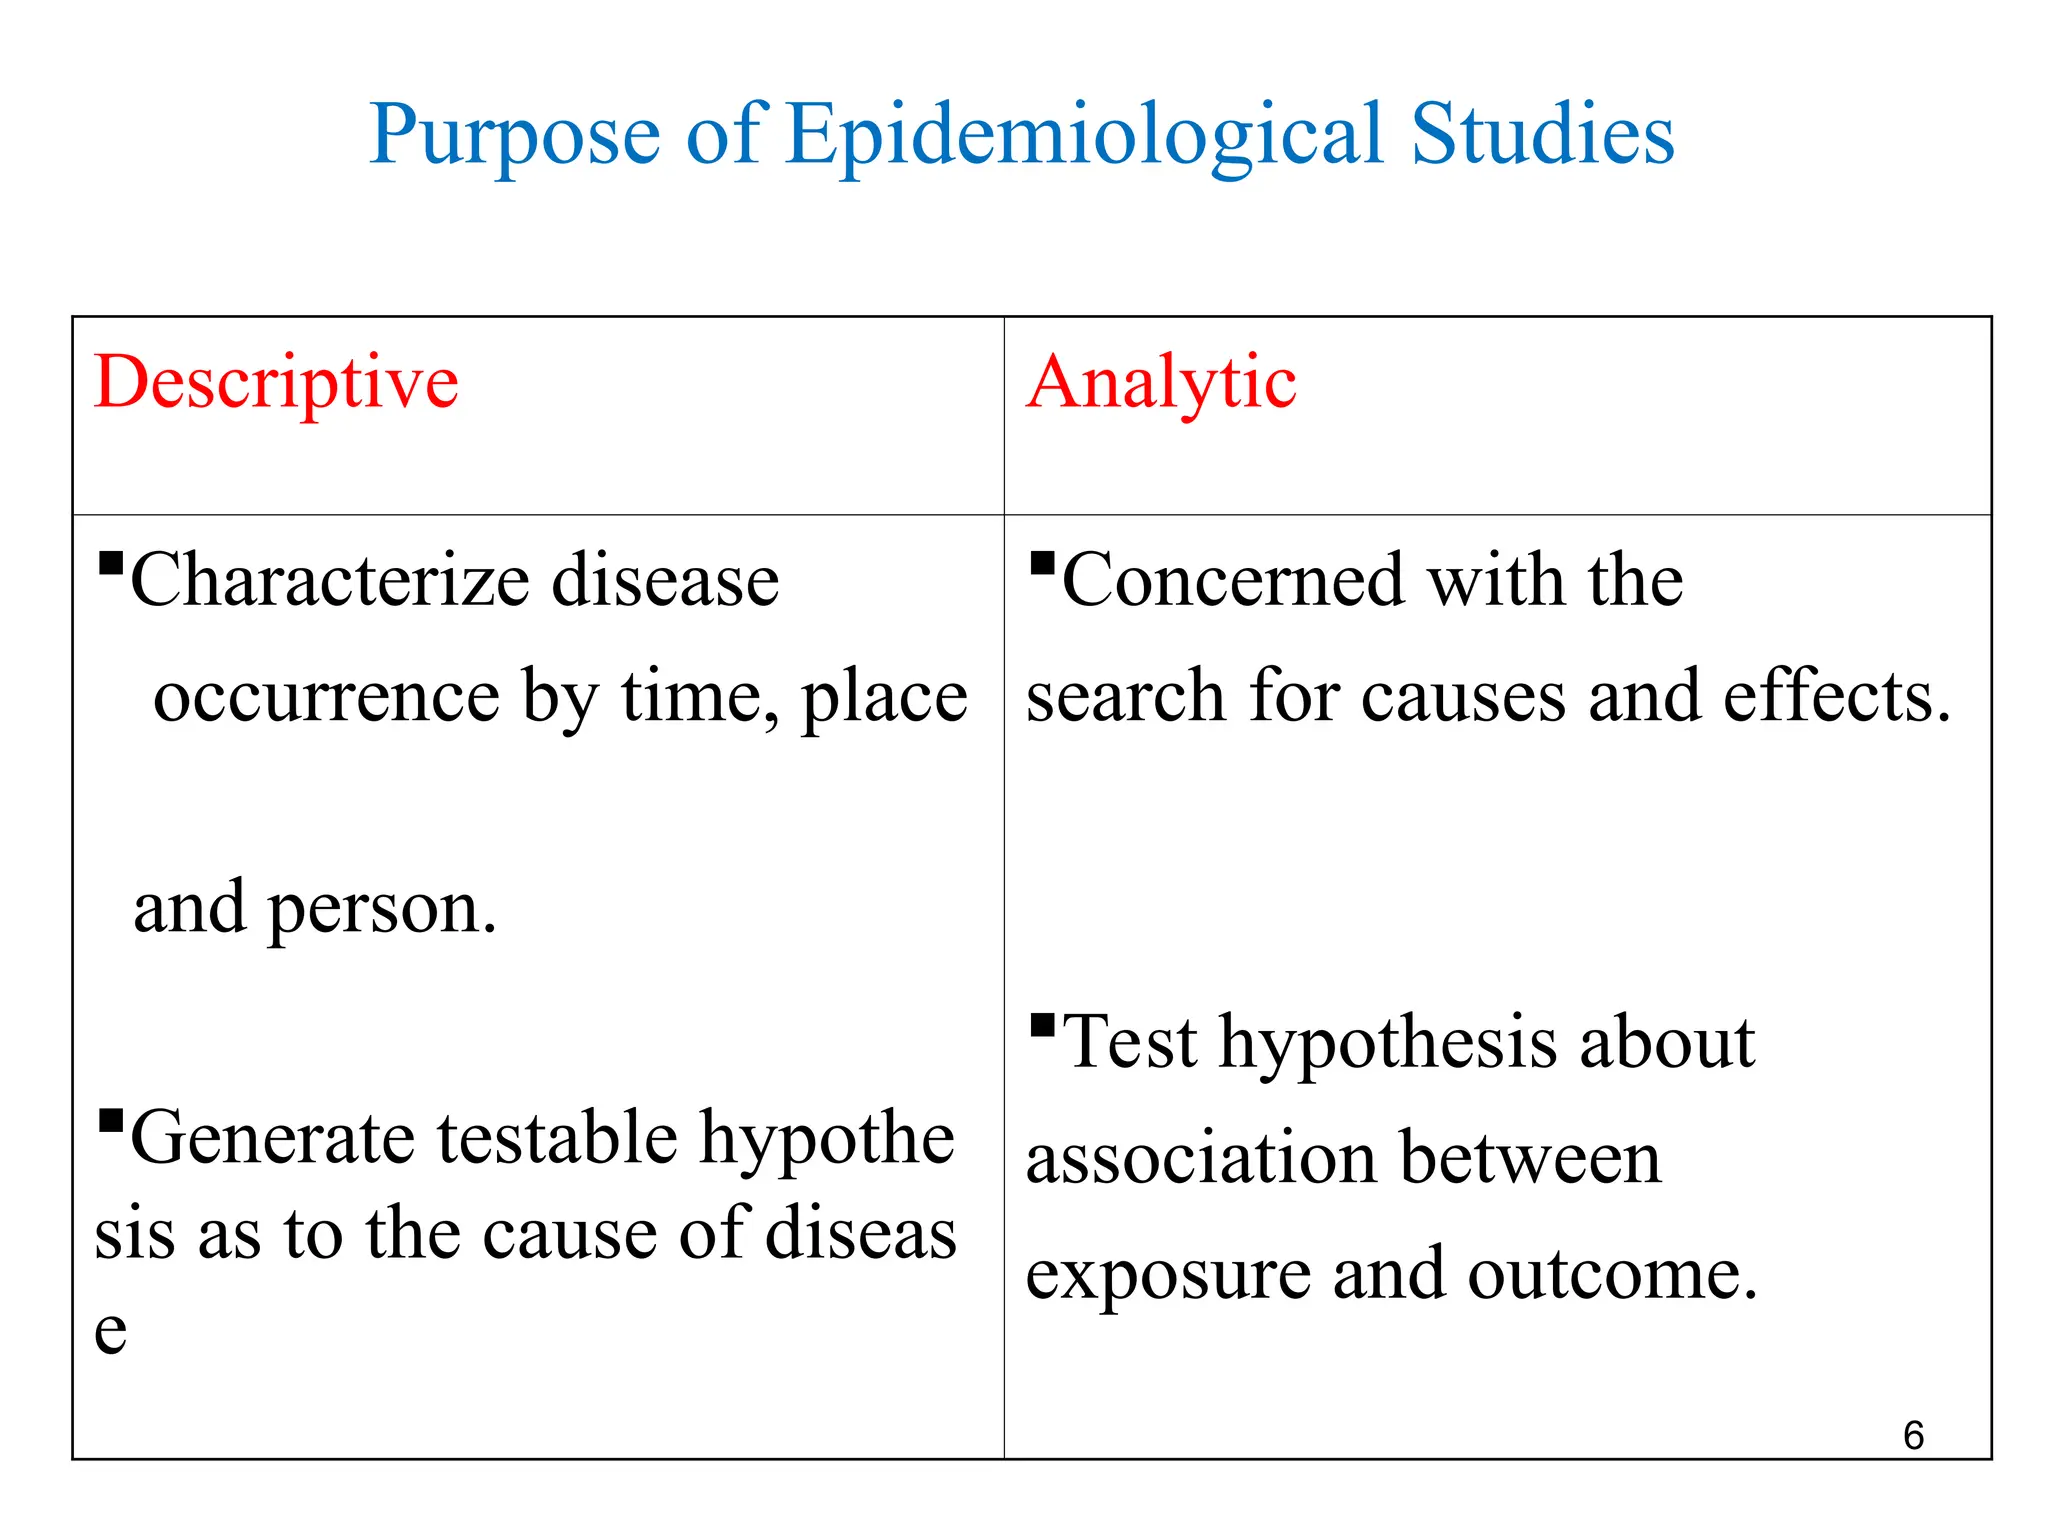
Purpose of EpidemiologicalStudies
Descriptive Analytic
Characterize disease
occurrence by time, place
and person.
Generate testable hypothe
sis as to the cause of diseas
e
Concerned with the
search for causes and effects.
Test hypothesis about
association between
exposure and outcome.
7.
7
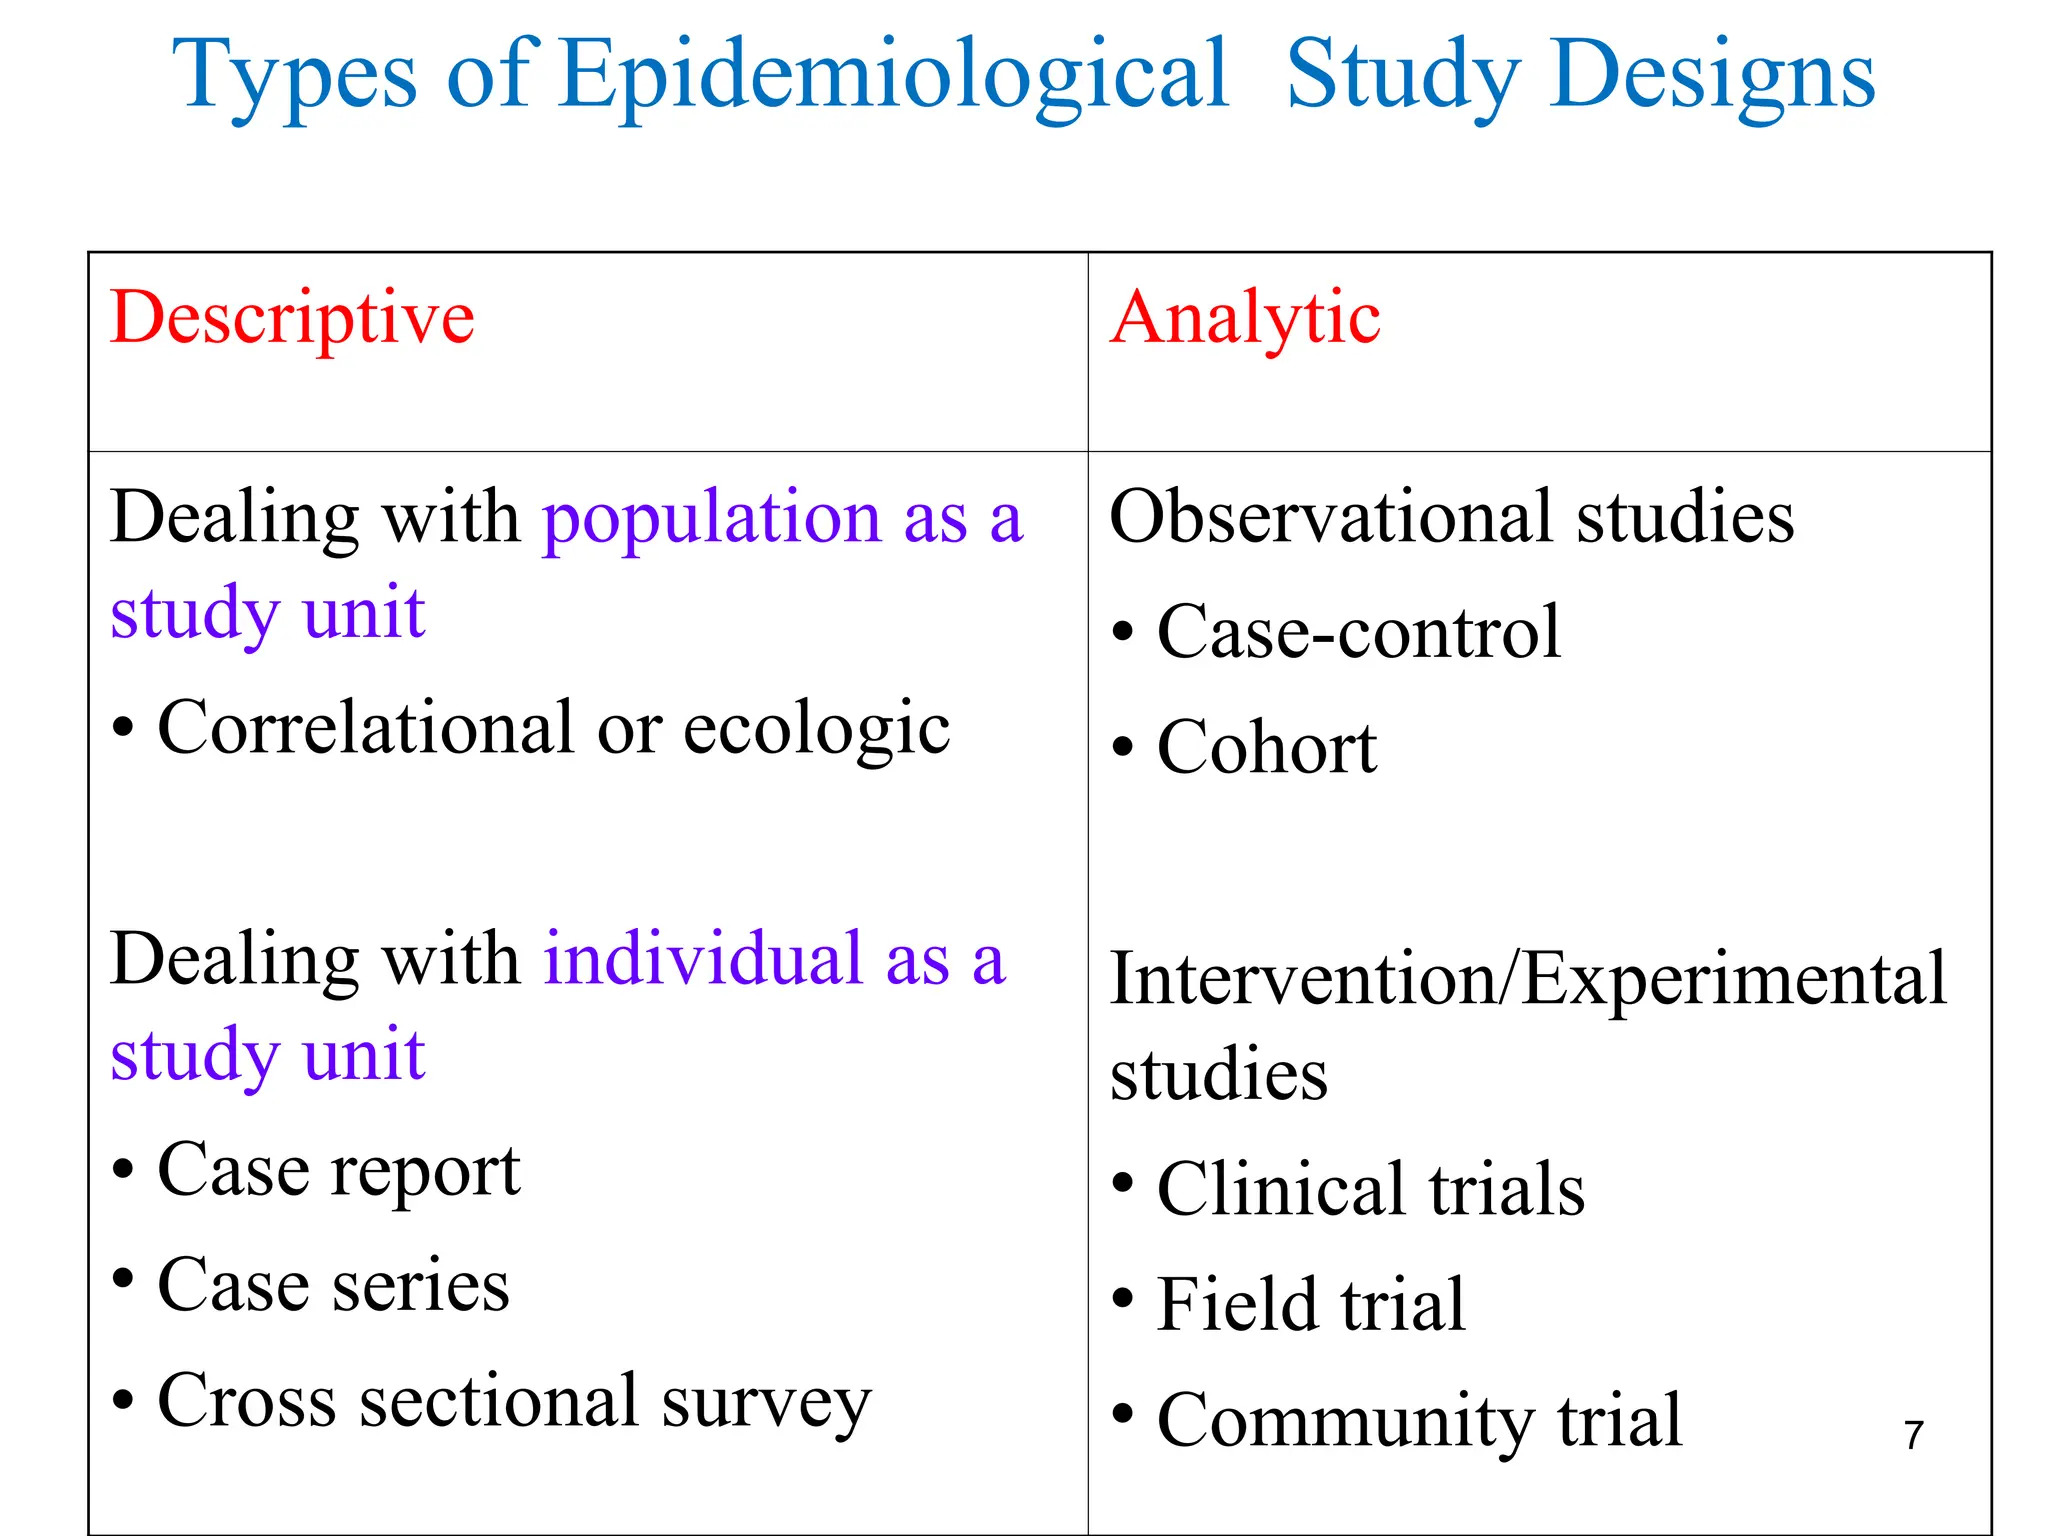
Descriptive Analytic
Dealing withpopulation as a
study unit
• Correlational or ecologic
Dealing with individual as a
study unit
• Case report
• Case series
• Cross sectional survey
Observational studies
• Case-control
• Cohort
Intervention/Experimental
studies
• Clinical trials
• Field trial
• Community trial
Types of Epidemiological Study Designs
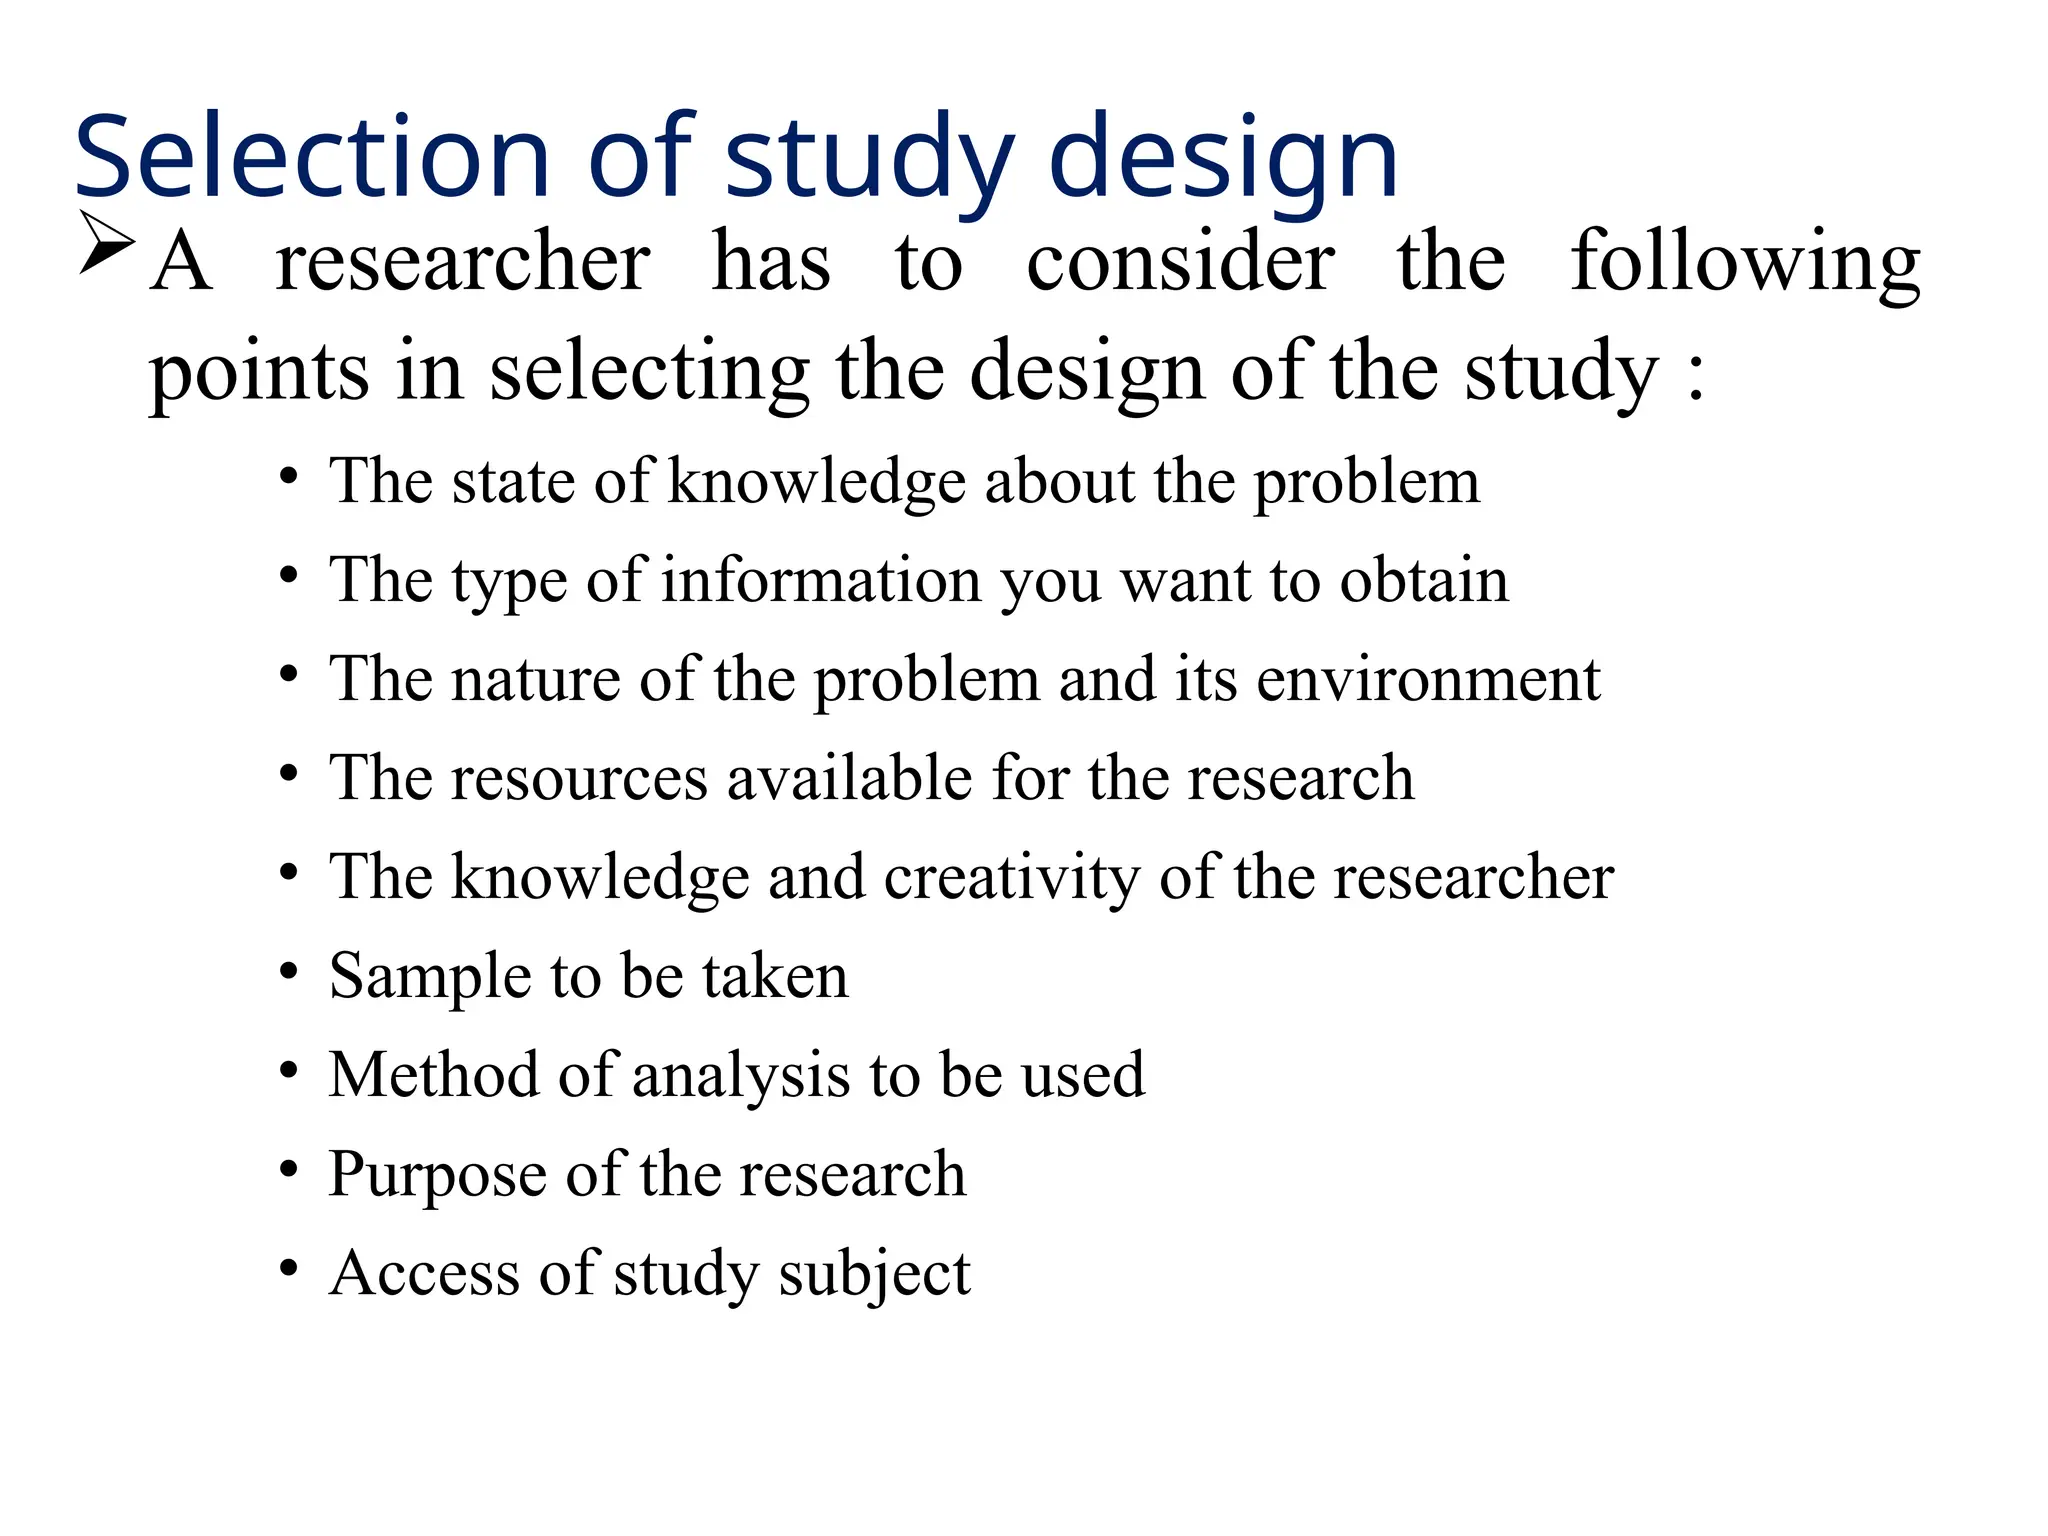
Selection of studydesign
A researcher has to consider the following
points in selecting the design of the study :
• The state of knowledge about the problem
• The type of information you want to obtain
• The nature of the problem and its environment
• The resources available for the research
• The knowledge and creativity of the researcher
• Sample to be taken
• Method of analysis to be used
• Purpose of the research
• Access of study subject
10.
10
Descriptive studies
Mainly concernedwith the distribution of diseases with
respect to time, place and person.
Provide useful information for health managers to
allocate resource and to plan effective prevention
programs
• Provides information about:
A. The magnitude of the problem
B. The populations at greatest risk of acquiring a particular dise
ase
C. The possible cause(s) of the disease.
11.
11
Descriptive studies…
Generate epidemiologicalhypothesis: an important first
step in the search for disease determinants or risk
factors.
Can use information collected routinely which are
readily available in many places. (less expensive and
less time-consuming than analytic studies)
Are the most common type of epidemiological study
designs in medical literature.
12.
12
Descriptive studies…
Types ofdescriptive studies:
– Correlational/ecologic
– Case report
– Case series
– Cross-sectional/prevalence study
13.
13
Correlational/ecologic study
•A studyin which one or more exposures or disease is
measured at the population level rather than the
individual level
•Uses data from entire population to compare disease
frequencies
- Between different groups during the same period of
time, or
- In the same population at different points in time.
14.
Correlational/ecologic study….
Doesnot provide individual data, rather
presents average exposure level in the
community.
• Cause could not be ascertained.
• Correlation coefficient (r) is the measure of
association in Correlational studies.
Example:
• Average per capita fat consumption and breast
cancer rates compared between countries.
14
Correlational/ecological studies…..
Limitation
Inabilityto link exposure with disease at individual
level
Association found with aggregate data (average values) may
not apply to individuals (Prone to ecological fallacy)
Lack of ability to control for effects of potential
confounding factors.
Measurement limitation (conditions that are difficult to
measure at individual level)
It may mask a non-linear relationship
16
17.
Case Report/case study
17
•Is a careful and detailed report of the profile of a single patient
by one or more clinicians
• Document unusual medical occurrences
• Can generate hypothesis, provide clues in identification of a new
disease or adverse effects of exposures
– (E.g. It was a single case report that formulated the hypothesis of ‘oral
contraceptive use increases venous thromboembolism’)
• It is made using
– Simple history, physical examination and Lab./ radiologic
investigation...
18.
Case Series Study
18
•Is a description of clinical/epidemiologic
characteristics of a number of patients (usually 5-
12) having similar diagnosis
• Collection/compilation of individual case reports
occurring within a fairly short period of time
• Can suggest the emergence of a new disease (e.g. PCP...
AIDS)
19.
19
Case series …..
•Information/data in making better use of the case
series study:
1. Defining the disease or health problem clearly
2. Recording the date when the disease/death occurred
(Time)
3. Recording where the person lived, worked,… (Place -
relevant to the study)
4. Recording personal characteristics ( age and sex)
5. Explore the opportunities for collecting additional data
from records or the person directly.
6. Estimating the size and the characteristics of the
population at risk
20.
20
Case Reports (Caseseries)
Strength:
• Useful for recognition of or studying signs and
symptoms new disease and creating case
definitions for epidemiological studies.
• Can help build up a picture of the natural history
of a disease.
• Can be valuable early evidence for associations
between exposures and diseases (to formulate
hypothesis)
• Useful to detect an epidemic
21.
21
Case Report andCase series study….
Limitation:
Not a true epidemiologic design
Can’t be used to test for presence of a valid statistical
association
Lack of an appropriate comparison group.
Prevalence/incidence rate can not be calculated
Detailed and complete risk factor information is difficult
to obtain for all cases from records.
Prone to atomistic fallacy (opposite of ecological
fallacy).
22.
22
Cross-Sectional Study
Measure diseaseand exposure status simultaneously
among individuals in a well-defined population at a point
in time
• Snapshot of health status of populations at a point in time
• Can have descriptive or analytic purposes
• The descriptive cross-sectional study is carried out to
study prevalence of health related events at a point in time
– Diseases, risk factors, coverage of interventions, health
service utilization, knowledge, attitude and practice
23.
Cross-Sectional Study…
• Theanalytic cross-sectional study is carried out to assess
association between exposure and outcome
– Exposure and disease status are assessed
simultaneously among individuals at the same point in
time
– Measures of association is made using odds ratio
23
24.
24
Cross-Sectional Studies….
Steps inthe conduct of cross-sectional studies:
1. Define a population of interest (reference
population)
2. Recruiting a representative sample (adequate
size, random selection)
3. Measure the variables of interest (disease
&or exposure) at the same point in time
4. Analyze the data
25.
25
Cross-Sectional Studies….
Characteristics ofcross-sectional studies:
• Assess both exposure and outcome simultaneously
• Are based on point prevalence rates with only few
exceptions
• Are frequently made on total population samples
• Subdivision of the total population takes place after data
collection unlike in cohort & case- control studies
• Are cheaper, easier & useful for studies of exposures
that are unalterable over time or relatively permanent
features for individuals
– E.g.-blood group, ethnicity, sex, etc.
26.
26
Cross-Sectional Study….
Advantages
• Lessexpensive: a one-step, one-time collection of data
• It starts with reference population, thus making possible
generalization
• helps to determine disease burden or prevalence (not
incidence)
• No loss to follow up
• multiple factors and outcomes at same point time can be
studied
• Helps to generate hypotheses
27.
Analytic studies
27
• Focuseson identifying determinants of a disease by testing the
hypothesis formulated from descriptive studies
• Have the ultimate goal of judging whether a particular exposure
causes or prevents disease (unwanted health related event)
• Analytic studies are broadly classified into two
I. Observational
II. Interventional studies
• Both types use "control group", the use of control group
(comparison group) is the main distinguishing feature of analytic
studies.
In Observational study, information is obtained by observation of
events.
• No intervention is done, no deliberate interference with natural
course of disease. (cross-sectional, case control, cohort)
28.
Analytic studies…
28
In Interventionalstudy, the researcher does something
about the exposure and observes the changes in the
outcome.
• Investigator has control over who gets exposure and who
don't.
• The key is that how the investigator assign study subjects
into either group, whether it is done randomly or not.
• Always prospective
29.
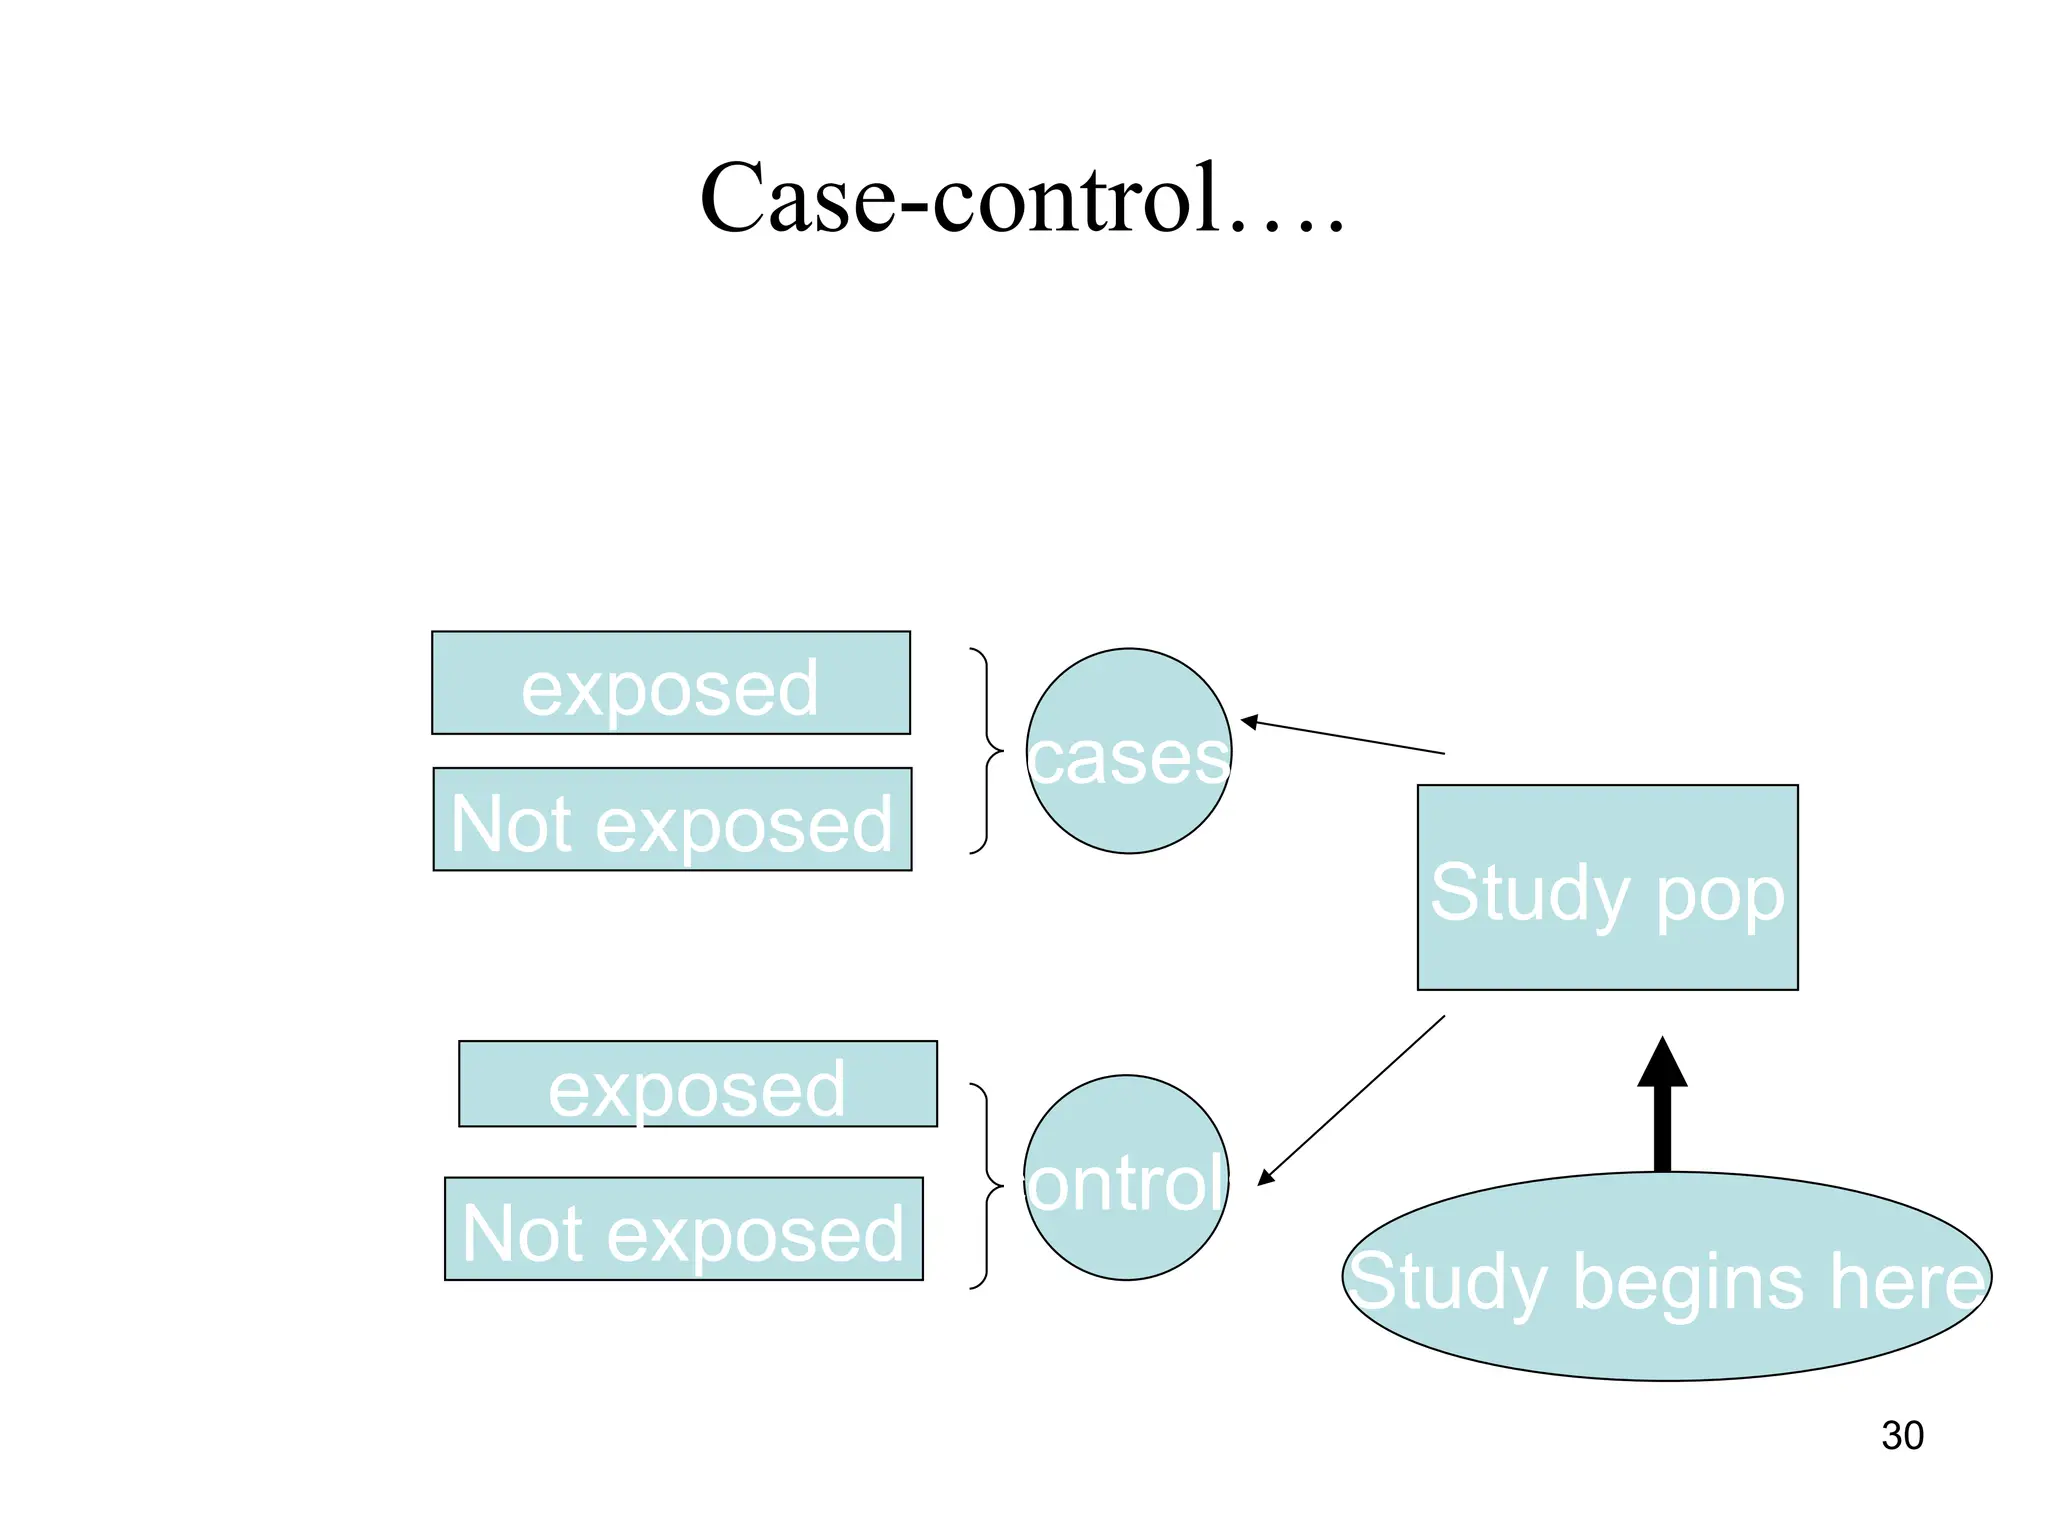
Case control study
Designconcept
• Starts with cases and comparative groups(controls)
• We determine what proportion of cases were exposed and
what proportion were not
• We also determine what proportion of controls were exposed
and what proportion were not
• Also called case-referent or retrospective
29
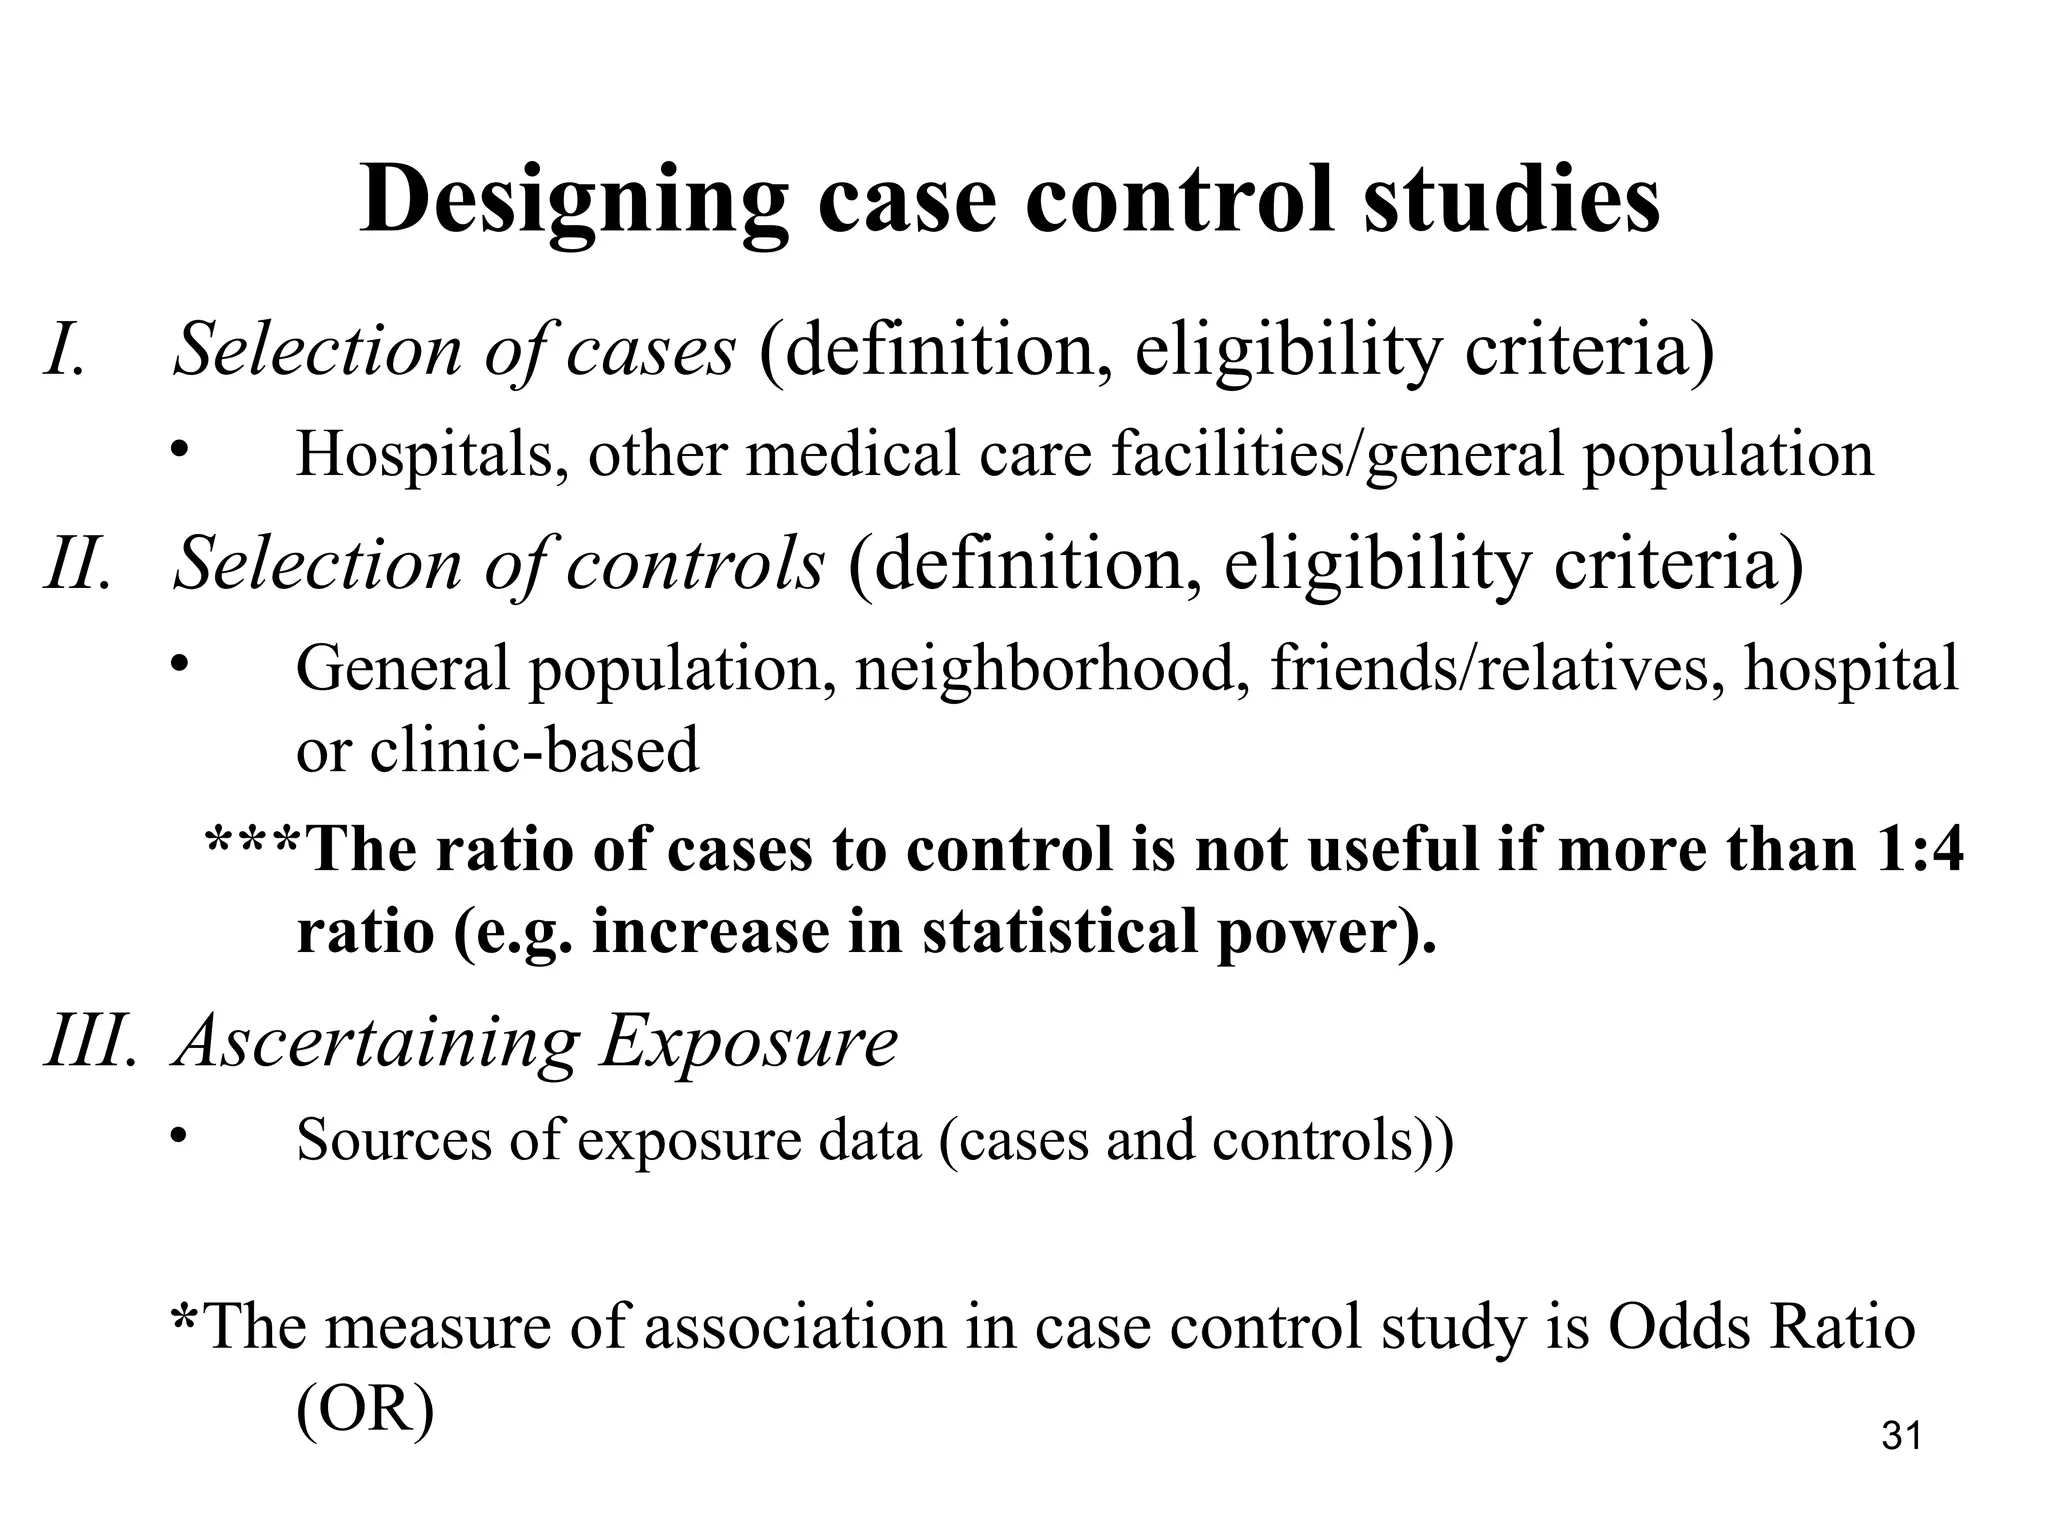
Designing case controlstudies
I. Selection of cases (definition, eligibility criteria)
• Hospitals, other medical care facilities/general population
II. Selection of controls (definition, eligibility criteria)
• General population, neighborhood, friends/relatives, hospital
or clinic-based
***The ratio of cases to control is not useful if more than 1:4
ratio (e.g. increase in statistical power).
III. Ascertaining Exposure
• Sources of exposure data (cases and controls))
*The measure of association in case control study is Odds Ratio
(OR) 31
32.
Basic assumptions(Basic Idea)
Cases are representative of all cases who
develop the disease in the population.
Controls are representative of the general
"healthy" population who do not develop the
disease
Information is collected from cases and controls in
the same way
32
33.
Selection of Cases
Requirescase-definition:
–Need for standard diagnostic criteria .
–Consider severity of disease?
–Consider duration of disease
–prevalent or incident case?
Requires eligibility criteria
–Area of residence, age, sex, etc
33
34.
Advantages of Case-ControlStudies
• Quick and easy to complete, cost effective
• Most efficient design for rare diseases
• Usually requires a smaller study population than
a cohort study
34
35.
• Uncertainty ofexposure-disease time relationship
• Inability to provide a direct estimate of risk
• Not efficient for studying rare exposures
• Subject to biases (recall & selection bias)
• Subject to confounding (for confounders not matched at the
design stage)
• Can not be used to determine prevalence and incidence in a
population
Disadvantages of Case-Control Study
35
36.
Cohort studies
36
A groupof people who share a common experience or
condition
Cohort studies
– The observation of a cohort over time to measure
outcome(s)
– Because the data on exposure and disease refer to
different points in time, cohort studies are
longitudinal studies
– Longitudinal, follow-up or incidence studies
37.
Indication of acohort study
37
When there is good evidence of exposure and
disease.
When exposure is rare but incidence of disease
is higher among exposed
When follow-up is easy, cohort is stable
When ample funds are available
38.
Cohort studies….
38
Have 2primary purposes:
Descriptive: to describe the incidence rates of an outcome
Analytic: to analyse associations between the outcomes and
risk factors (Usual type)
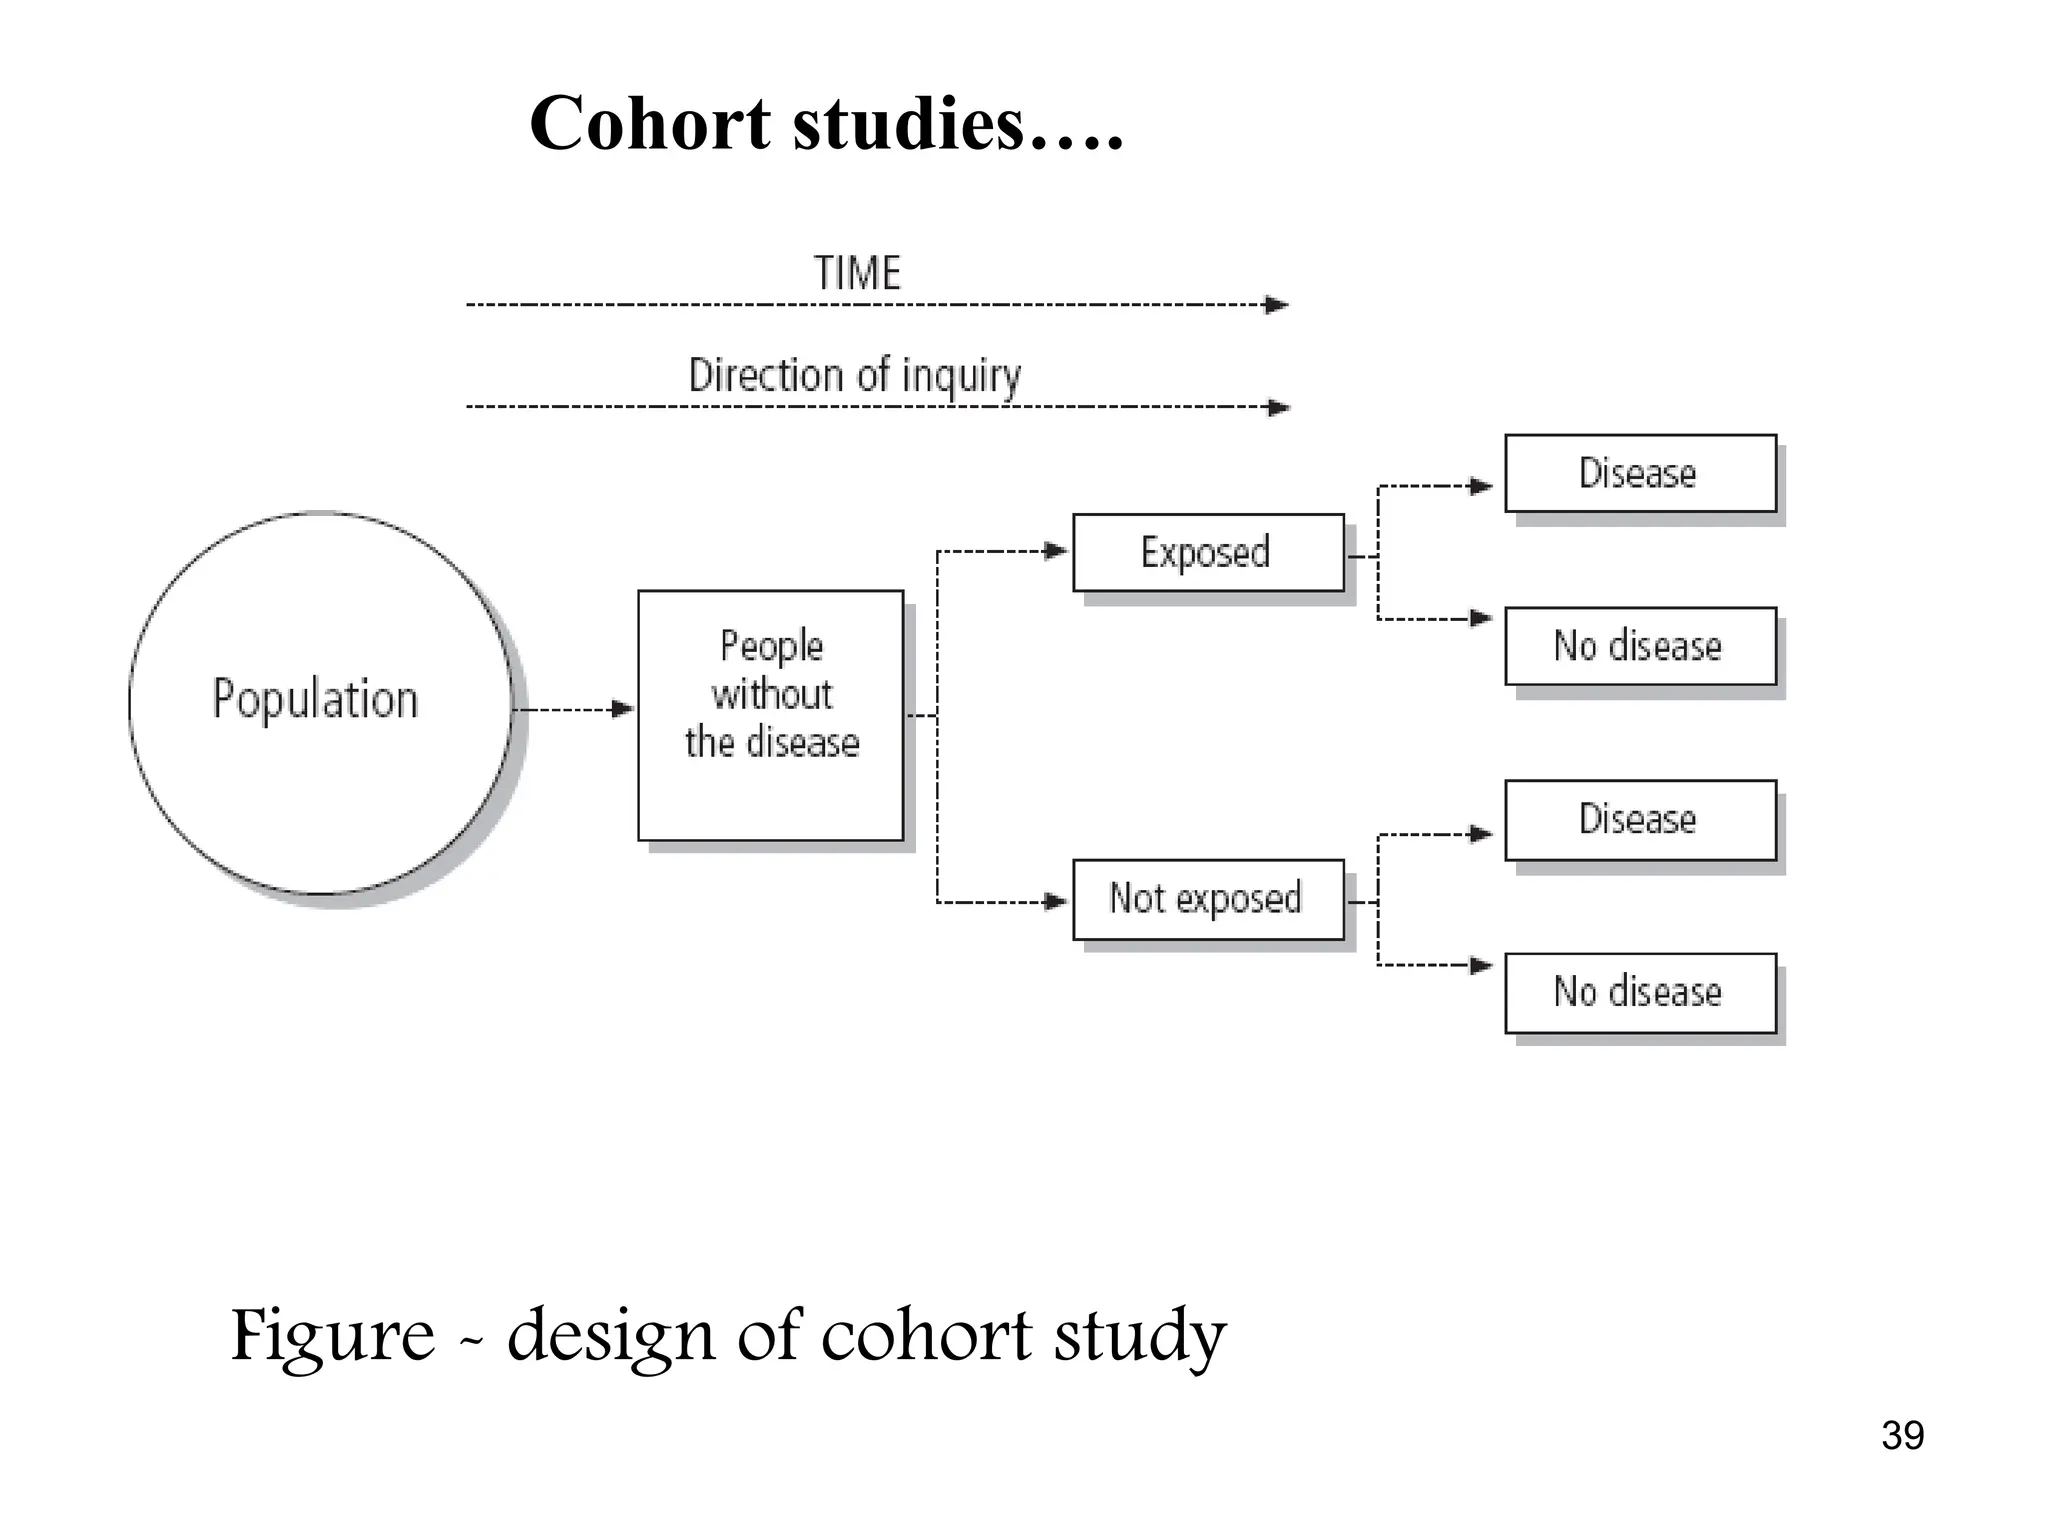
Begin with a group of people free of disease
Classified into subgroups according to exposure to a
potential cause of outcome
Both exposed and unexposed groups are followed
prospectively for a specified period of time for the
occurrence of the outcome
Who will develop an outcome, when and why?
Types of cohortstudies
40
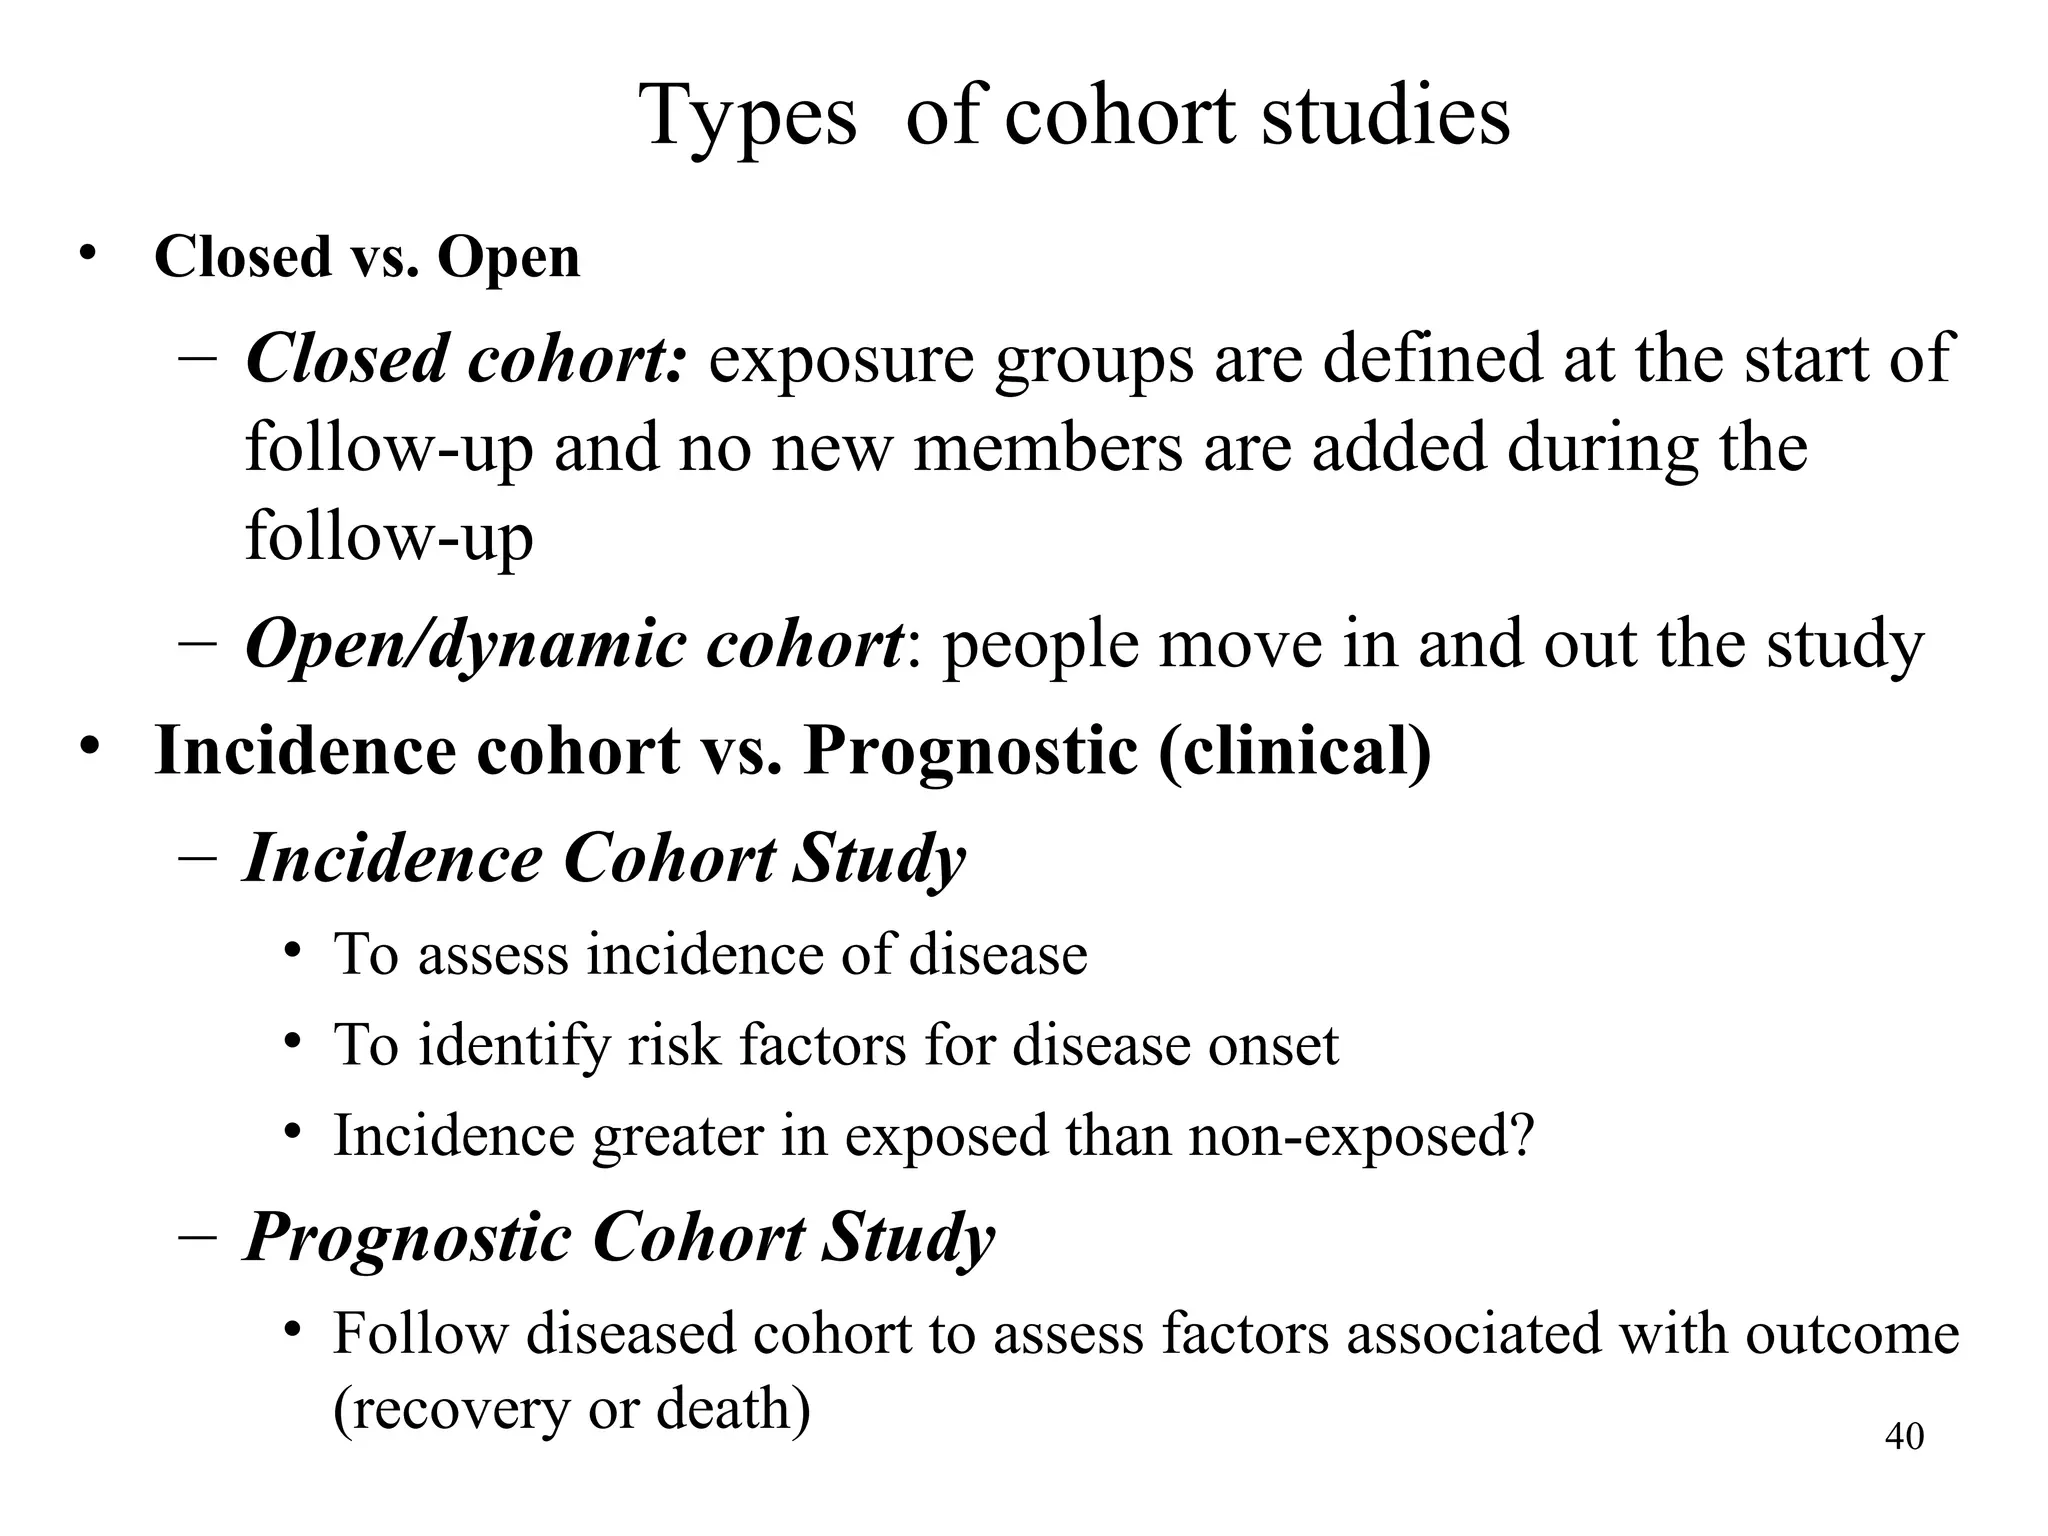
• Closed vs. Open
– Closed cohort: exposure groups are defined at the start of
follow-up and no new members are added during the
follow-up
– Open/dynamic cohort: people move in and out the study
• Incidence cohort vs. Prognostic (clinical)
– Incidence Cohort Study
• To assess incidence of disease
• To identify risk factors for disease onset
• Incidence greater in exposed than non-exposed?
– Prognostic Cohort Study
• Follow diseased cohort to assess factors associated with outcome
(recovery or death)
41.
Types of cohortstudies ...
41
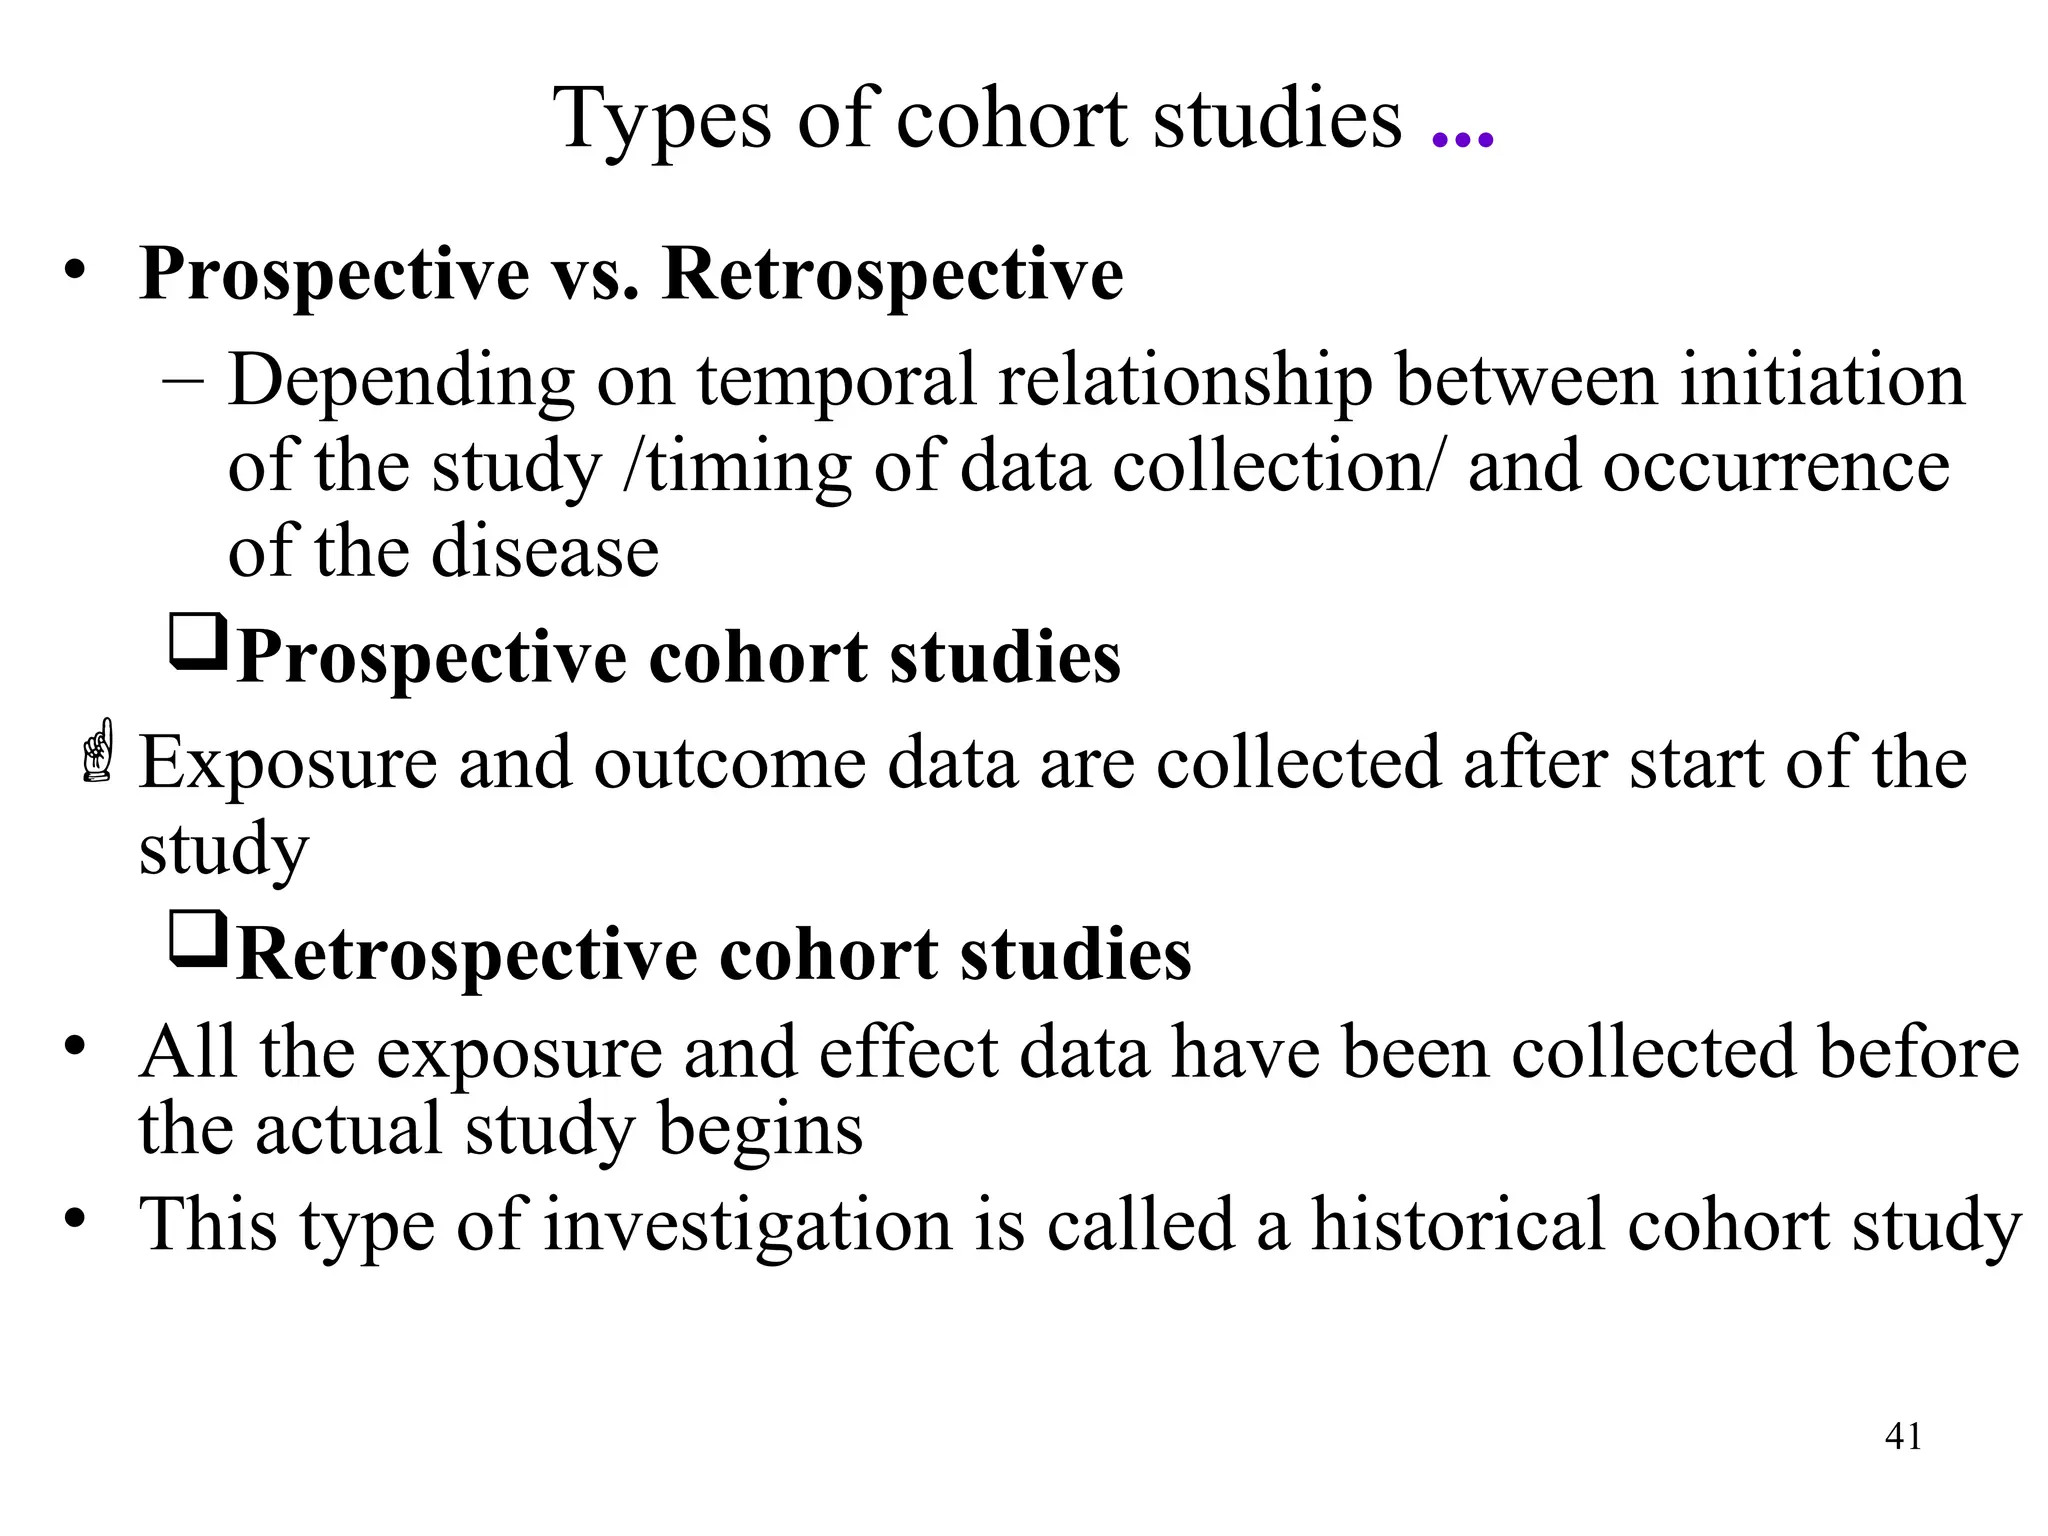
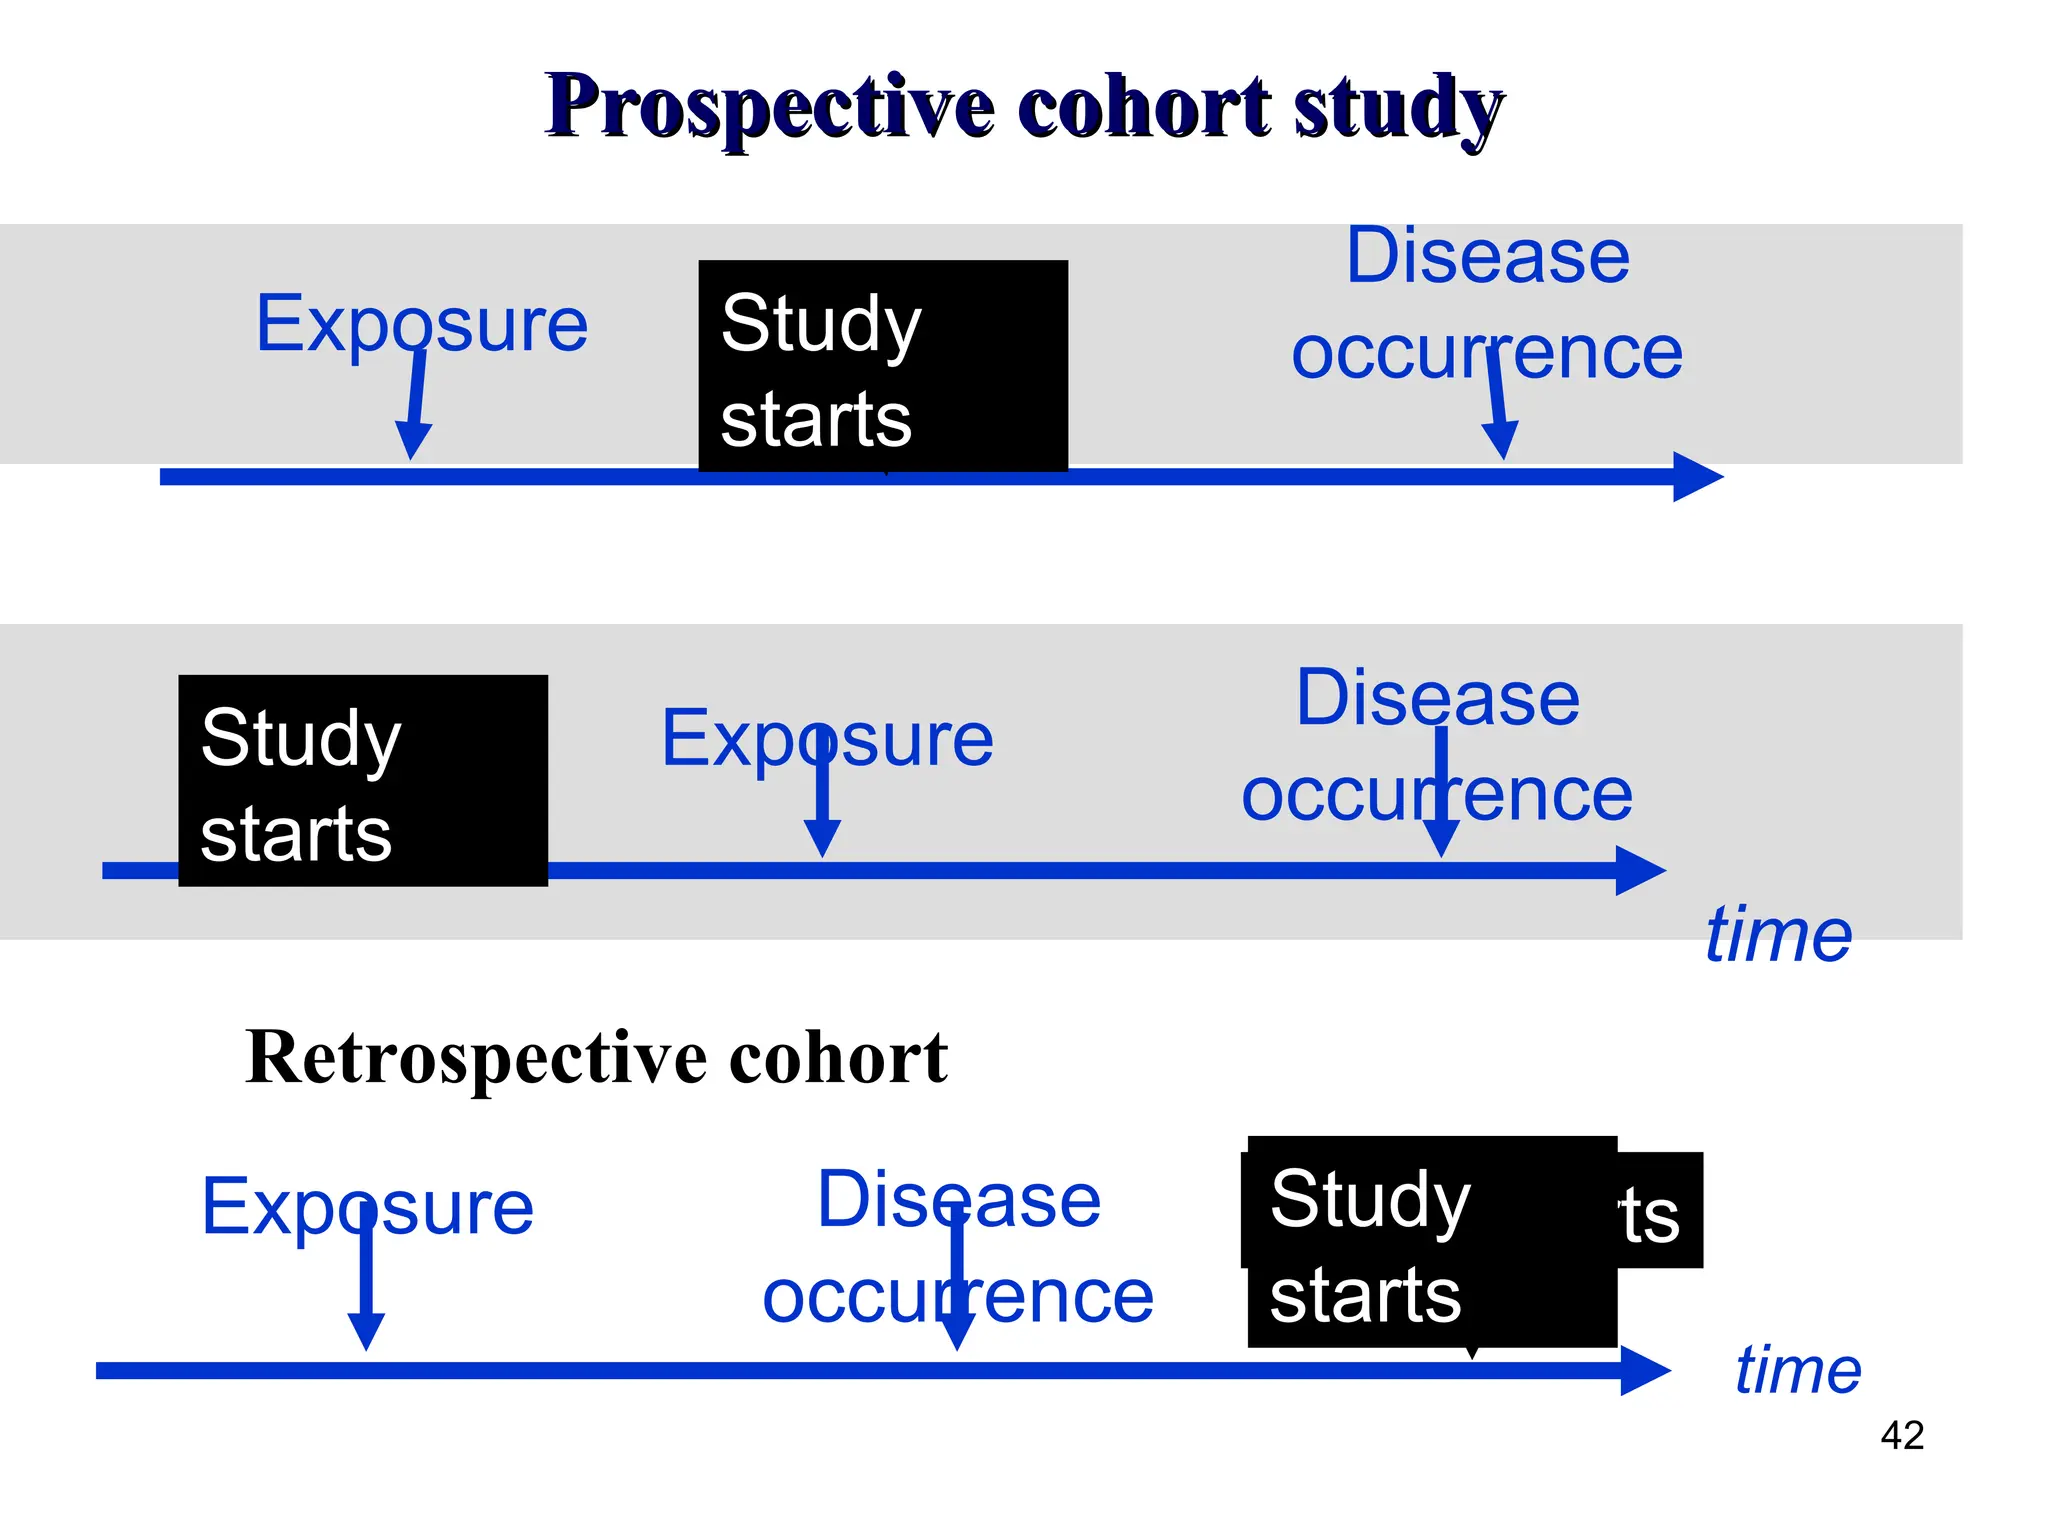
• Prospective vs. Retrospective
– Depending on temporal relationship between initiation
of the study /timing of data collection/ and occurrence
of the disease
Prospective cohort studies
Exposure and outcome data are collected after start of the
study
Retrospective cohort studies
• All the exposure and effect data have been collected before
the actual study begins
• This type of investigation is called a historical cohort study
Prospective cohort study….
43
Strengths
Accuratemeasurement of exposure (but often
measured only once)
Valuable for studying risk factors of fatal diseases
Can study several outcomes
Cause-effect relationship
Efficient for rare exposure
Relative risk can be measured
44.
Prospective cohort study…..
Weaknesses
Large study populations required
Not easy to find subjects
Expensive or Costs are high
Time consuming/results are delayed
Requires rigid design and conditions
Subjects lost over time (dropouts)
Logistically demanding
Maintaining quality, validity, accuracy and reliability can be a
problem
Unsuitable for rare diseases
Challenges in conductingCohort Study
Multiple dimensions of time in cohort study
Loss to follow-up
Effect of non response
Huge requirements of resources and
manpower
Management of huge database
Long term follow-up
47
48.
Proportional Mortality Studies
Proportional morbidity or mortality study involves data
on cases or deaths.
Special type of case-control (or cross-sectional) study.
A group of individuals with (or dying from) the index
disease of interest is compared with a group of
individuals with (or dying from) certain other diseases.
48
49.
cont…
• Study onthe proportions of dead exposed subjects assigned to
index causes of death are compared with the proportions of
dead unexposed subjects assigned to the index causes.
A proportional mortality study includes only dead subjects.
• The resulting proportional mortality ratio (abbreviated PMR) is
the traditional measure of the effect of the exposure on the index
causes of death.
49
50.
Cont…
•a proportional mortalitystudy does not involve the identification
and follow-up of cohorts.
•All subjects are dead at the time of entry into the study.
•Interpretation: if the exposure causes (or prevents) a specific
fatal illness, there should be proportionately more (or fewer)
deaths from that illness among dead people who had been
exposed than among dead people who had not been exposed.
50
51.
Interpretation driven flaws(weakness)
•PMRcomparison cannot distinguish whether exposure
increases the occurrence of the index causes of death,
prevents the occurrence of other causes of death, or some
mixture of these effects (McDowall, 1983).
51
52.
Cont…
• they cannotdetermine the extent to which
- exposure causes the index causes of death or
- worsens the prognosis of the illnesses corresponding to the
index causes.
52
53.
Experimental or Interventionalstudy designs
Are types Epidemiological study designs used to
assess or evaluate the effect of an intervention on
experimental group by allocating intervention to
experimental group and comparing them with control
groups
Assess the effects of
preventive or therapeutic agents,
treatments ,
procedures, or
services
Gold standard of epidemiological studies – provides
the strongest possible epidemiological evidence of
causation that epidemiological studies can deliver
54.
Experimental or…
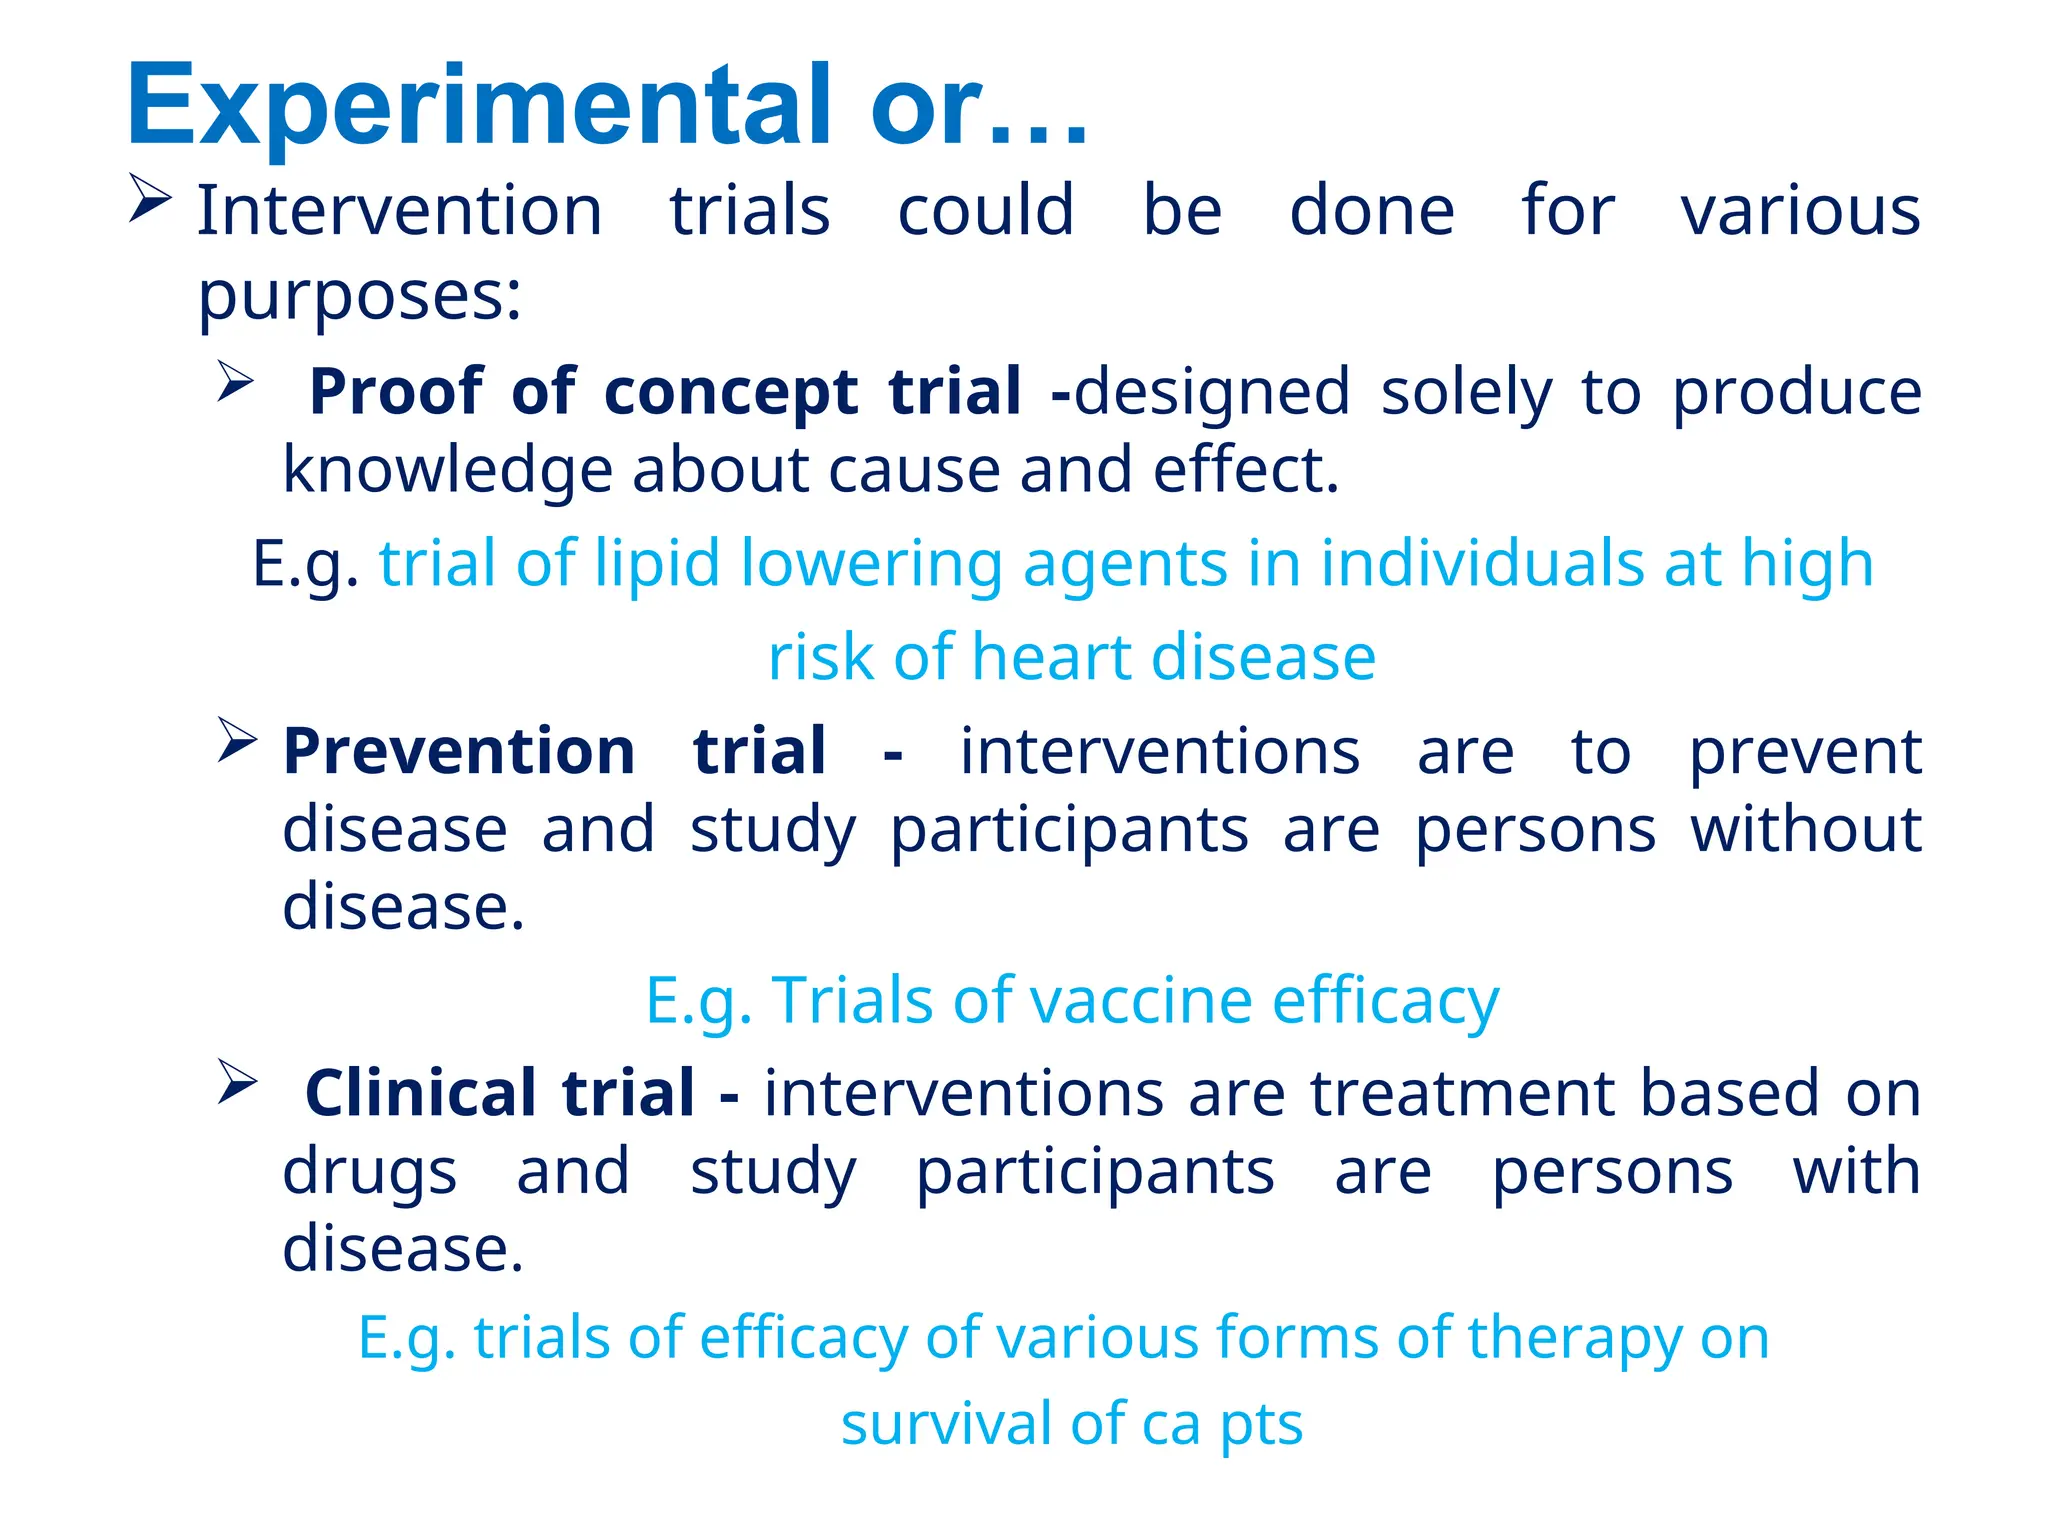
Interventiontrials could be done for various
purposes:
Proof of concept trial -designed solely to produce
knowledge about cause and effect.
E.g. trial of lipid lowering agents in individuals at high
risk of heart disease
Prevention trial - interventions are to prevent
disease and study participants are persons without
disease.
E.g. Trials of vaccine efficacy
Clinical trial - interventions are treatment based on
drugs and study participants are persons with
disease.
E.g. trials of efficacy of various forms of therapy on
survival of ca pts
55.
Experimental or ……
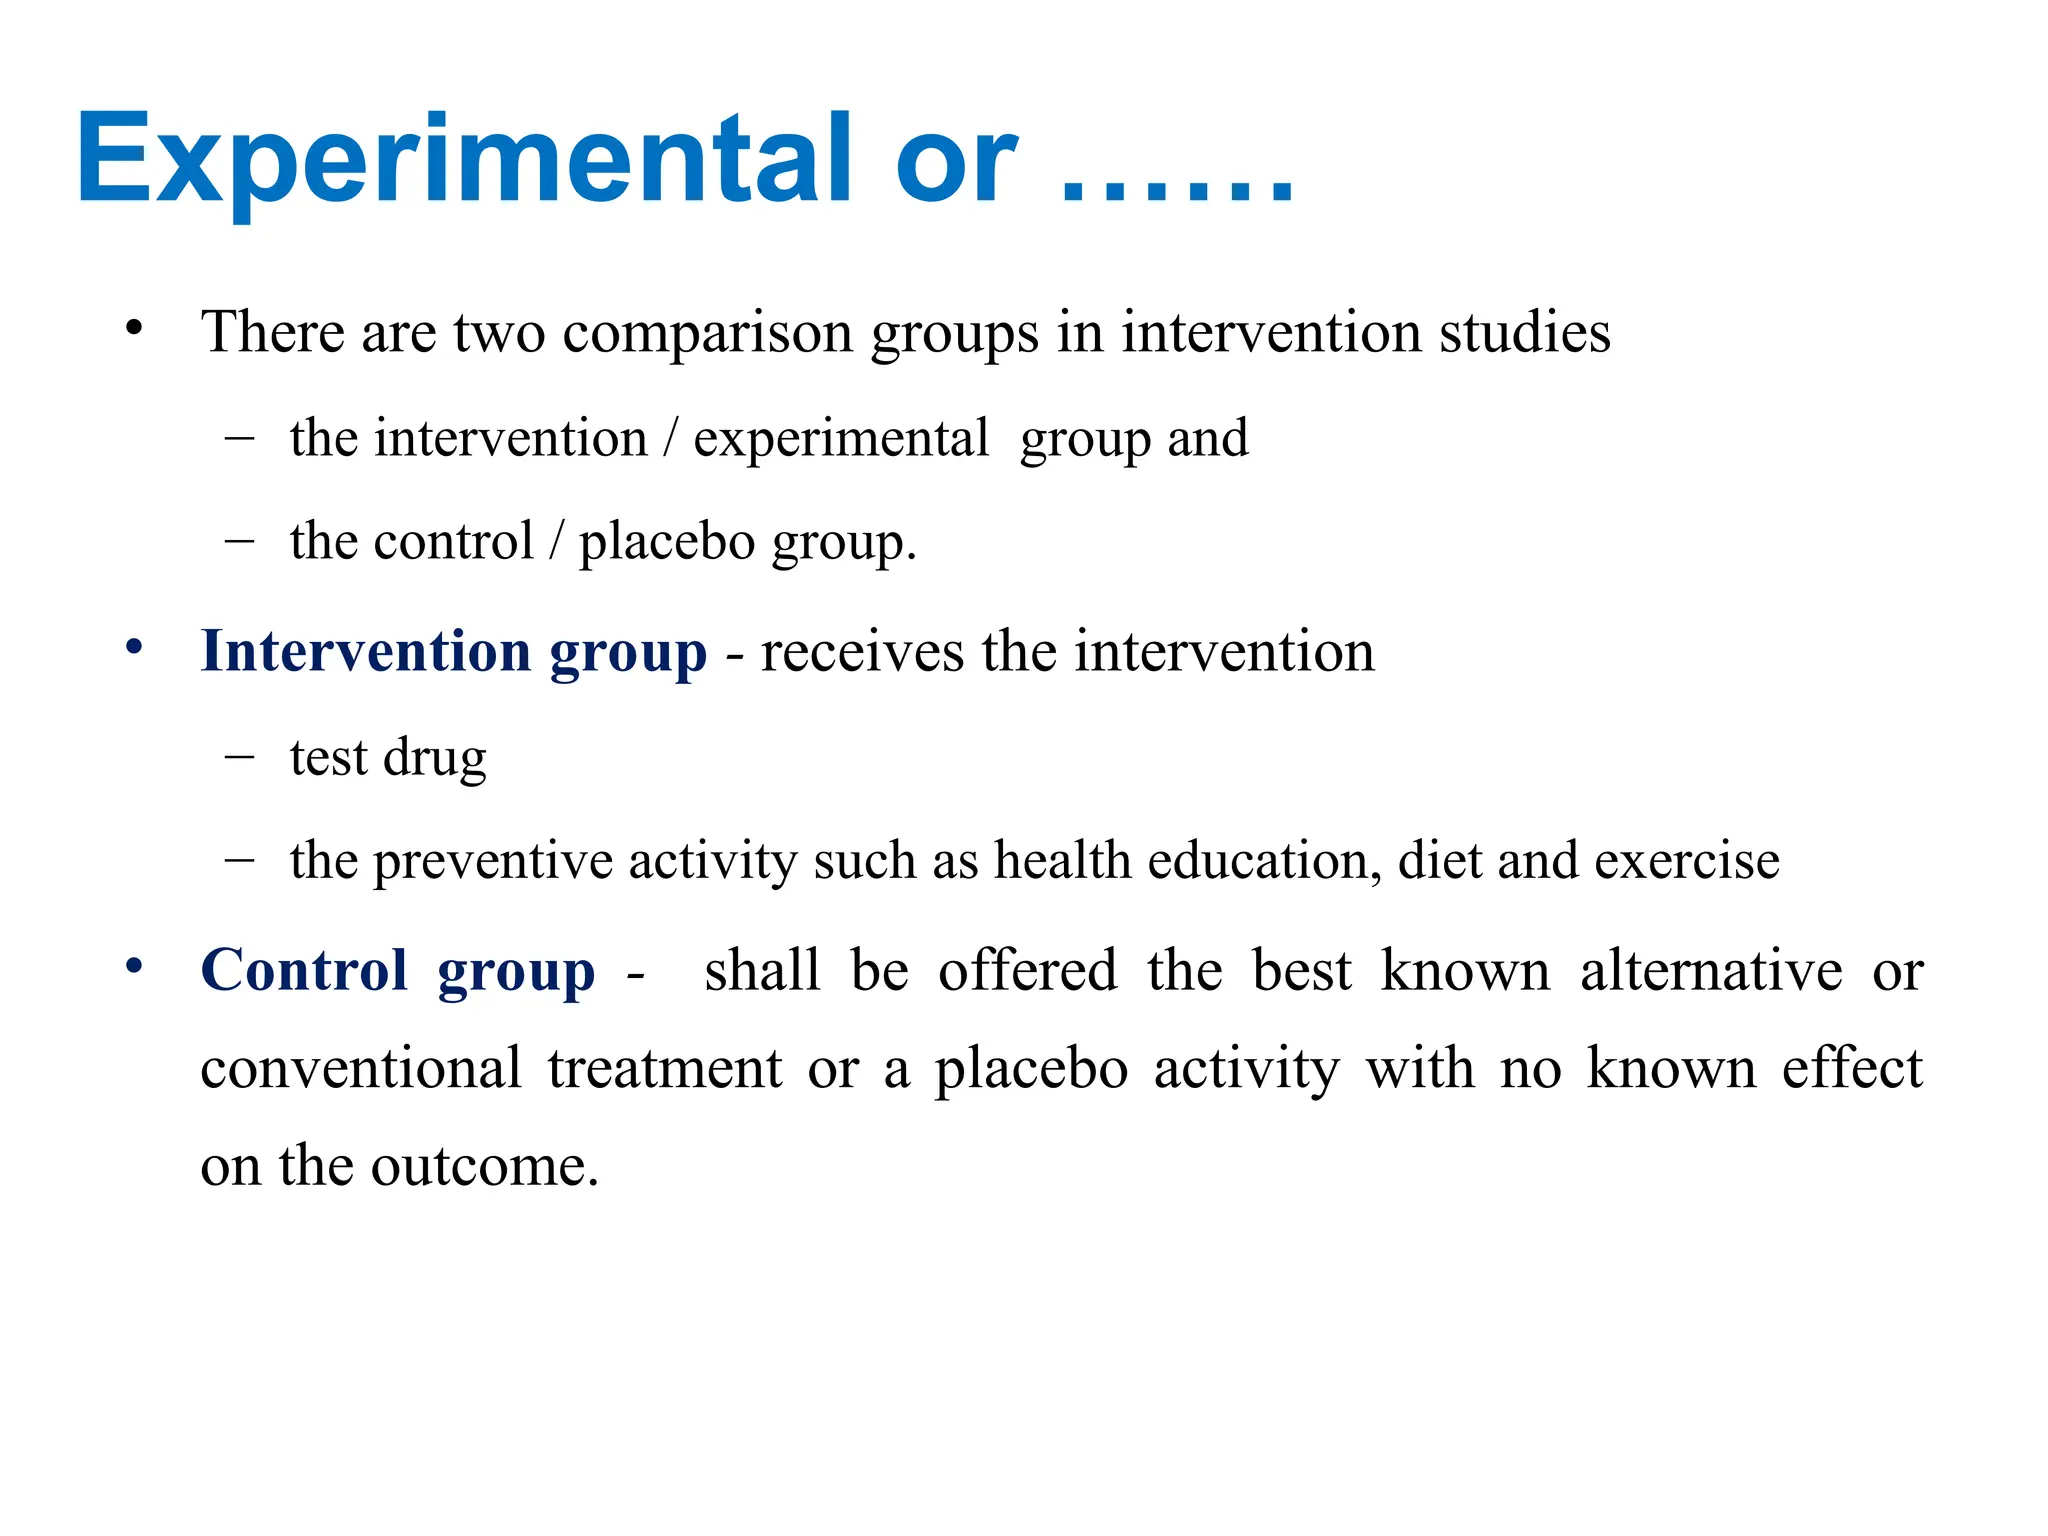
•There are two comparison groups in intervention studies
– the intervention / experimental group and
– the control / placebo group.
• Intervention group - receives the intervention
– test drug
– the preventive activity such as health education, diet and exercise
• Control group - shall be offered the best known alternative or
conventional treatment or a placebo activity with no known effect
on the outcome.
56.
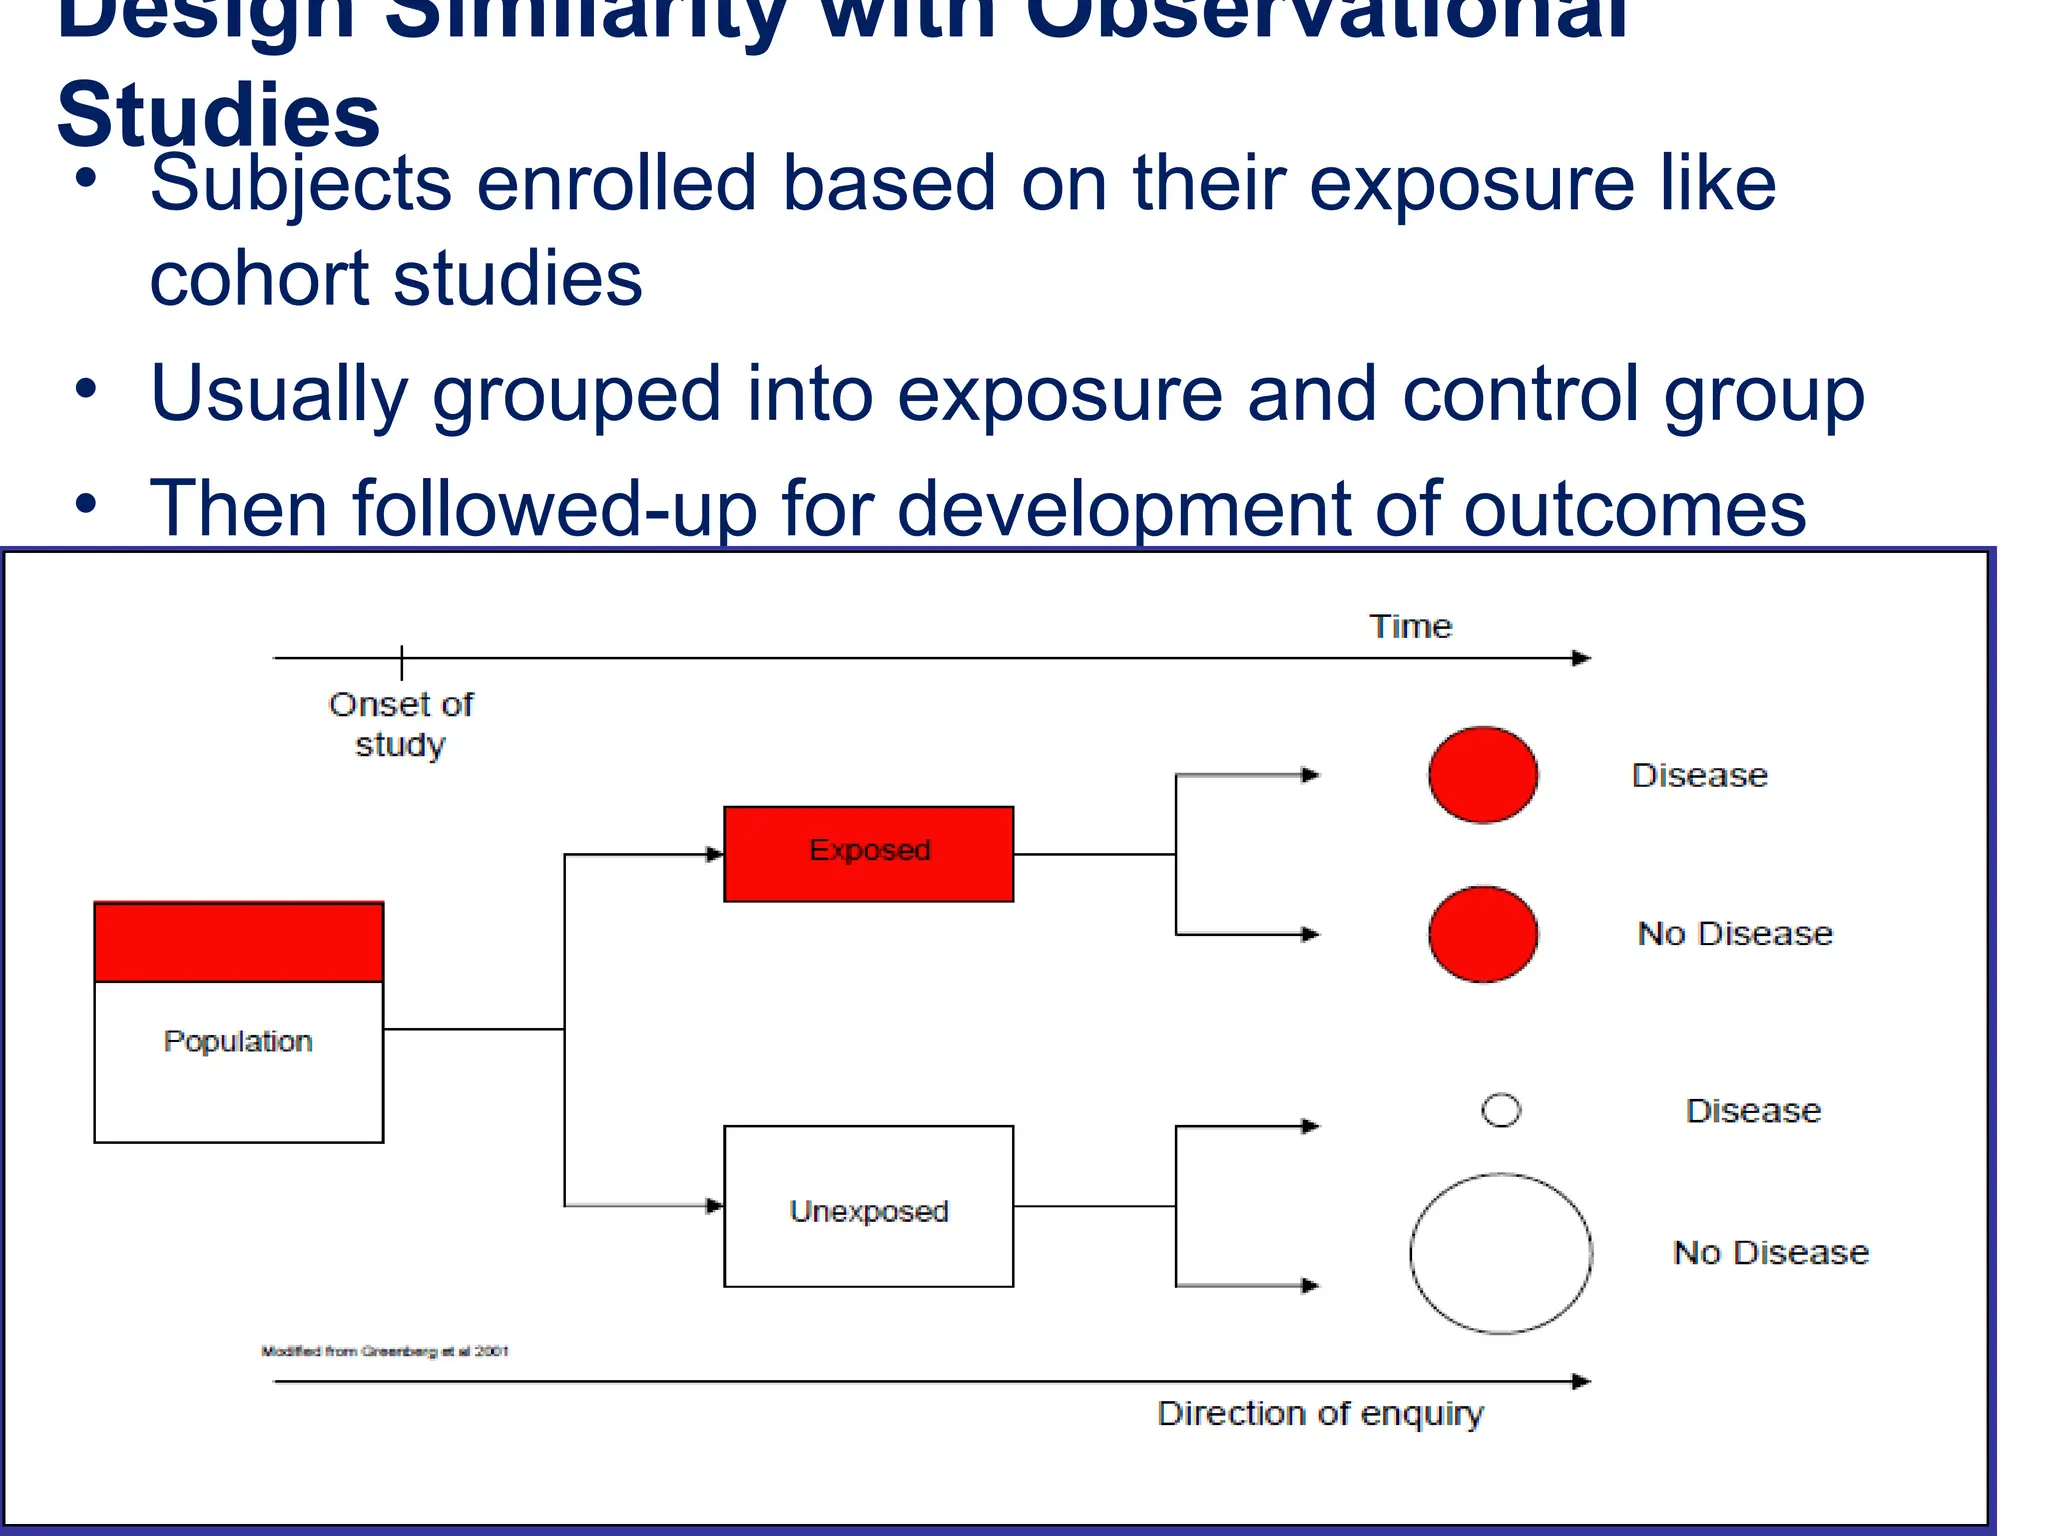
Design Similarity withObservational
Studies
• Subjects enrolled based on their exposure like
cohort studies
• Usually grouped into exposure and control group
• Then followed-up for development of outcomes
57.
Design Difference withObservational
Studies
• The investigator determines who is exposed
i.e. allocates an intervention
• The design is controlled by the investigator
• The experimental group is given the
intervention
58.
When to choosean experimental design?
• When:
– the research question cannot be answered by
observational studies
– earlier observational studies have not answered the
research question
– existing knowledge is not sufficient to determine
clinical or public health policy
– an experiment is likely to provide an important
extension of the existing knowledge
59.
Classification of interventionalstudies
1. Based on population
A. Clinical trial - usually performed in clinical
setting and the subjects are patients.
B. Field trial - used in testing medicine for
preventive purpose and the subjects are healthy
people.
E.g. vaccine trial
C. Community trial- unit of the study is group of
people/community.
E.g. fluoridation of water to prevent
dental caries.
60.
Classification ….
2. Basedon design
A. Uncontrolled trial - no control group. control will be
past experience (history).
B. Non-randomized controlled- there is control group but
allocation into either group is not randomized
C. Randomized controlled - there is control group and
allocation into either group is randomized.
61.
Classification …..
3. Basedon objective
A. Phase I - trial on small subjects to test a new drug
with small dosage to determine the toxic effect.
B. Phase II - trial on small group to determine the
therapeutic effect.
C. Phase III- study on large population - usually a
randomized control trial. For efficacy of
treatments
D. Phase IV – after drug is marketed – for efficacy
and side-effects
62.
Clinical Trials
• Assessefficacy of therapeutic interventions
– Therapeutic interventions include
• drugs,
• surgery,
• physiotherapy,
• health education
– Patients are the study subjects
• Clinical trials could aim at
• Cure,
• Prevention of disability or
• Preventing recurrence
E.g. trial of anti-malarial, anti-diabetics
agents
63.
Field Trials
• Assesseffectiveness of preventive interventions
– Preventive trials aim at -
• preventing occurrence of disease
– Preventive interventions include
• vaccines,
• health education,
• sanitary interventions,…
– Deal with individuals who have not developed the
disease
E.g. trial of vaccine against cholera
• Similarity with clinical trials - Unit of randomization
is an individual not group unlike community
randomized trials
64.
• Applications offield trials is Limited to
– Common disease or
– extremely severe disease,
– high risk groups
E.g.
–Vit C against common cold,
–Polio vaccine trial
• Limitations
– More expensive
• Needs visiting subjects in the field and
• Require greater number of subjects as the
risk of disease is lower
65.
Randomized Clinical Trial(RCT)
• Randomization is done on individuals
– Each patient is given an equal chance of being
assigned to either group (e.g. treatment vs. placebo)
• Blinding (masking) is possible:
– Double-blind - study subjects and health care giver
do not know who is getting the active intervention
66.
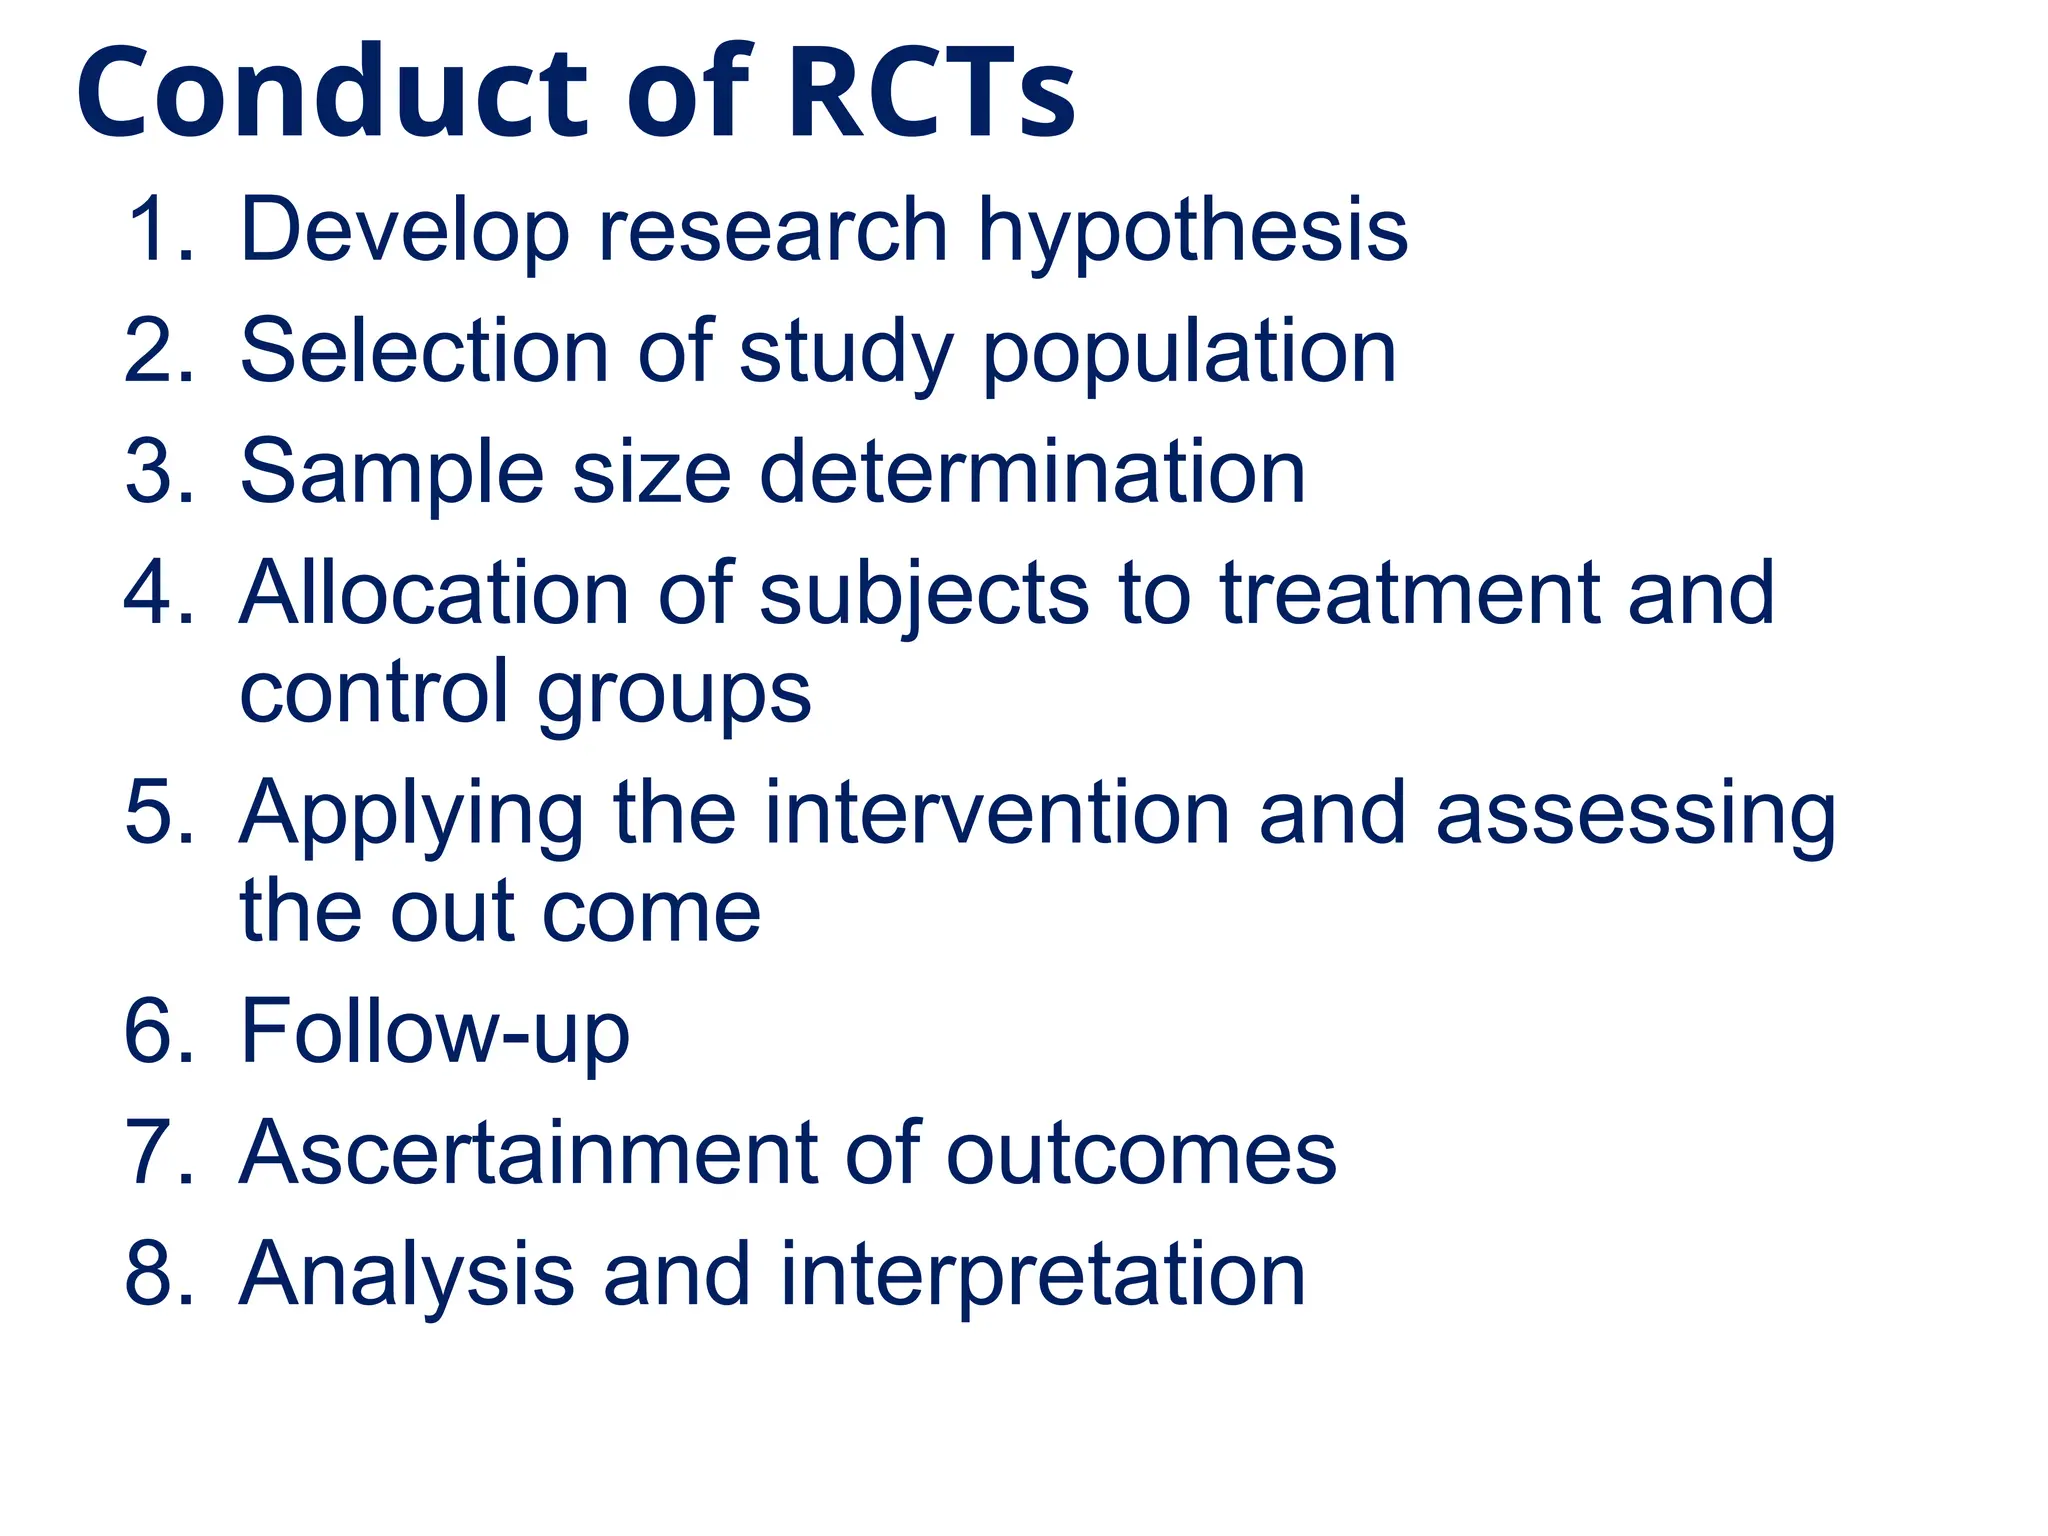
Conduct of RCTs
1.Develop research hypothesis
2. Selection of study population
3. Sample size determination
4. Allocation of subjects to treatment and
control groups
5. Applying the intervention and assessing
the out come
6. Follow-up
7. Ascertainment of outcomes
8. Analysis and interpretation
67.
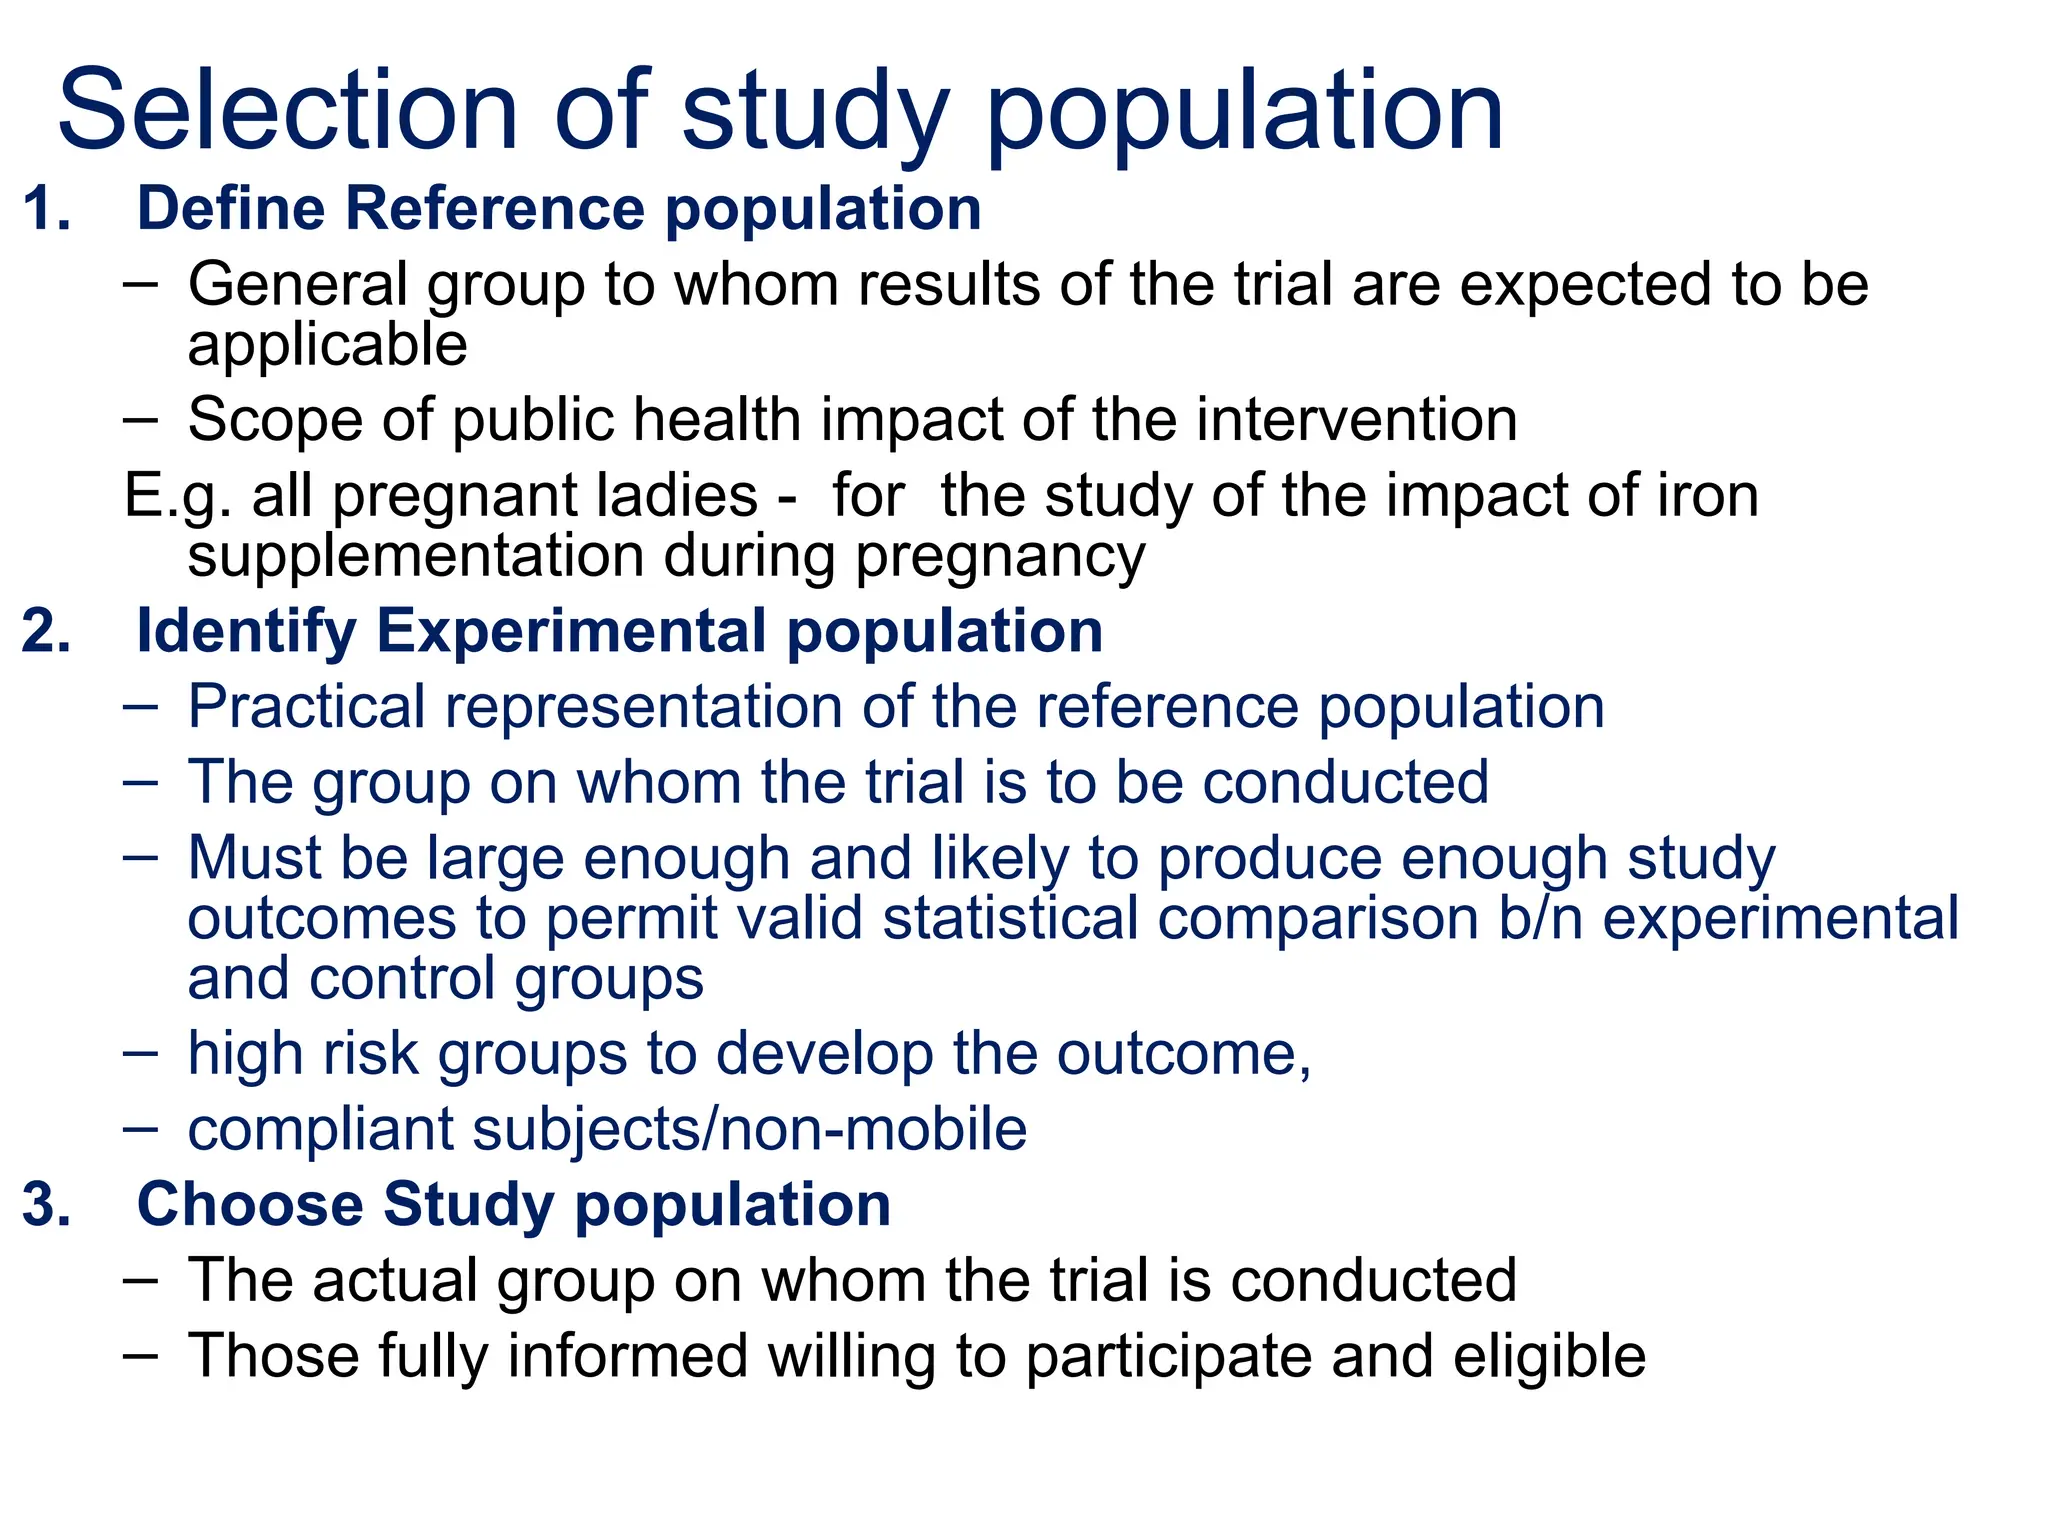
Selection of studypopulation
1. Define Reference population
– General group to whom results of the trial are expected to be
applicable
– Scope of public health impact of the intervention
E.g. all pregnant ladies - for the study of the impact of iron
supplementation during pregnancy
2. Identify Experimental population
– Practical representation of the reference population
– The group on whom the trial is to be conducted
– Must be large enough and likely to produce enough study
outcomes to permit valid statistical comparison b/n experimental
and control groups
– high risk groups to develop the outcome,
– compliant subjects/non-mobile
3. Choose Study population
– The actual group on whom the trial is conducted
– Those fully informed willing to participate and eligible
68.
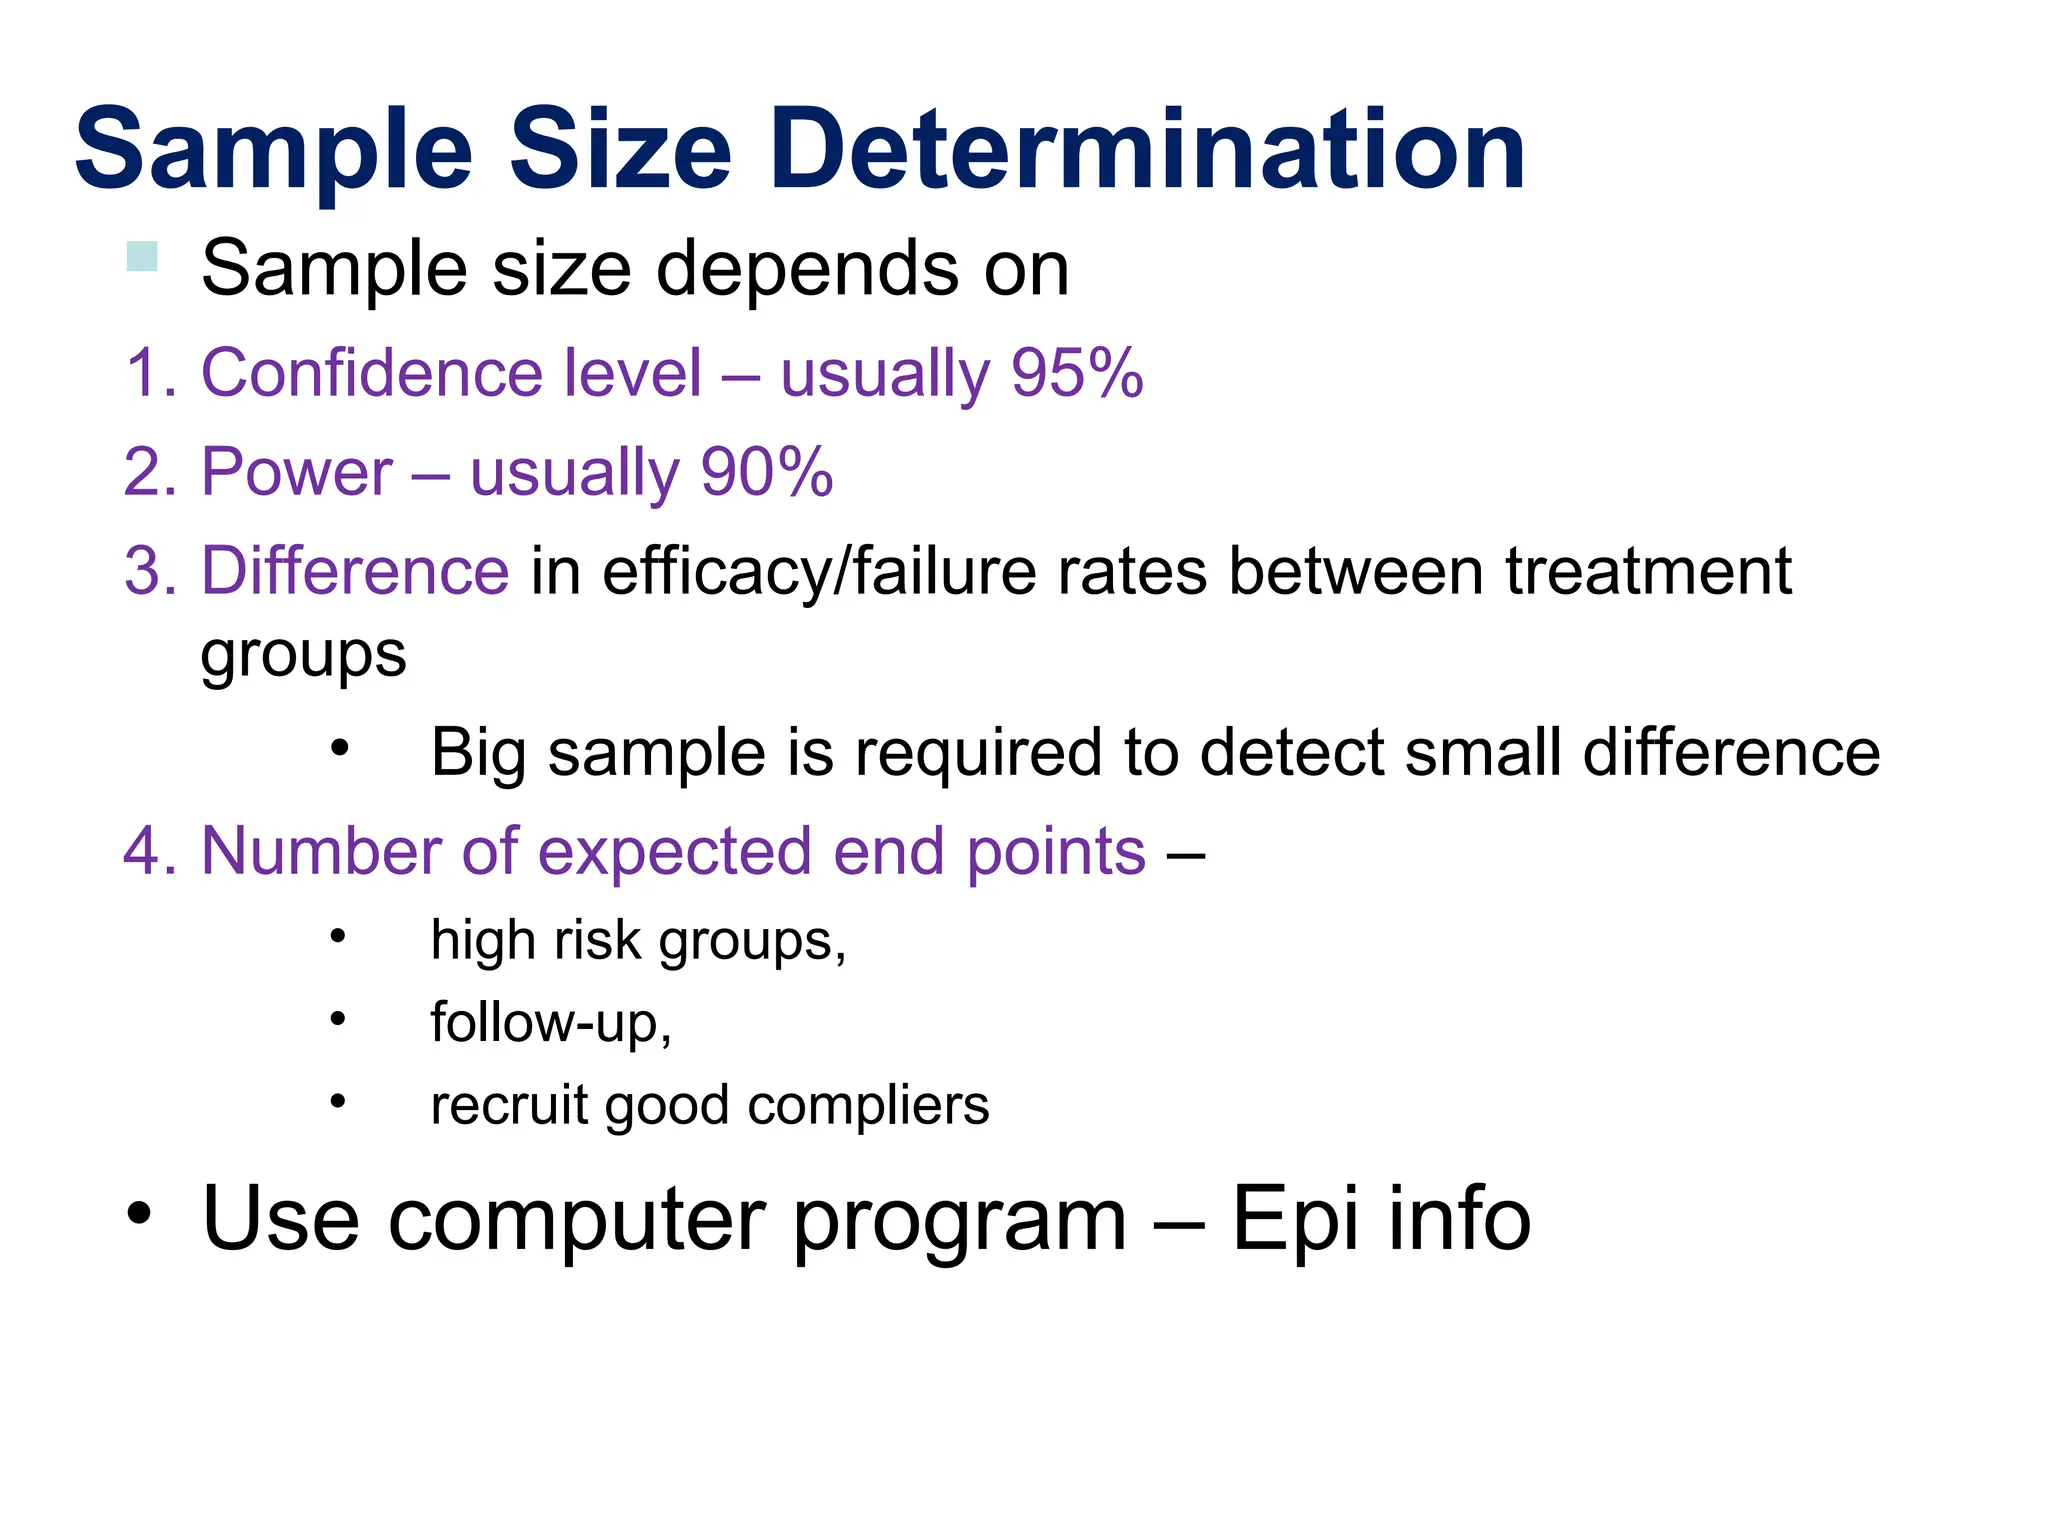
Sample Size Determination
Sample size depends on
1. Confidence level – usually 95%
2. Power – usually 90%
3. Difference in efficacy/failure rates between treatment
groups
• Big sample is required to detect small difference
4. Number of expected end points –
• high risk groups,
• follow-up,
• recruit good compliers
• Use computer program – Epi info
69.
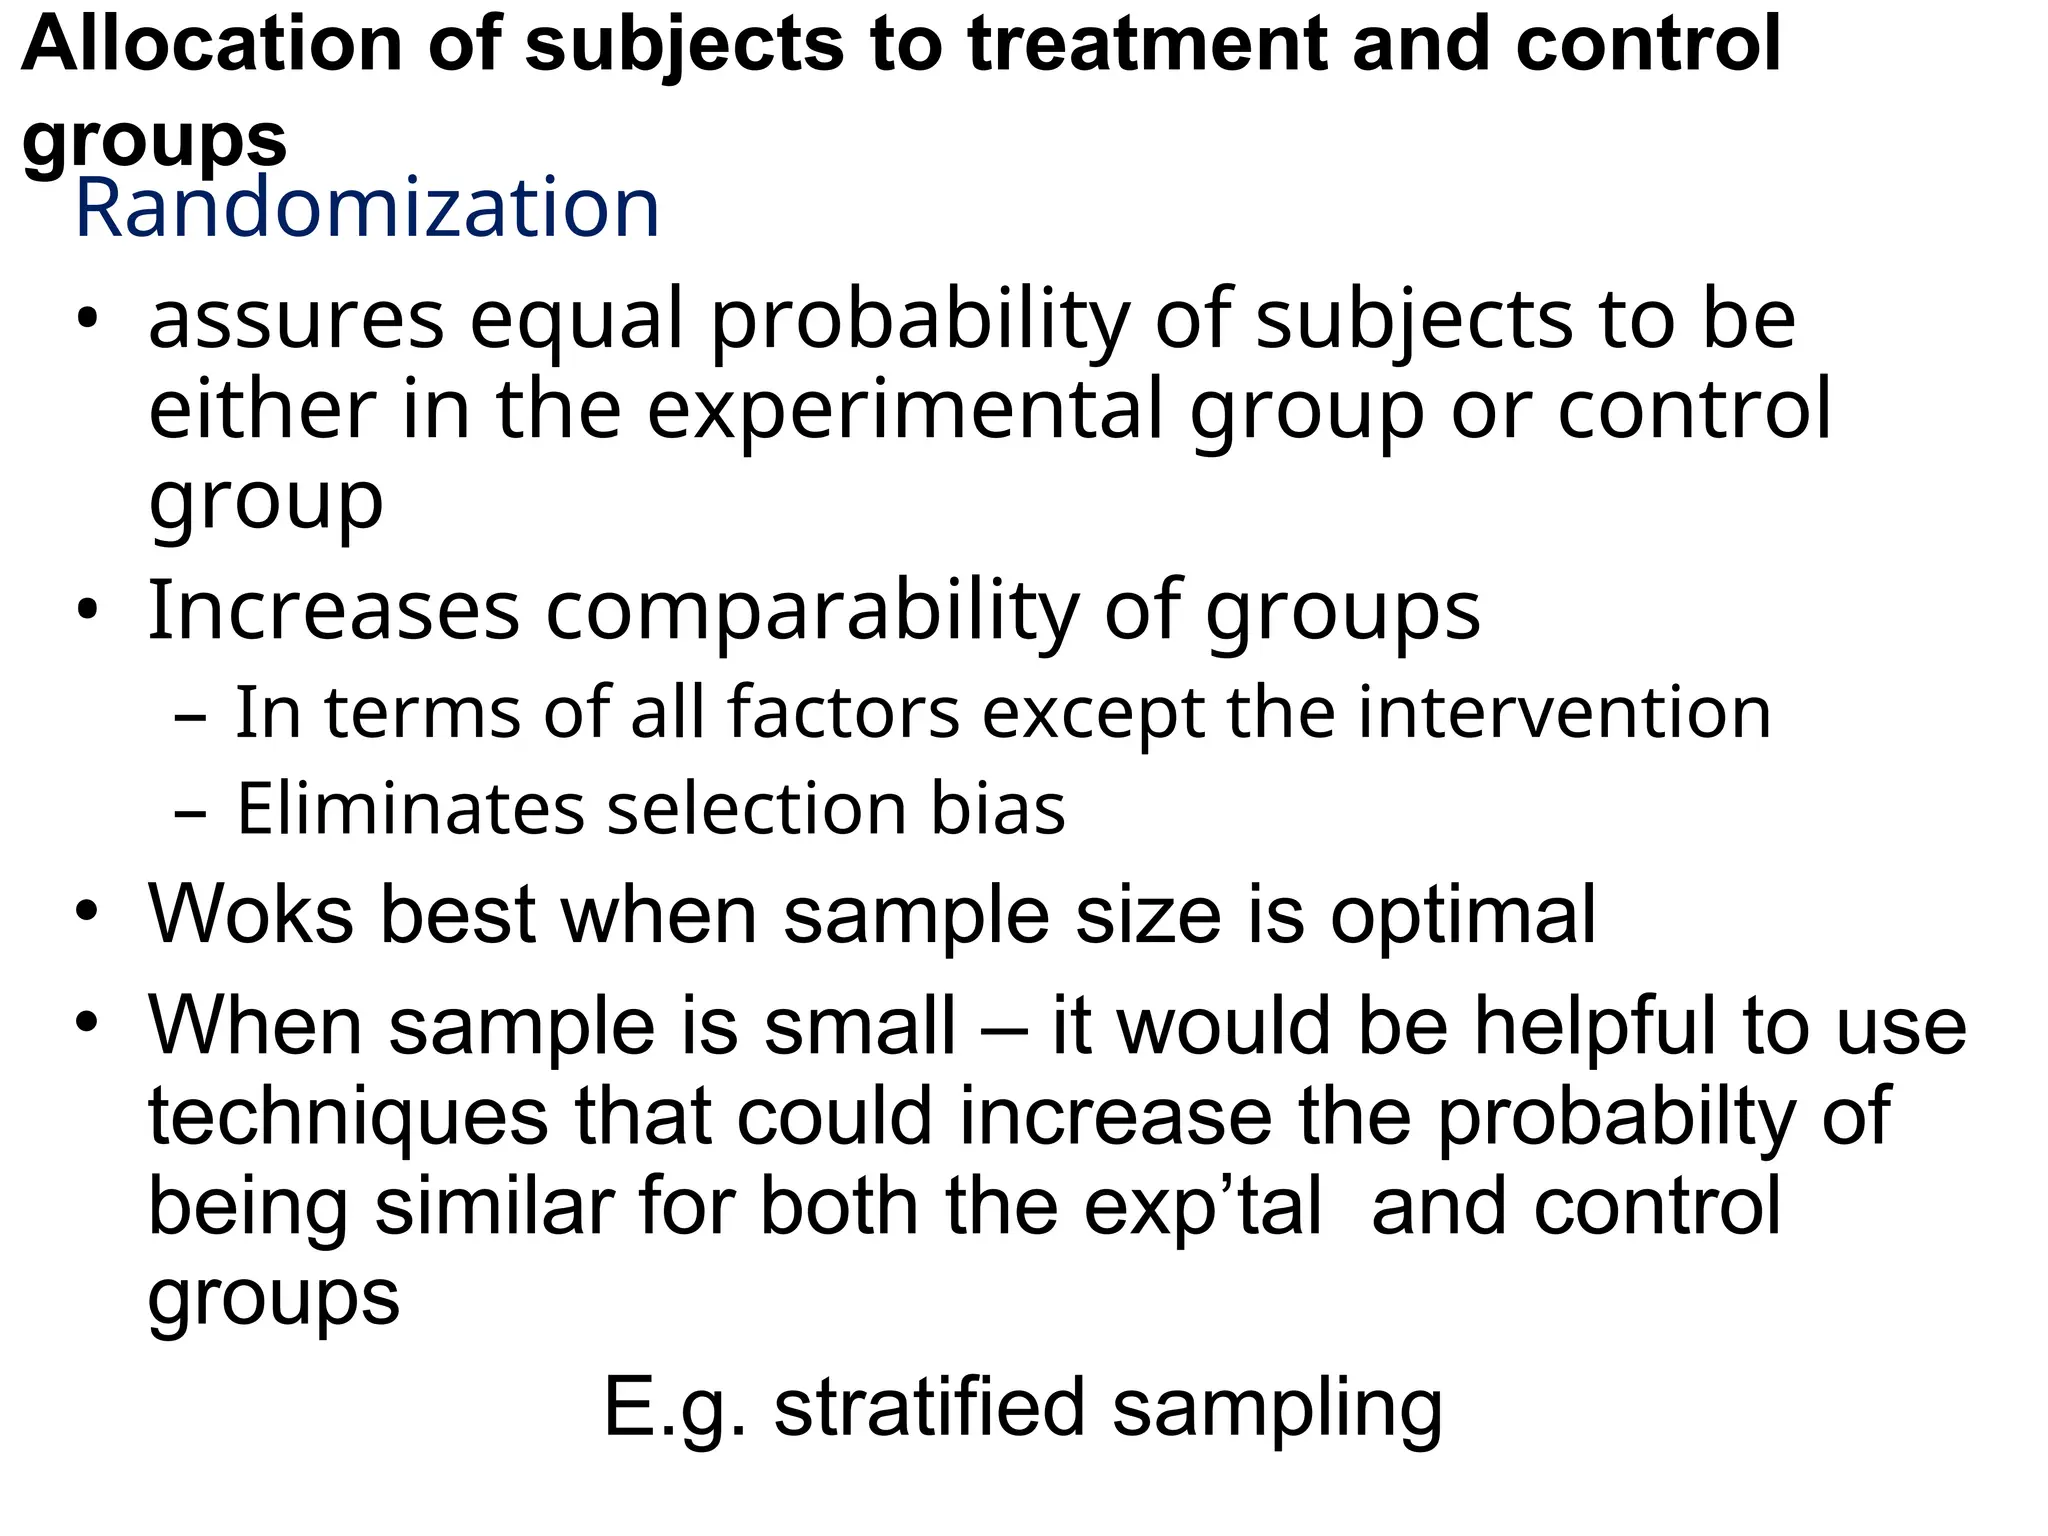
Allocation of subjectsto treatment and control
groups
Randomization
• assures equal probability of subjects to be
either in the experimental group or control
group
• Increases comparability of groups
– In terms of all factors except the intervention
– Eliminates selection bias
• Woks best when sample size is optimal
• When sample is small – it would be helpful to use
techniques that could increase the probabilty of
being similar for both the exp’tal and control
groups
E.g. stratified sampling
70.
Stratified randomization
1.Deliberate separationof subjects into
different strata
2.Random allocation of subjects from each
stratum into experimental and control group
3.Combine into final exp’tal and control group
71.
Applying the interventionand assessing the out
come
• After once the interventions are applied
subjects are followed up prospectively to
determine if the intervention applied to the
exp’tal groups is efficacious when compared
to control group
• Assessment during follow up period may be
subjected to measurement bias resulting from
differential effect
– On reporting the outcome b/n the two groups
– on compliance with study protocol
72.
Applying the interventionand assessing the out
come
Ways to minimize such problems
Blinding-
• keeping someone unaware of which treatment he has been given
• depriving info about who or which group is either treatment or
control group
– Ideally-
• the individual who makes the assignment -
• the patient and
• the assessor of the outcome
– Providing other available treatment or placebo
• Placebo -inert treatments intended to have no effect other than
psychological benefit
• Placebo or comparison treatment is externally similar with
intervention treatment
E.g. using coded pills
– Blinding is not possible when there is other treatment and use
of placebo is unethical
E.g. surgical interventions
73.
Allocation of subjectsto treatment and control
groups
Blinding the patient
to avoid placebo effect (psychological component of
offering treatment)
Blinding the individual who makes the assignment
to avoid bias in selection
• Blinding the assessor
– to prevent observation bias (Misdiagnosis by the
assessor-especially if outcome assessment is subjective
e.g. - clinical diagnosis)
Single blinding,
Double blinding,
Triple blinding
74.
Follow-up
• Monitor outcomesor untoward effects
• Measure outcome
– improvement, complication, side-effects
• Assess compliance
– Measure the extent of non-compliance
• may be measured through direct interview or
occasionally using biochemical measures. Helps to
improve estimates.
– The effect of non-compliance is to minimize
difference between treatment groups
75.
Ascertainment of outcome
•Ascertain outcome of interest
– using pre-set objective criteria similarly in all
groups
• By blinded assessors, if possible, to avoid
observation bias
76.
Decision for earlytermination
What issues do you think need decision for
modification or early termination of a trial?
• If there happens serious side effects
• If the outcome is clearly observed
• If the control group is hurt by not having
the intervention
• If the team is not doing as per the protocol
77.
Analysis and interpretation
•Compare relevant characteristics of treatment
groups
• Analyze by intention-to-treat
– non-adherers are included in the treatment category to
which they were originally assigned
– Doesn’t overestimate efficacy
– E.g. – Non-compliant individuals in intervention group
(stop or crosses to other treatment) poor outcome
Elimination of the non-compliers or assigning to placebo
group Exaggerate measured efficacy
• Avoided by keeping non-compliers to original treatment
• Interpretation – AR, ARR, RRR, NNT
78.
Strength and Weaknesses
•Strength of interventional studies
– Reduce variation by extraneous factors other
than the factors under study
• Strongest for assessing cause-effect relationship
• Weaknesses of interventional studies
– Ethical concerns – more than observational
studies
– Feasibility – less due to expense
79.
Community and clusterrandomized
Trials
• Intervention is implemented simultaneously
to groups or communities
• Employed when
– Intervention acts at population level
– Individual randomization is not feasible or
– Individual randomization results in substantial
contamination
• Interventions - Commonly preventive but can
also be therapeutic
80.
• Units ofrandomization:
– Communities- community intervention trials or
– Groups- cluster randomized trials
• Schools, Worksite
• Examples
– Educational interventions
– Water fluoridation to prevent dental carries
– Environmental sanitation interventions
81.
Overall study protocol
1.Select communities to be studied and collect
baseline information
Better to have more comparison groups than larger
size group
2. Allocate communities into experimental and
control groups and apply intervention
• in pairs or stratified
3. Assess outcomes during follow-up period
• Test for differences in the outcome variables
based on aggregate experiences of each of the
communities being compared
82.
Advantages and Disadvantages
•Advantages
– Organization of trial simpler
– contamination of the effects of the intervention
from subjects to controls is minimized
– to evaluate interventions at the cluster level
• Disadvantages
– difficult, or even impossible, to blind subjects
– loss of statistical power caused by
randomizing groups rather than individuals
83.
Quasi-experimental
• are trialsin which randomization and/or
control group is missing
• No randomization - two comparison groups in
which one serves as control
– E.g. – effect of health education on immunization
• No control group - Before and after designs
(pretest-posttest) studies
– E.g. –Long waiting time – Intervention -
Evaluation