Download to read offline

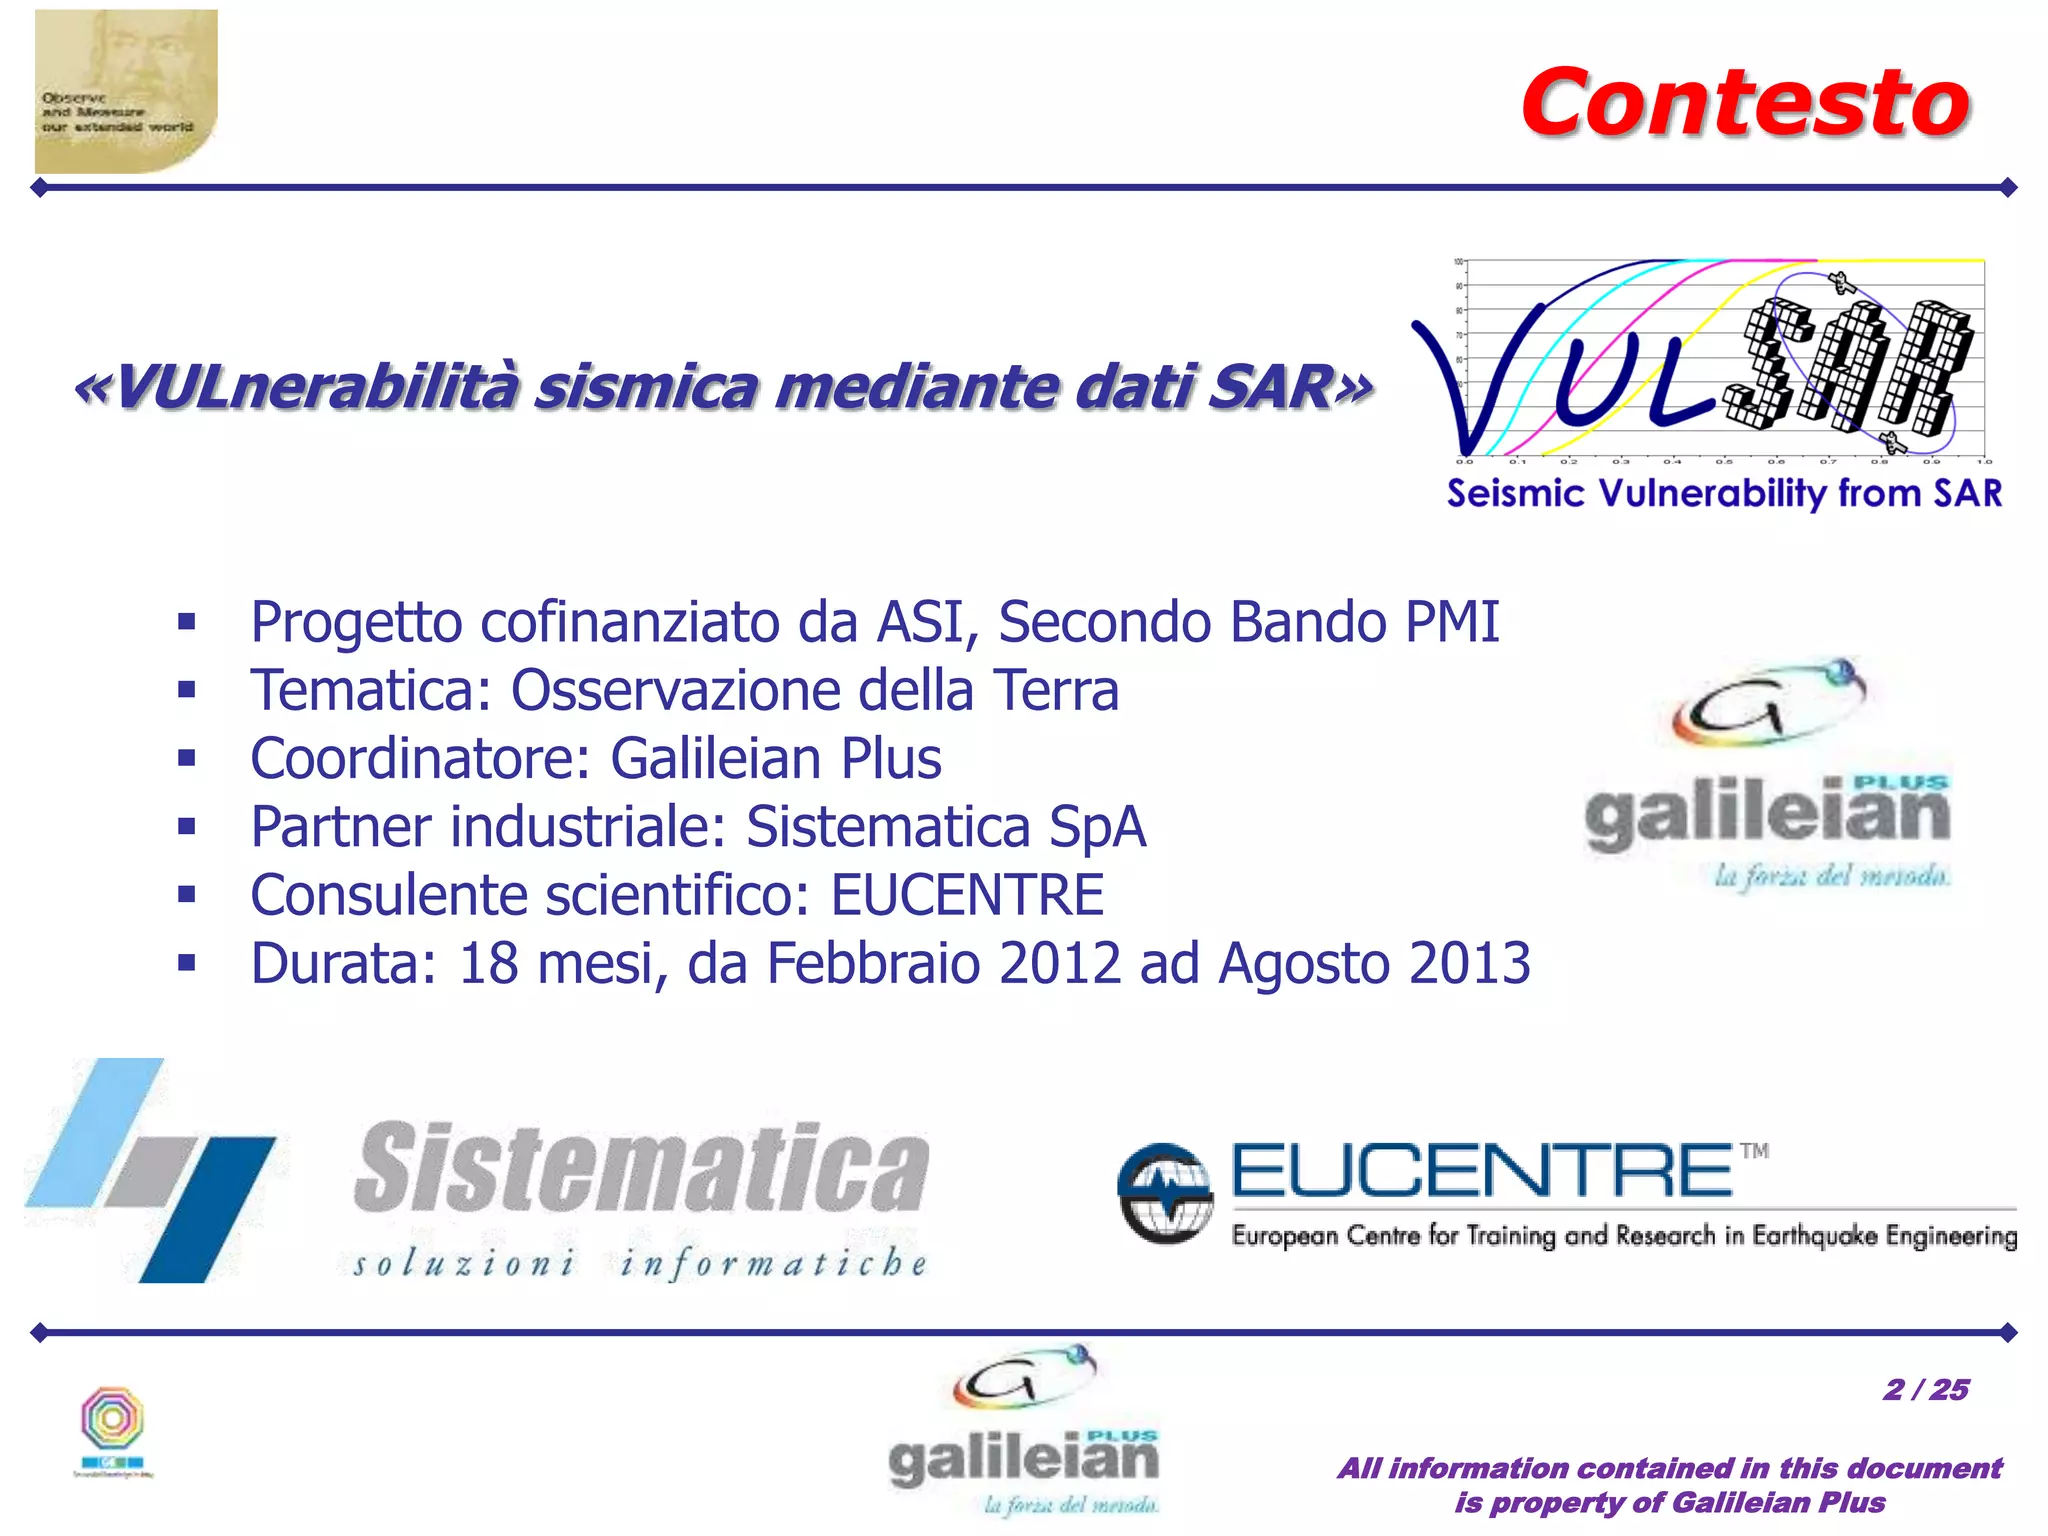

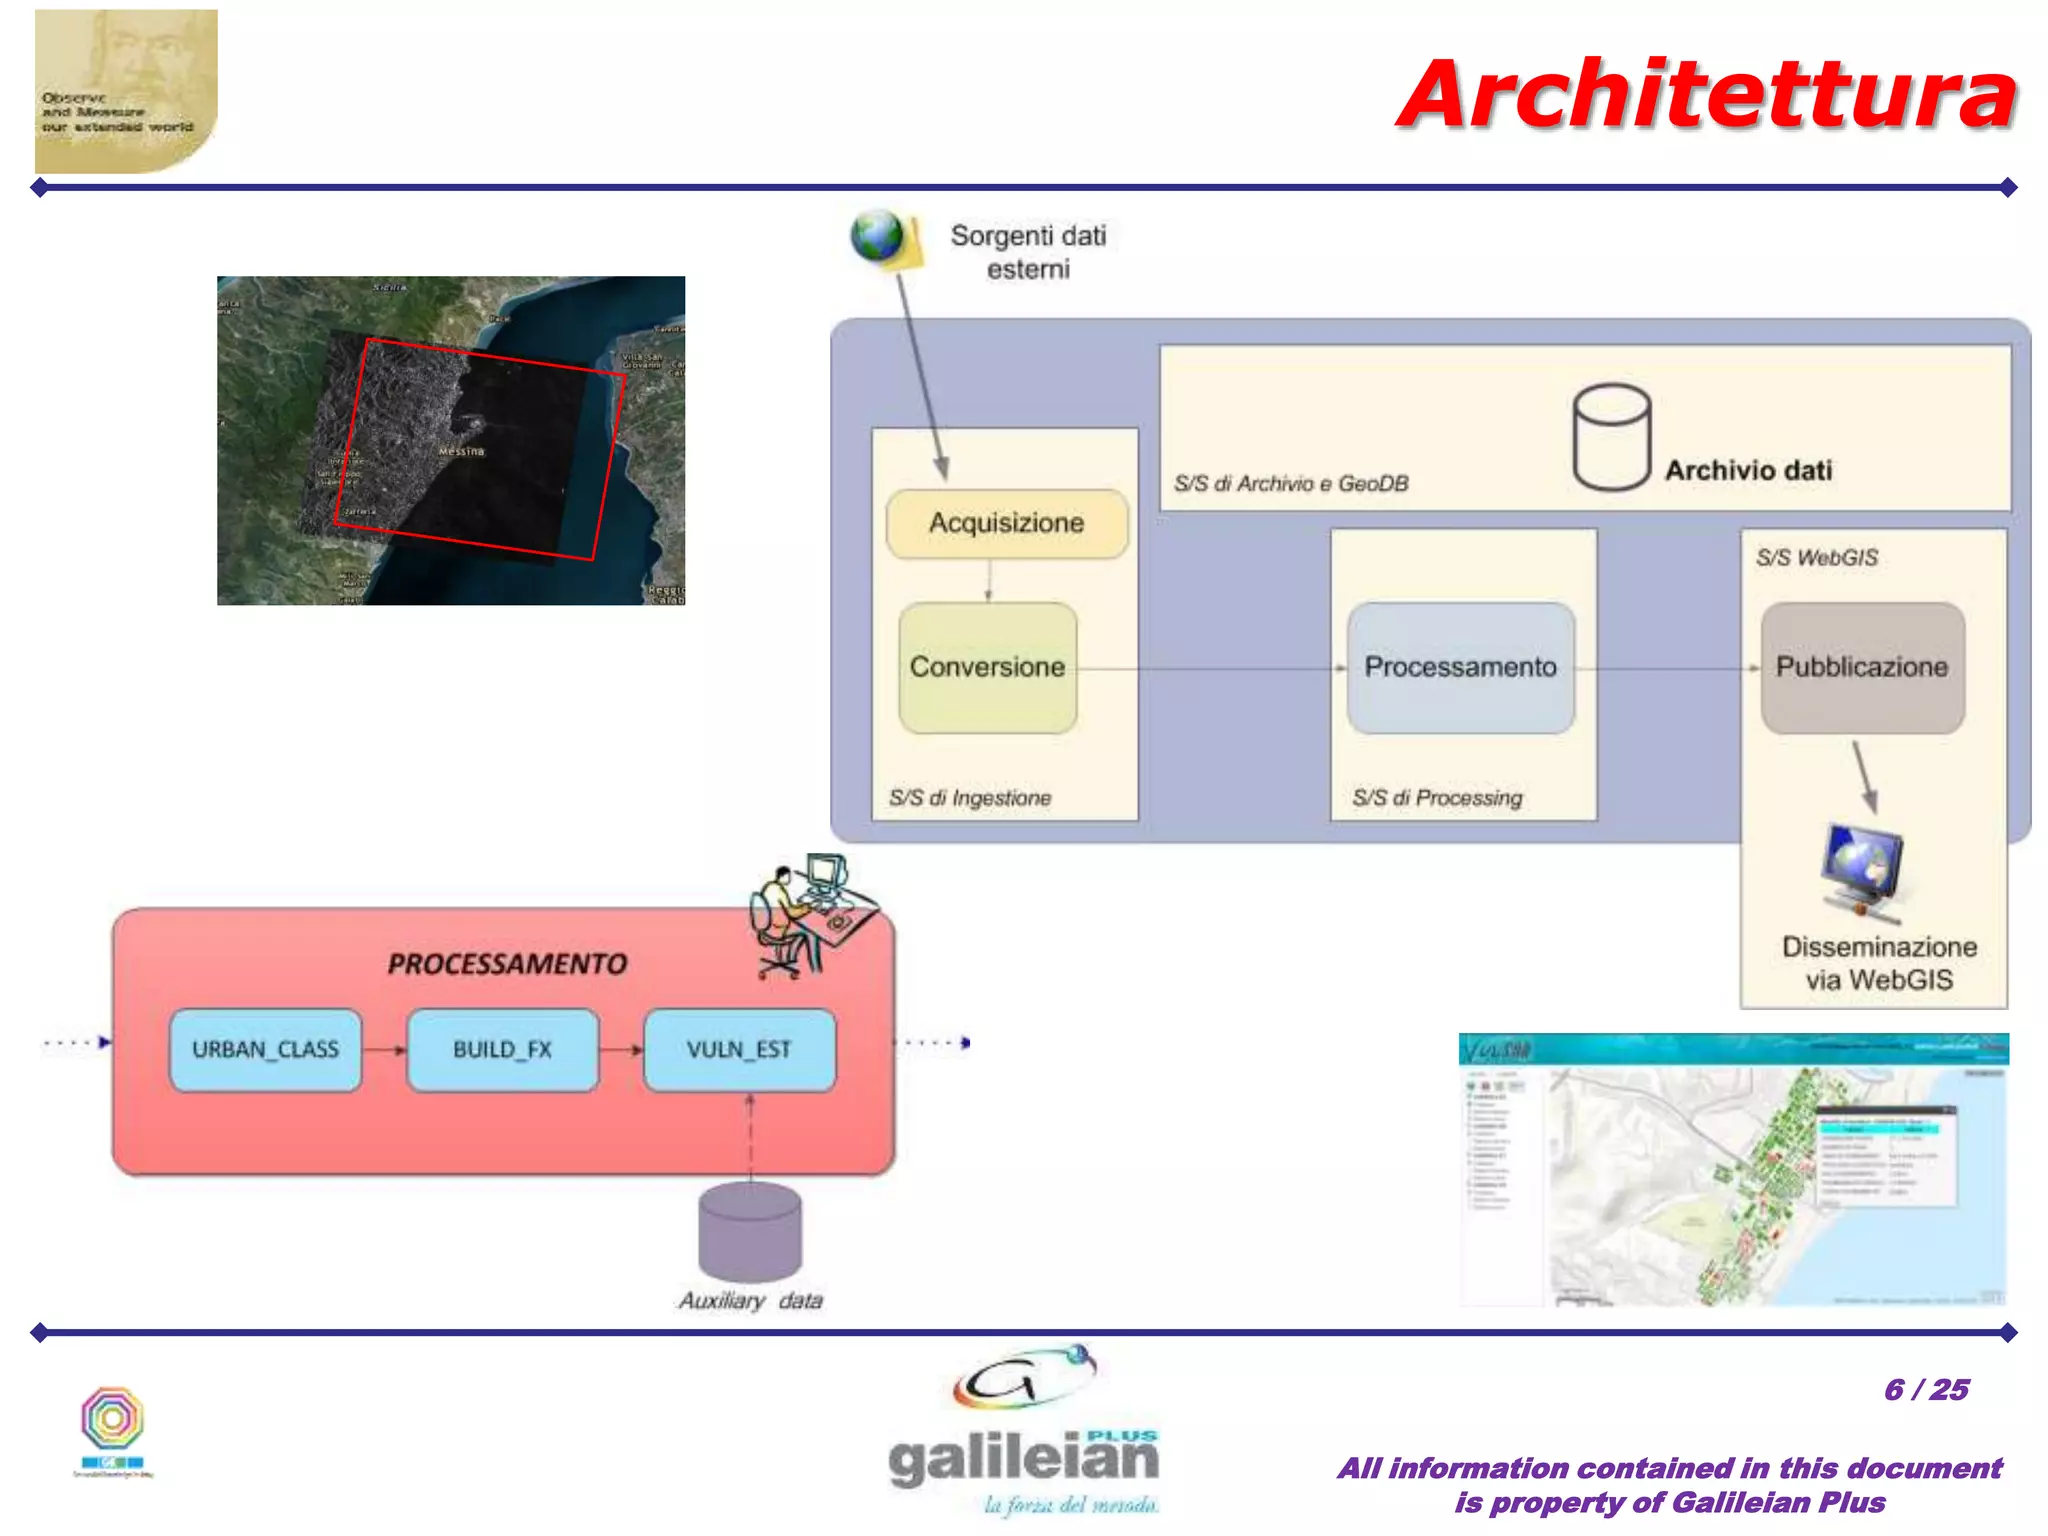
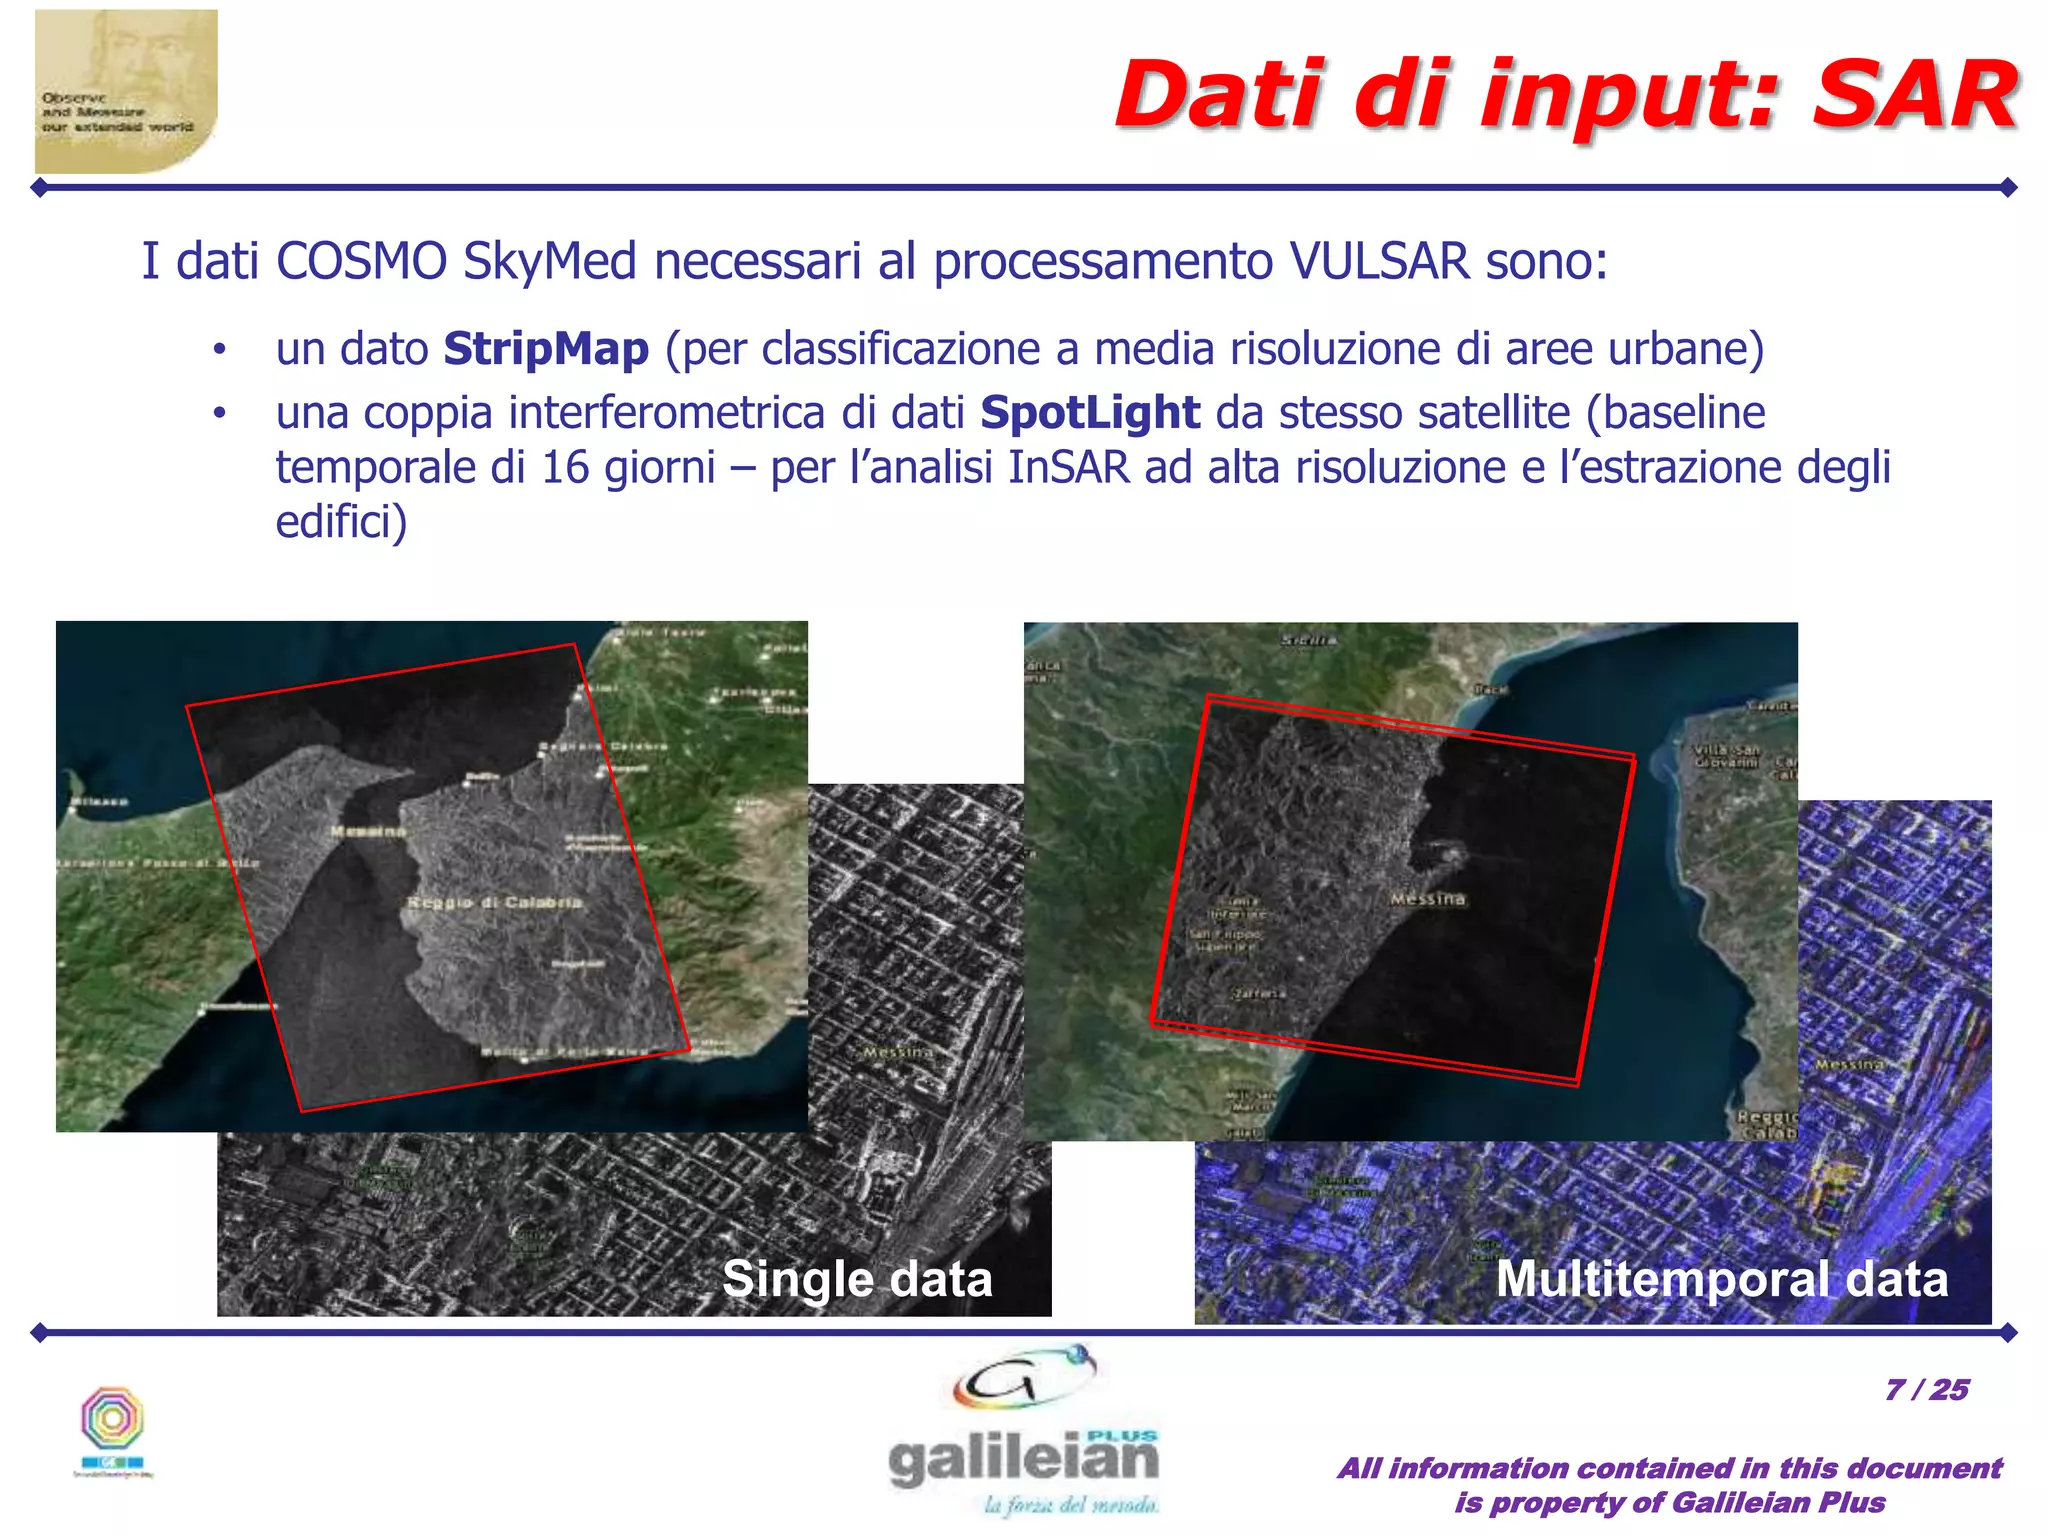
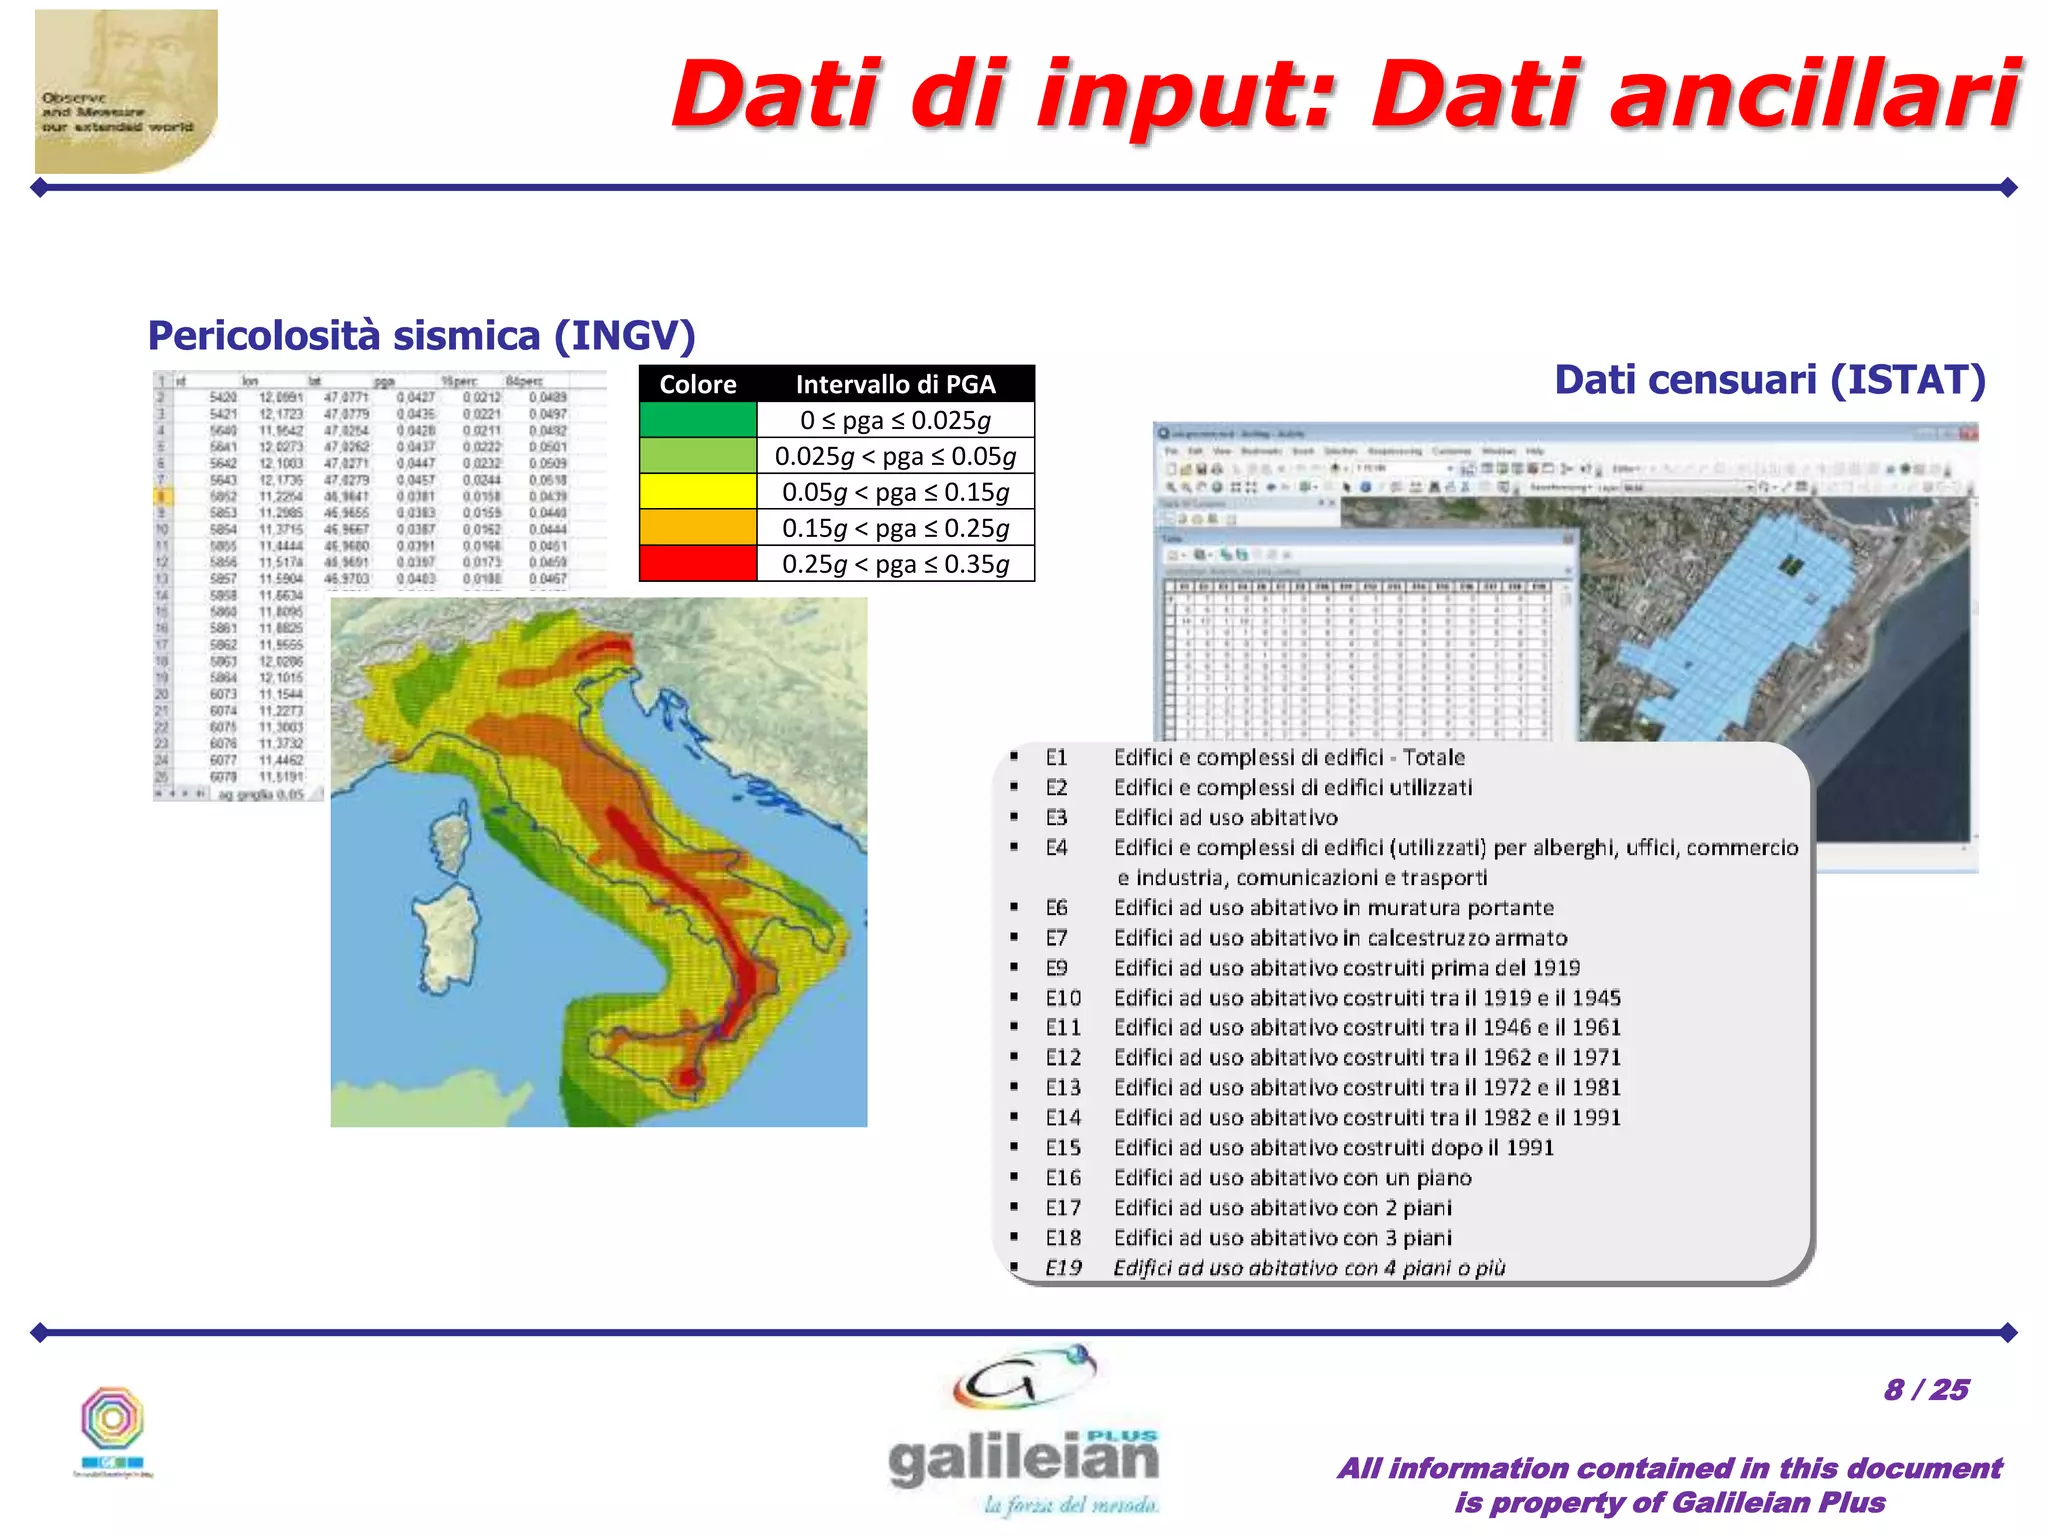
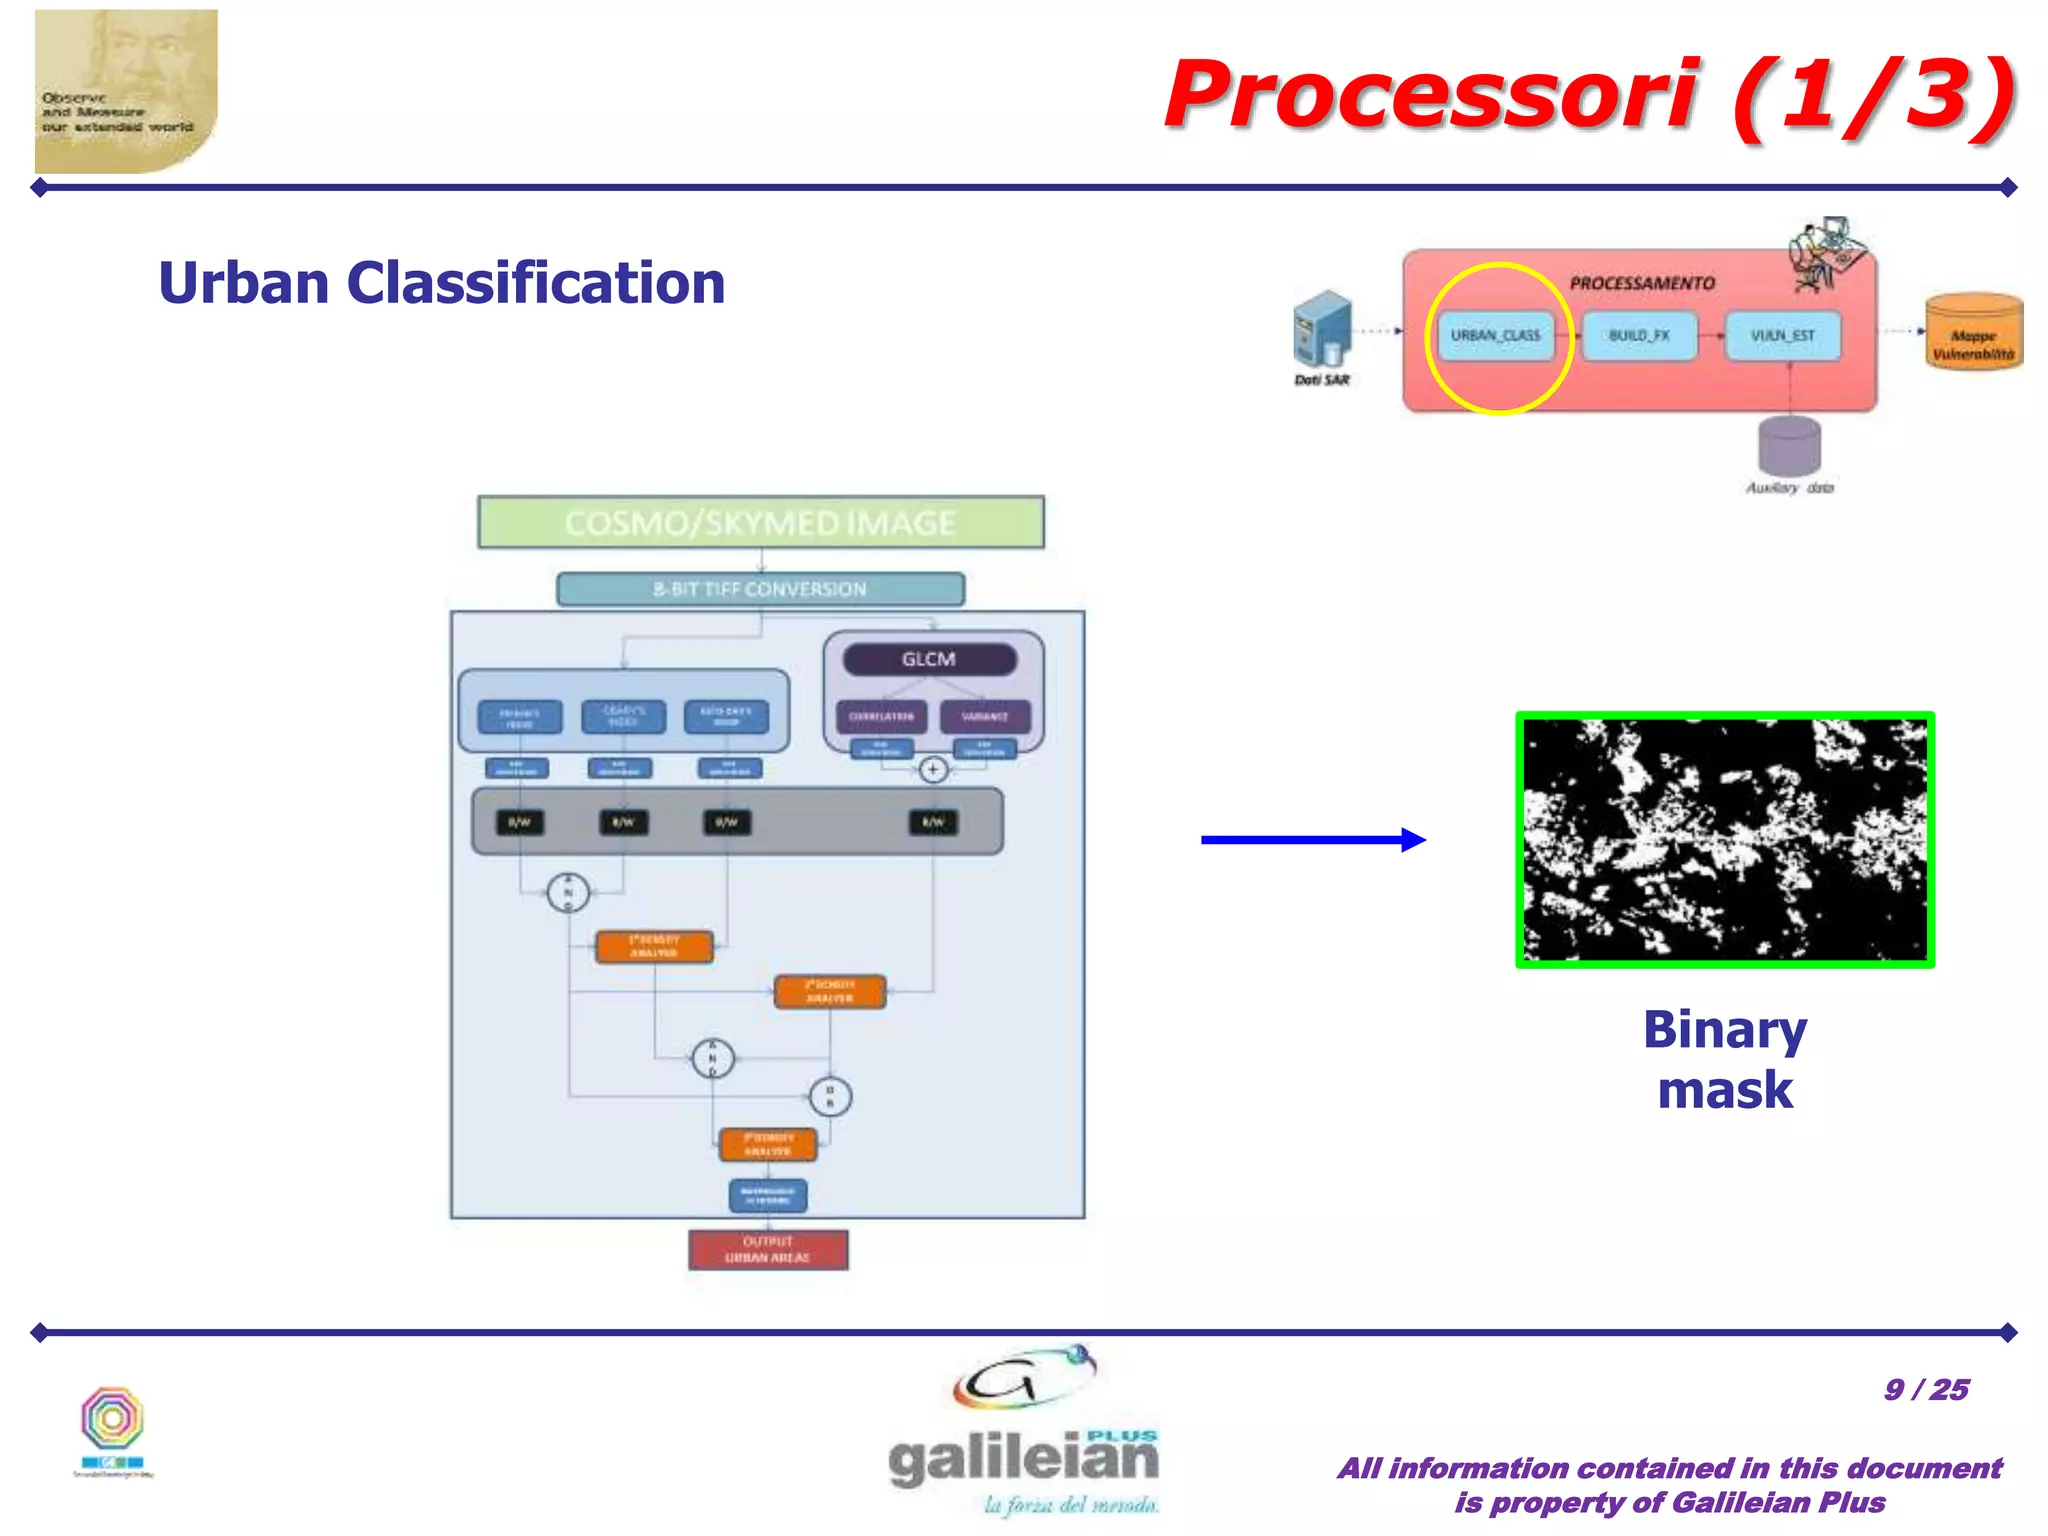
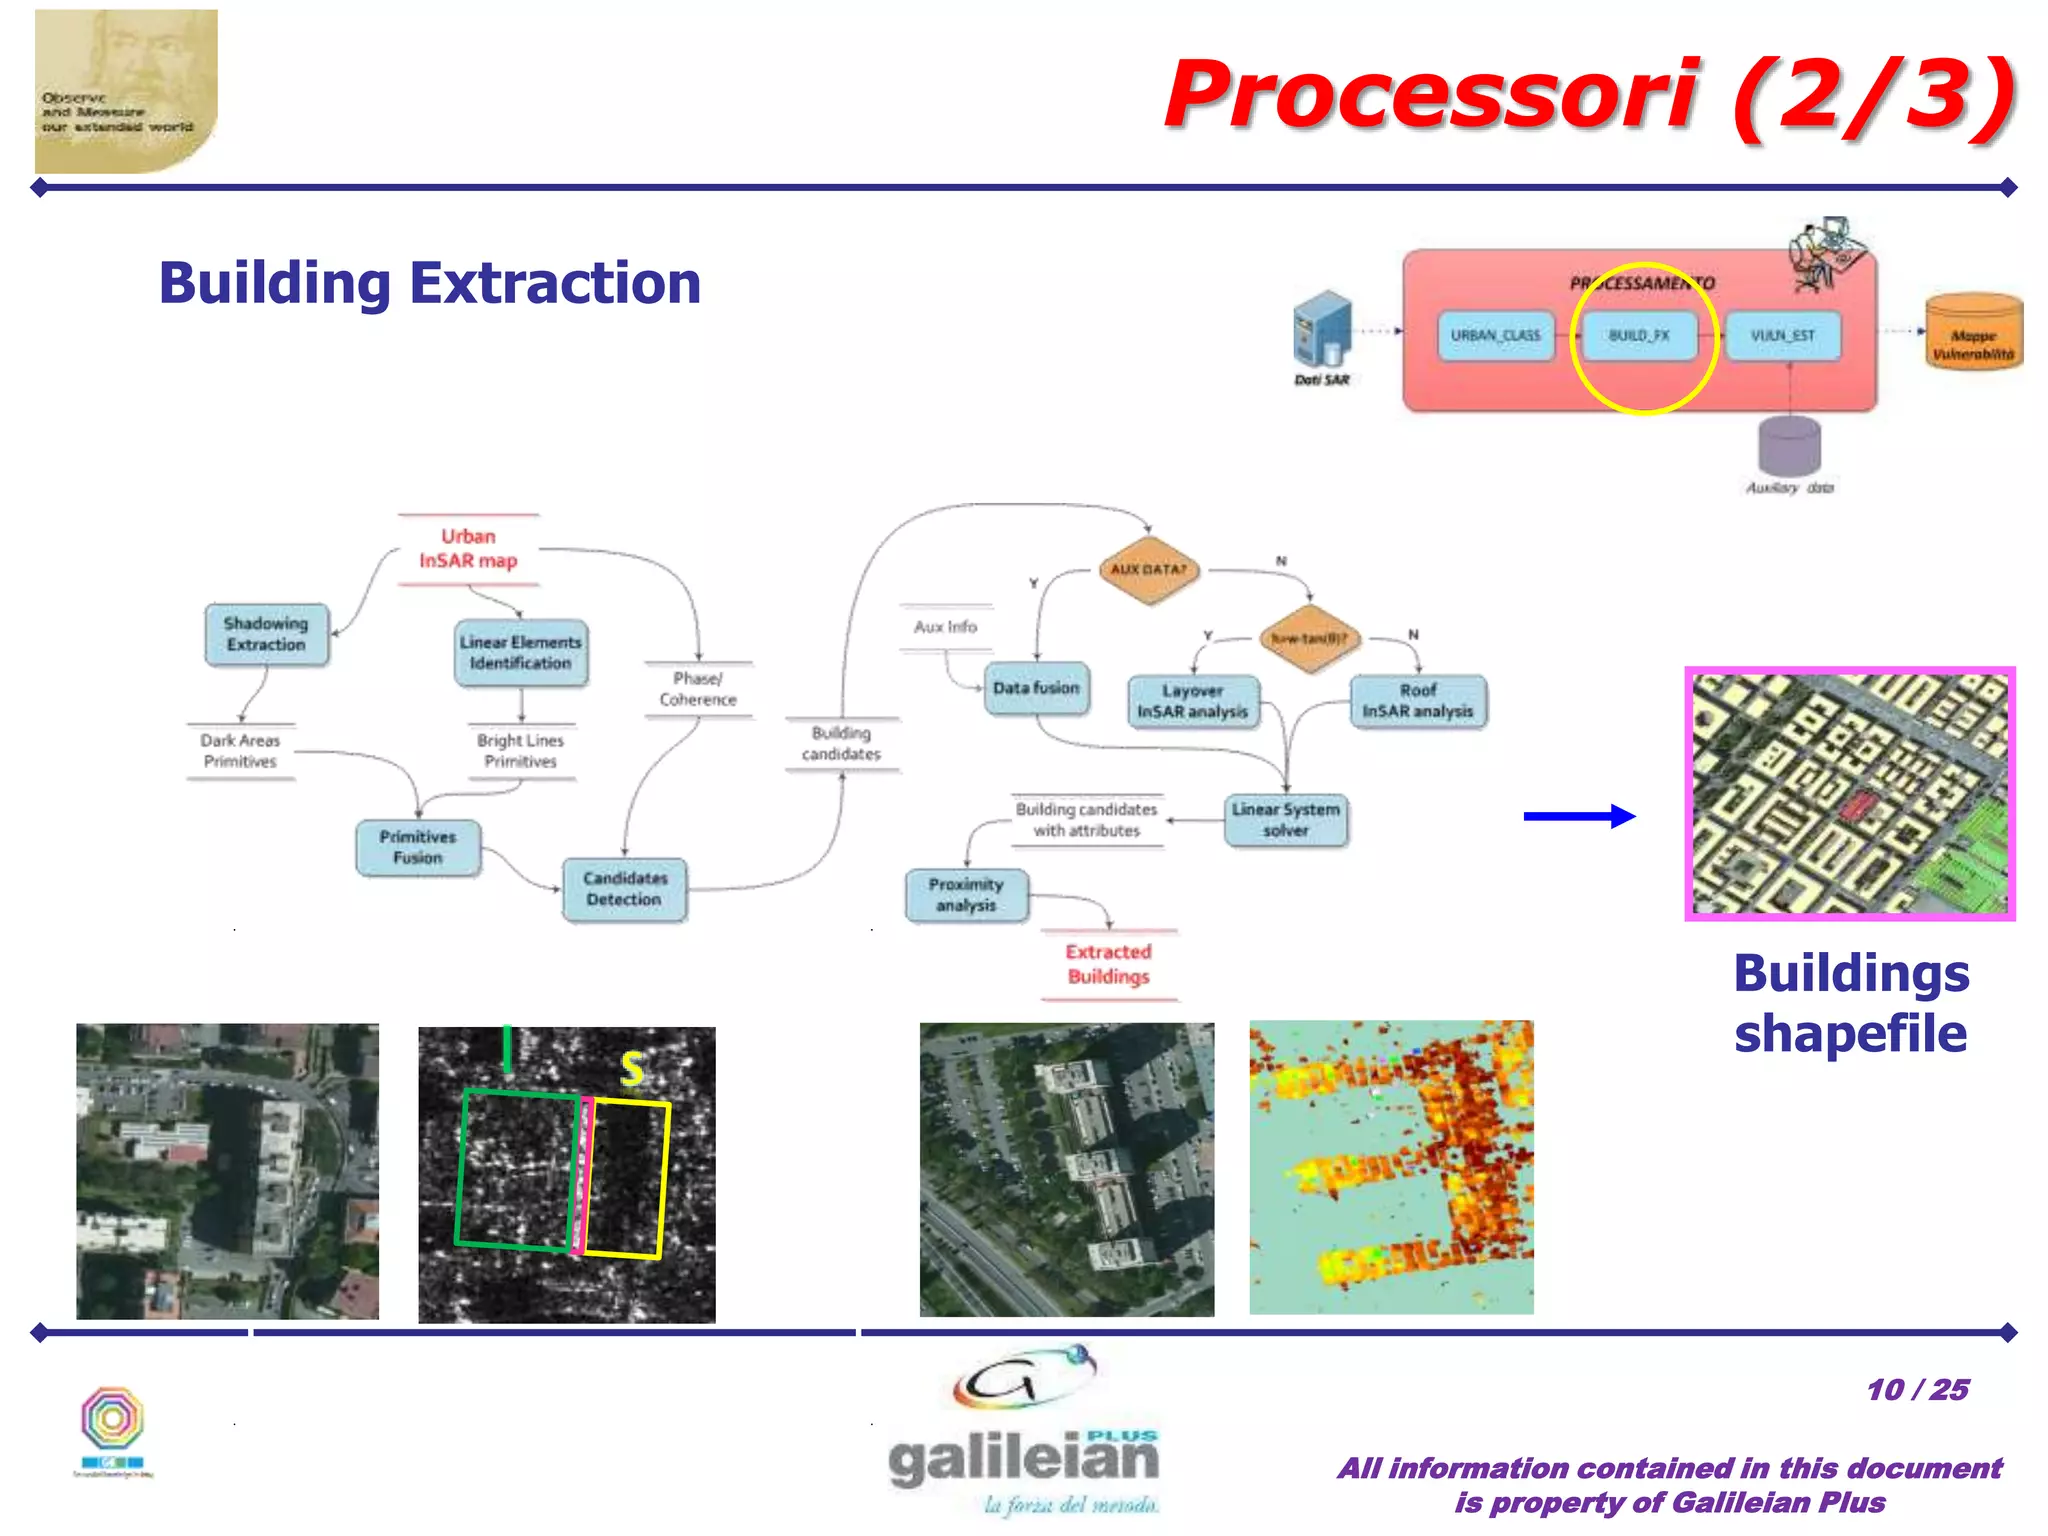

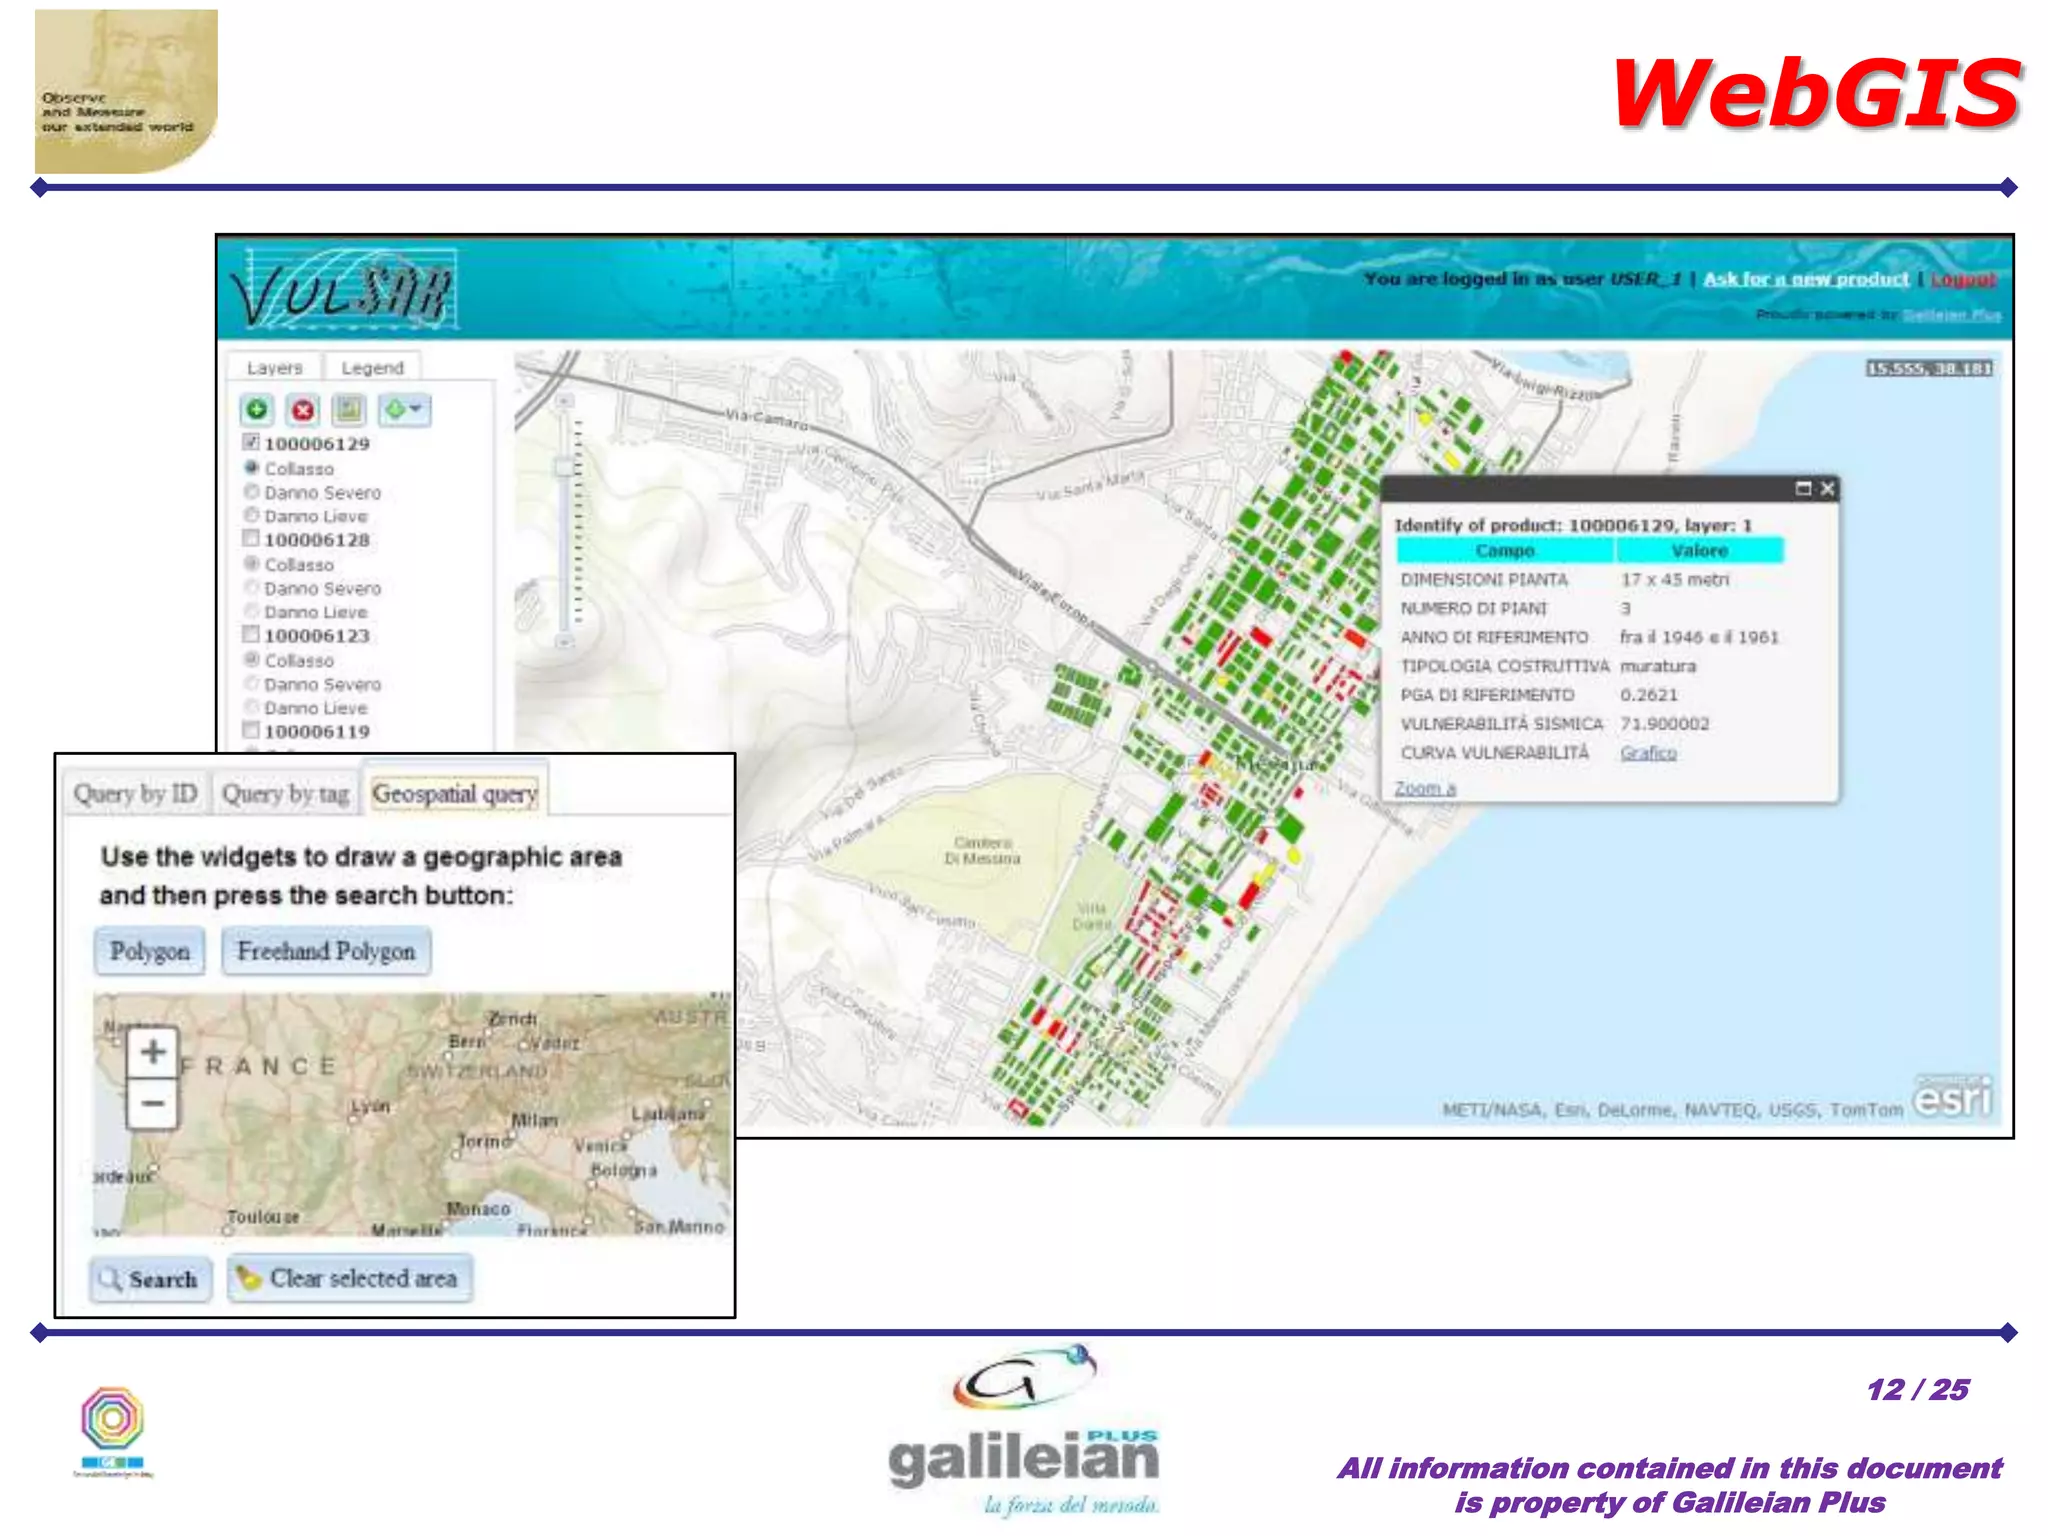
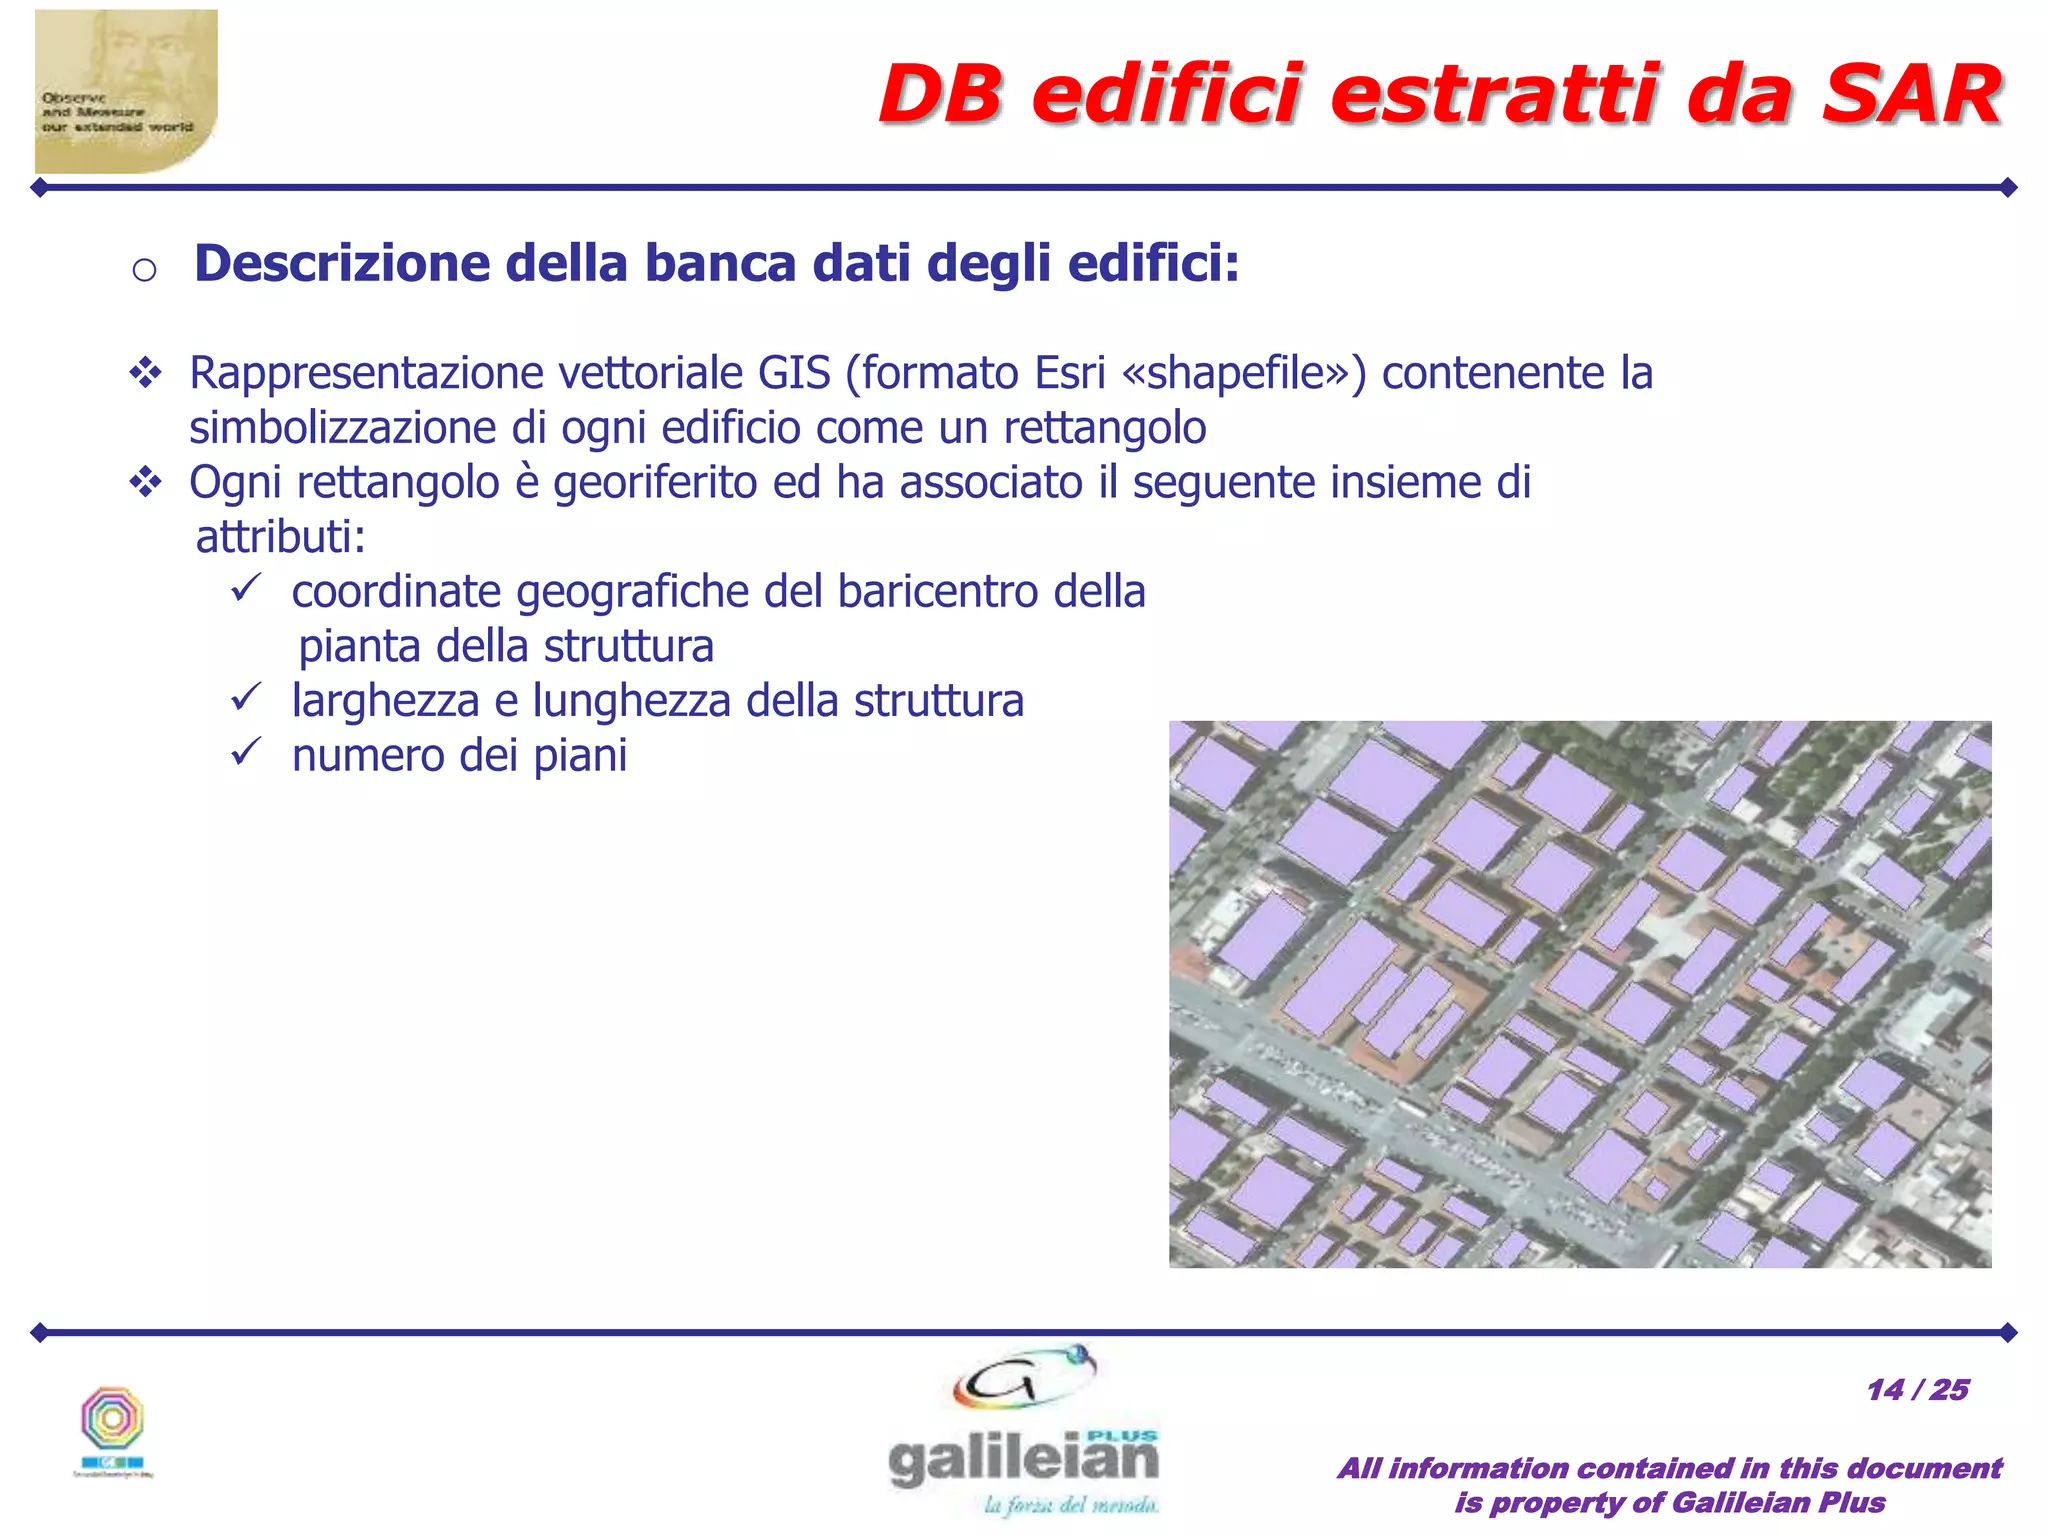
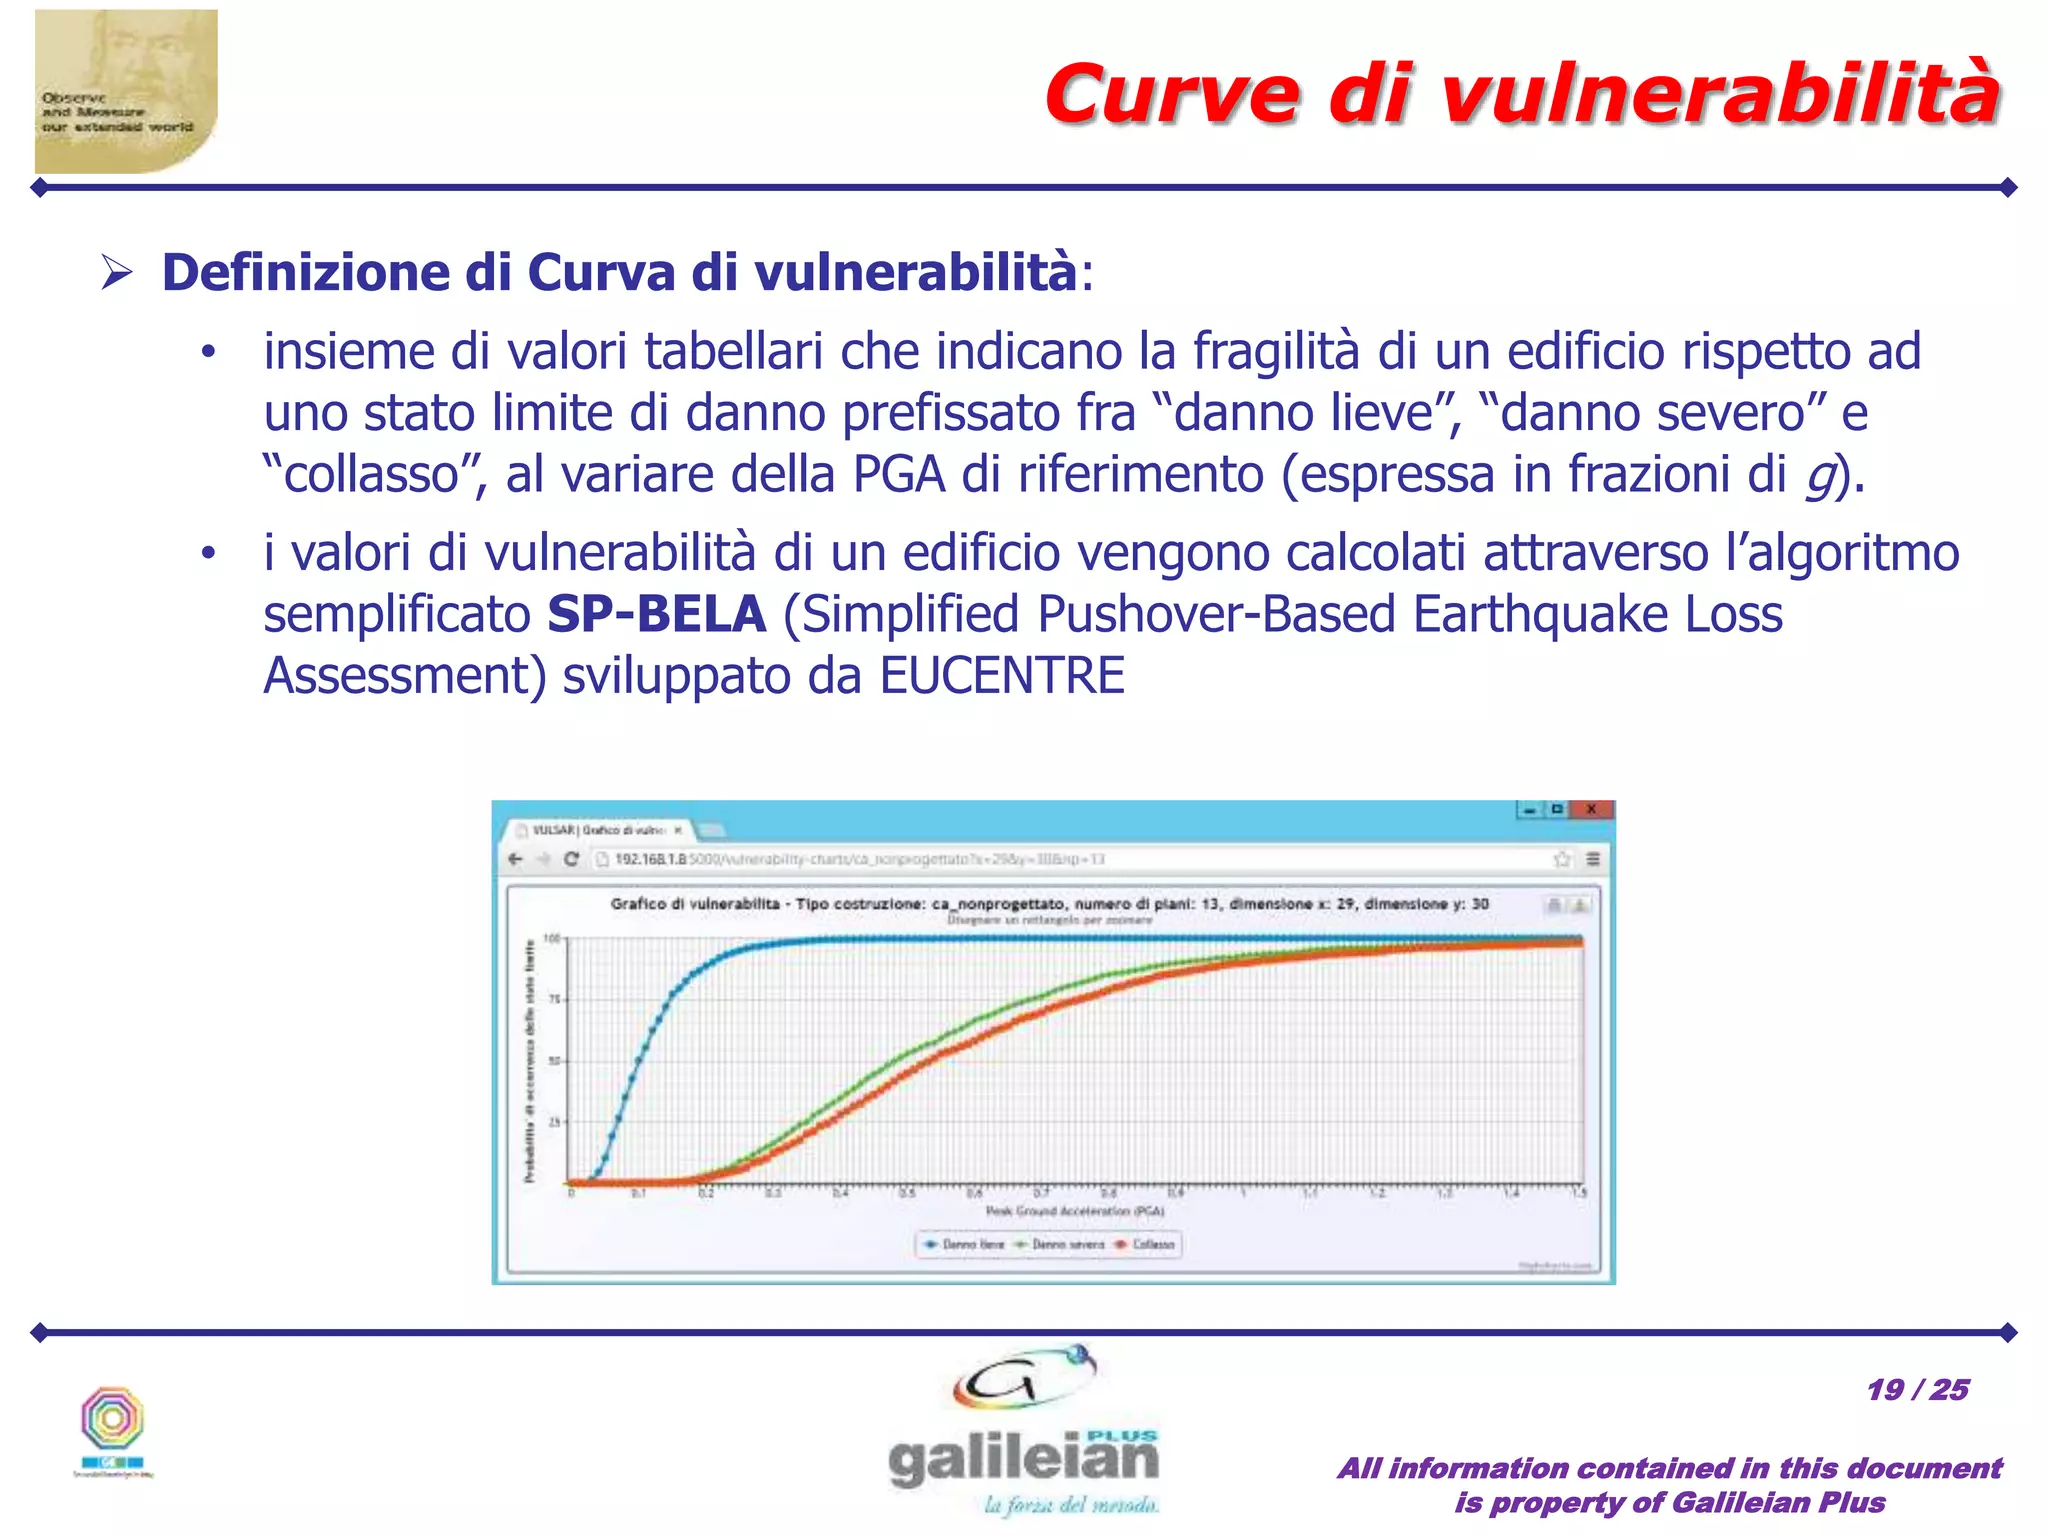
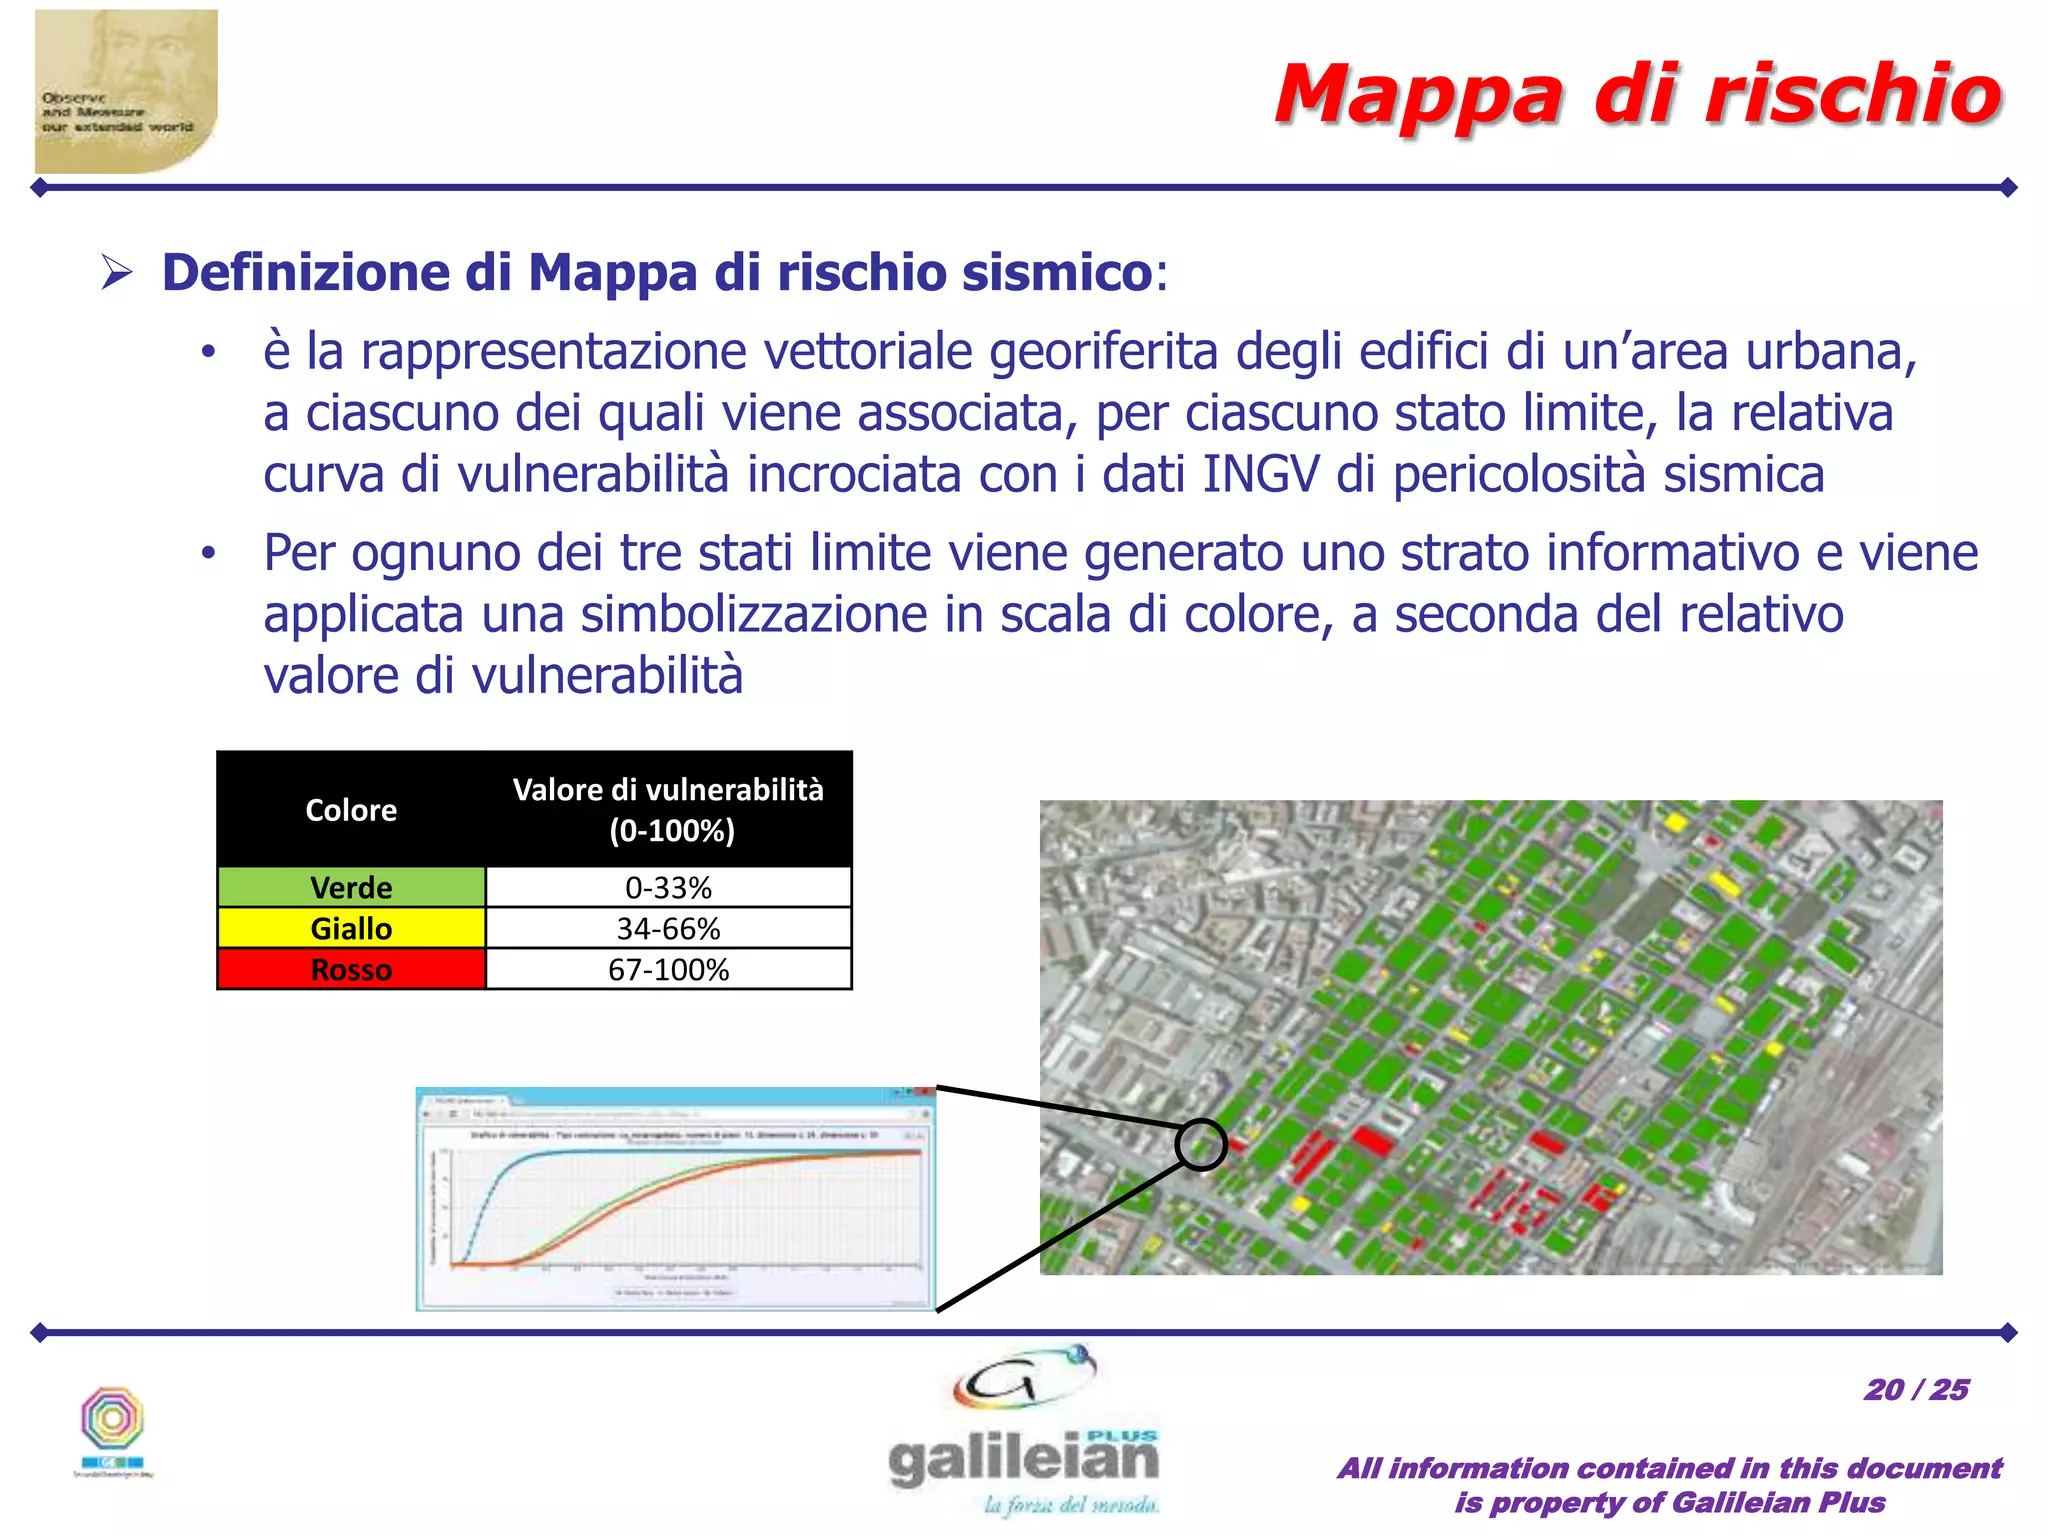
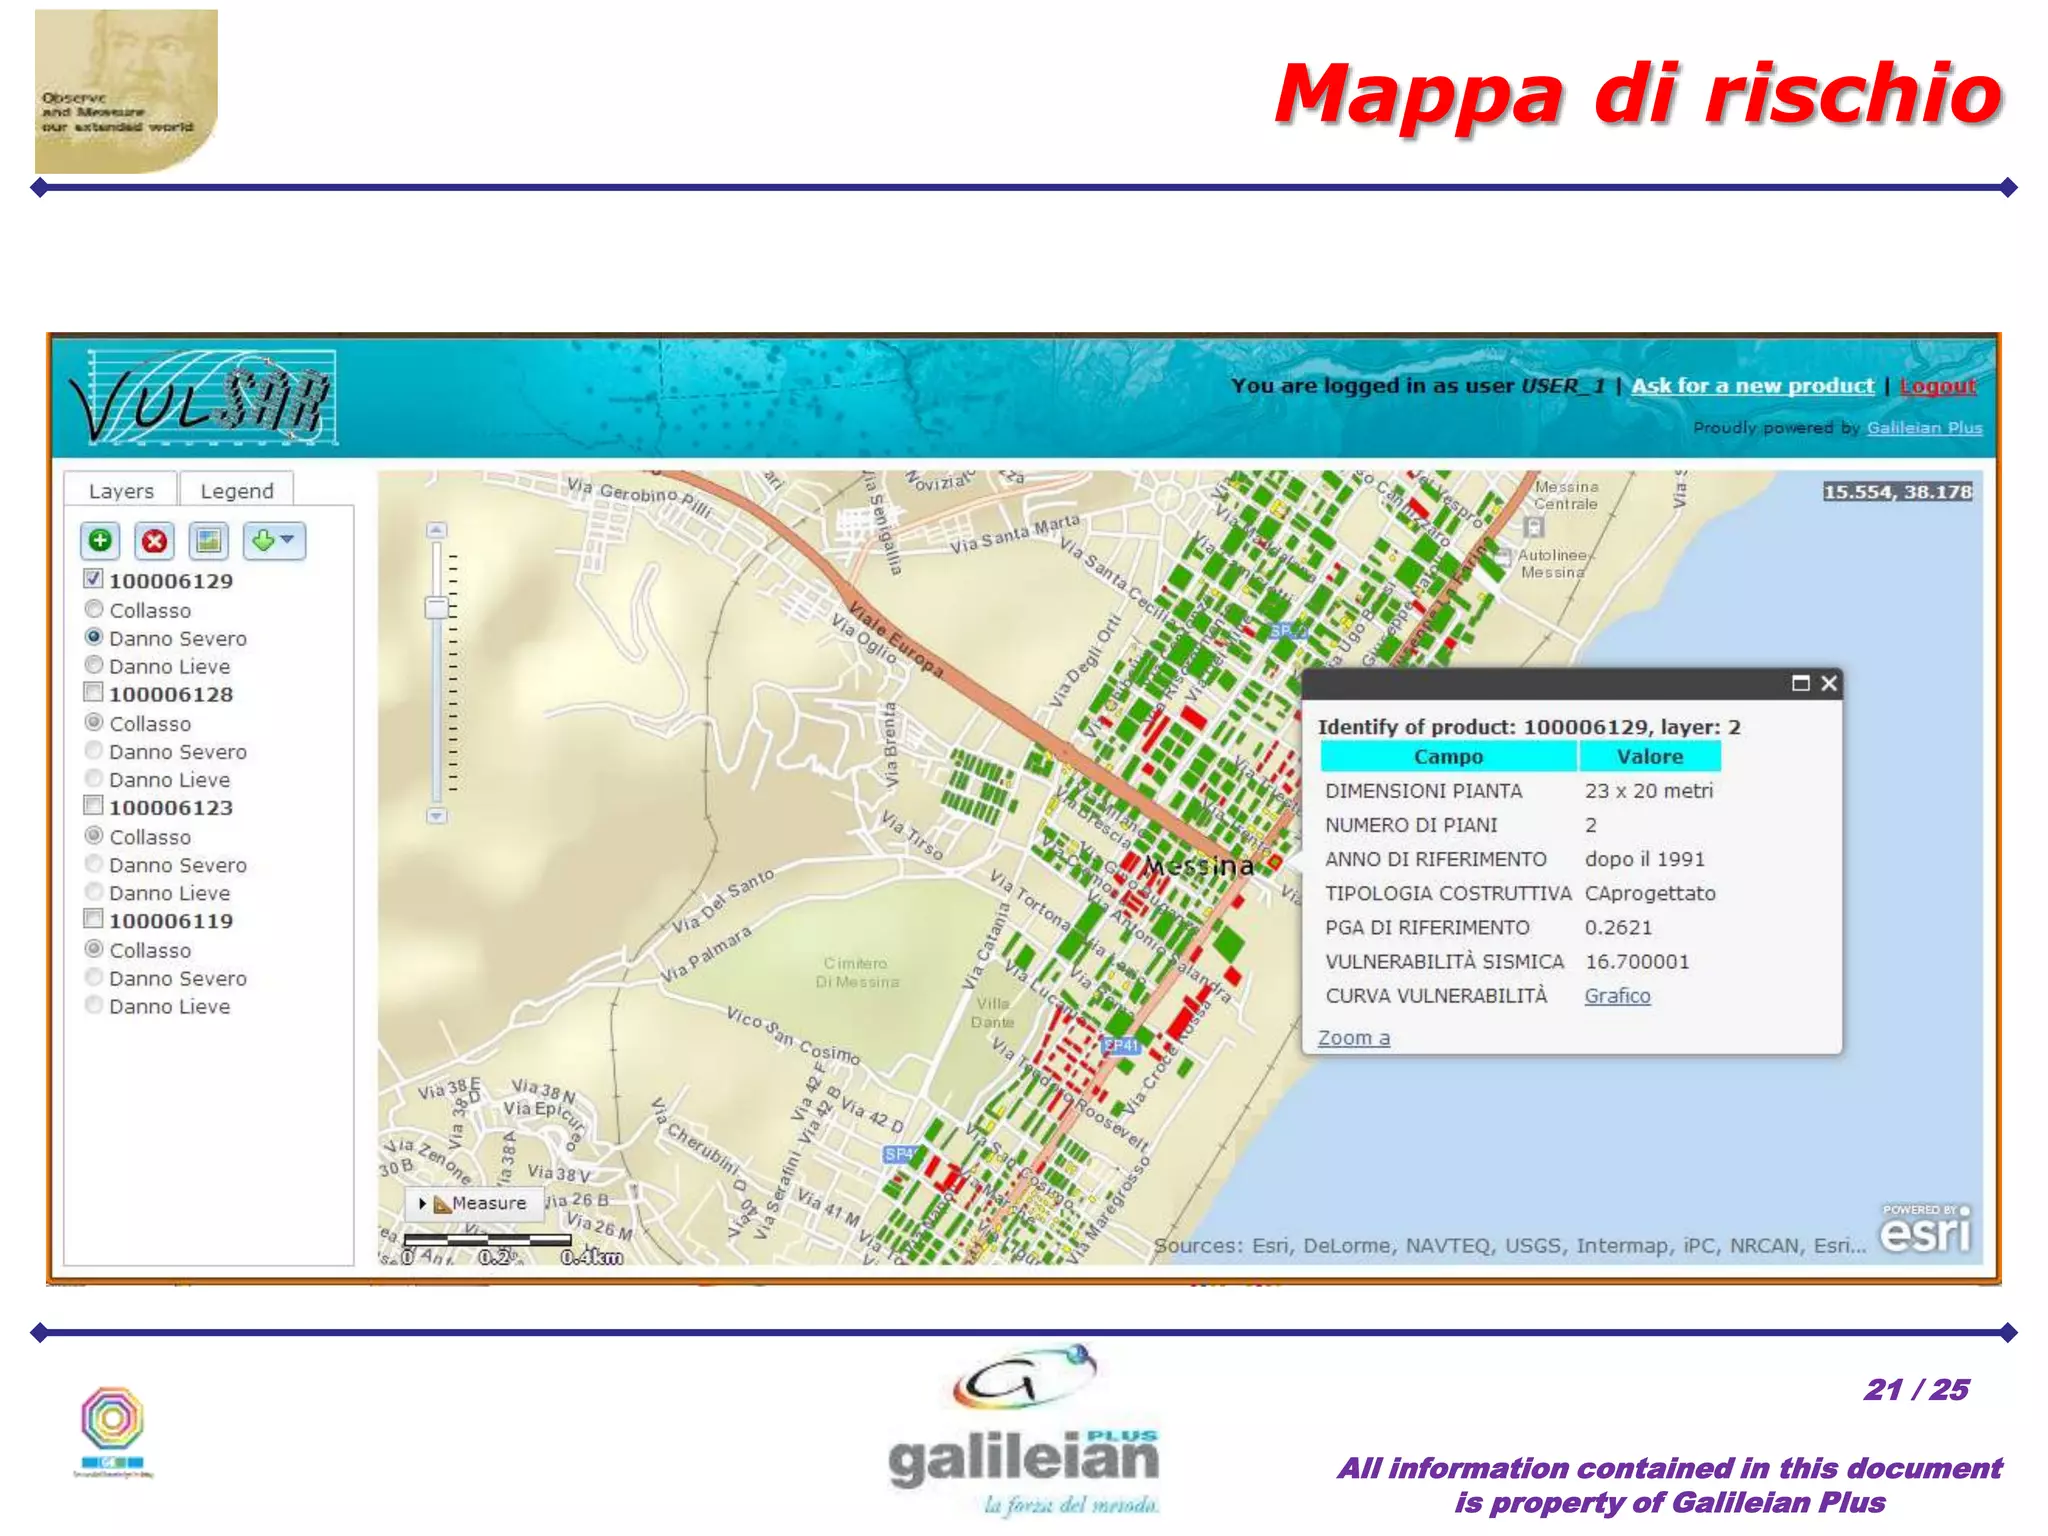
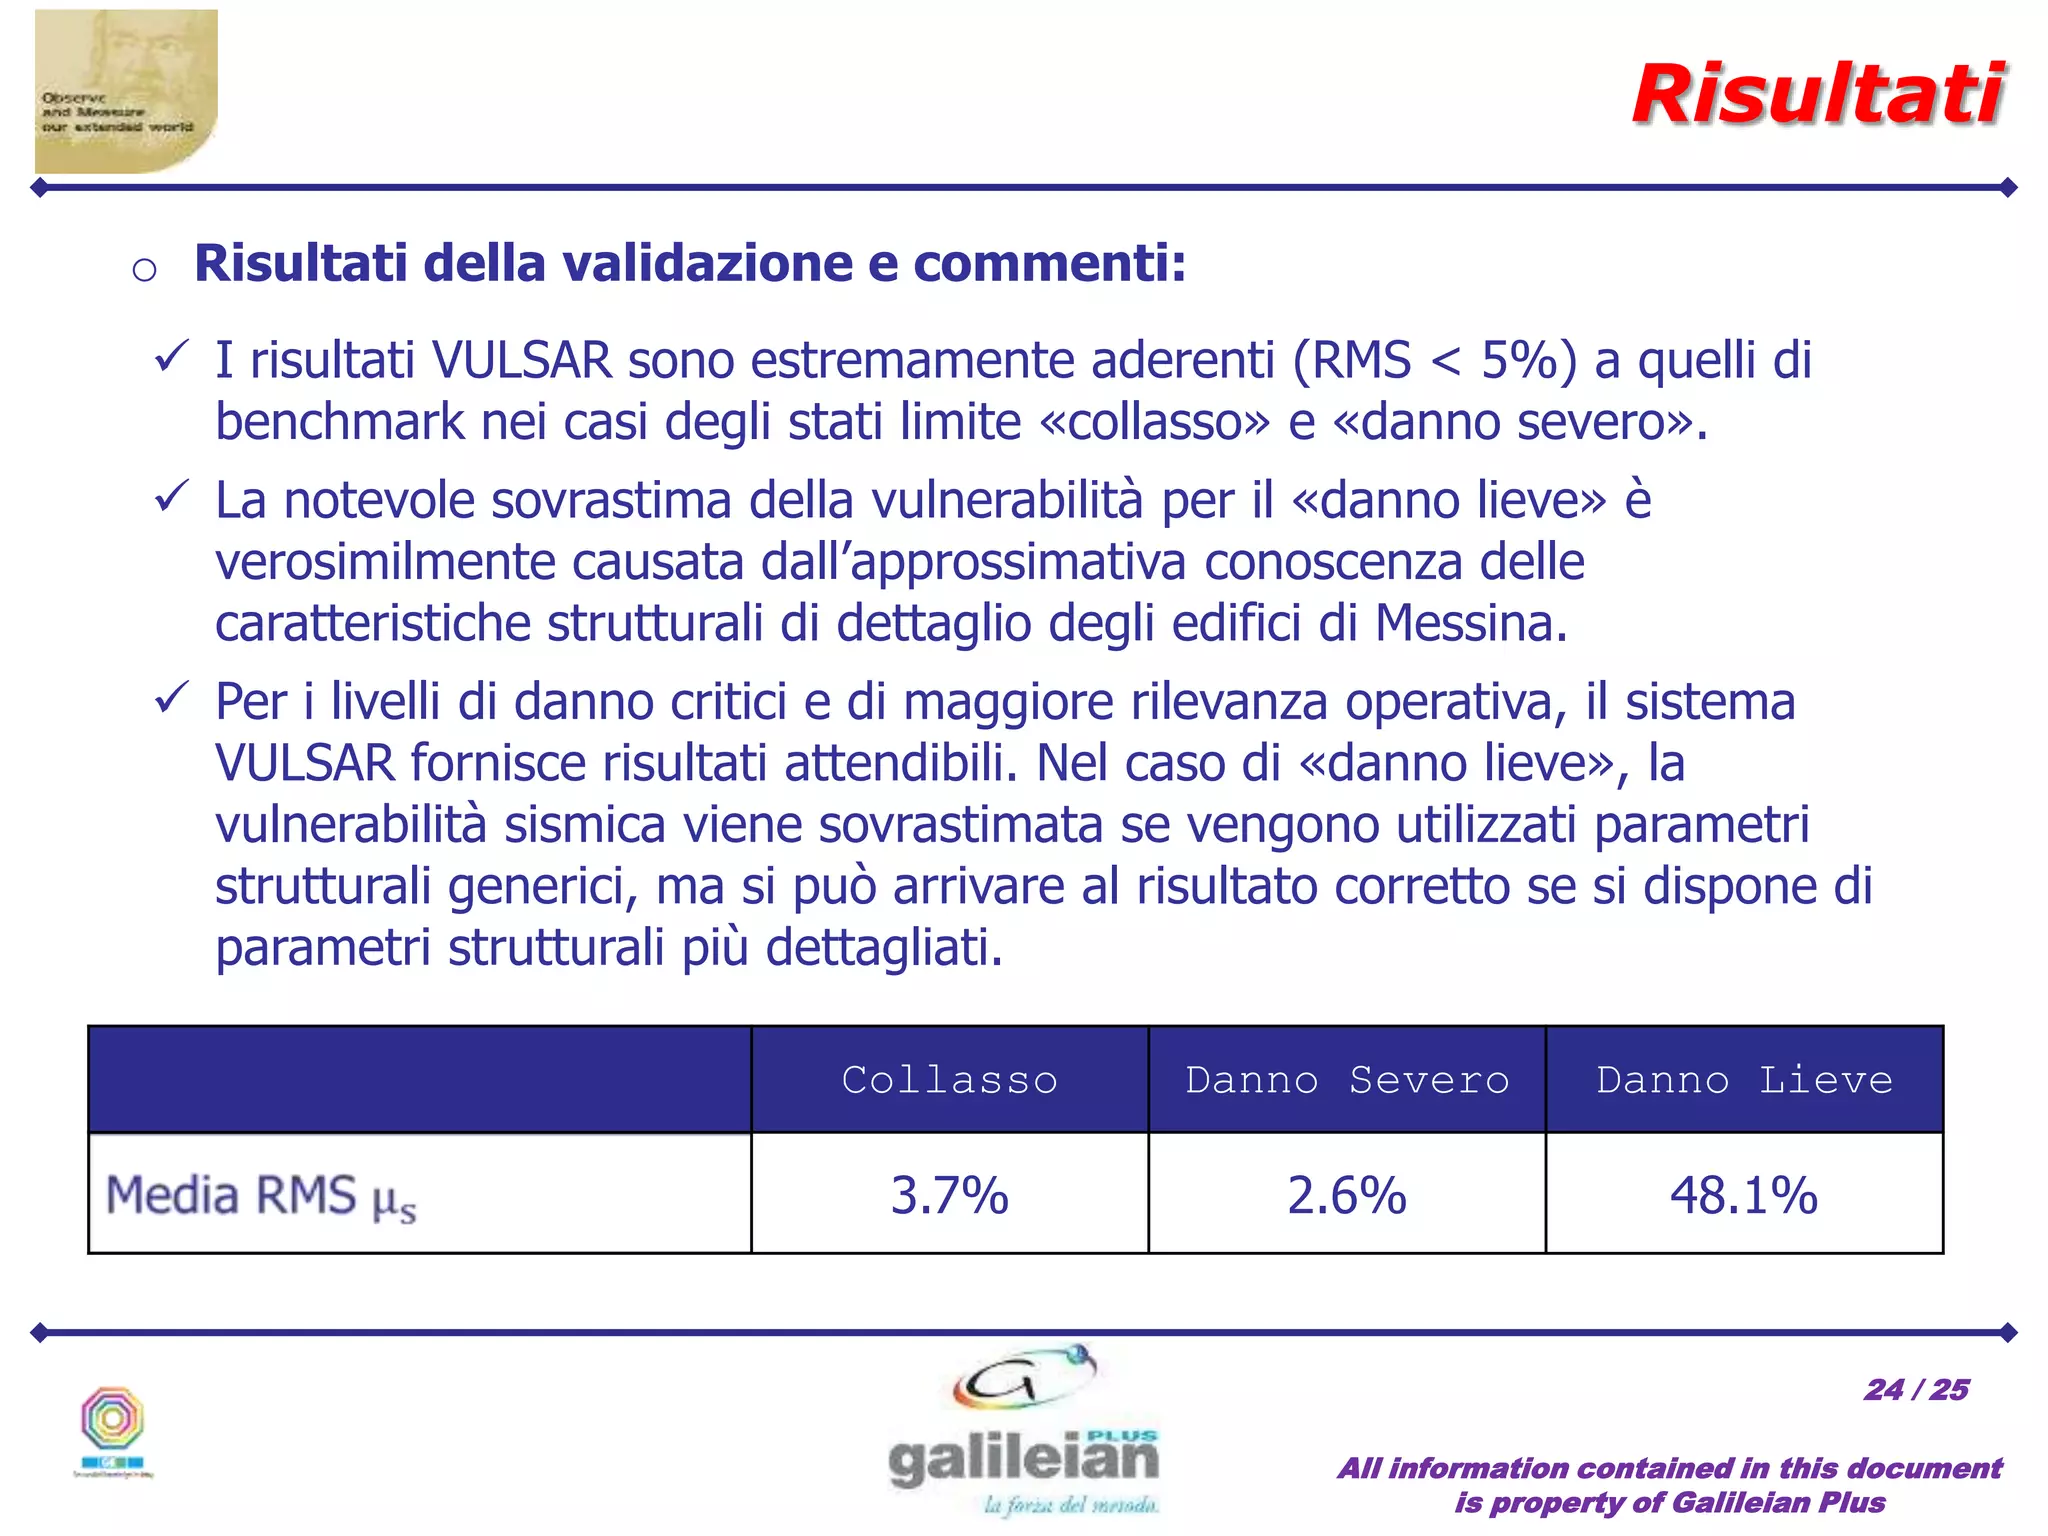

Il progetto Vulsar, cofinanziato da ASI, ha come obiettivo la generazione di curve di vulnerabilità sismica e mappe di rischio mediante l'analisi di dati SAR. Coordina l'iniziativa Galileian Plus in collaborazione con Sistematica S.p.A. ed Eucentre, utilizzando una fusione di dati e un algoritmo innovativo per valutare la vulnerabilità degli edifici. I risultati del progetto evidenziano una buona corrispondenza con studi di benchmark, sebbene si registrino alcune sovrastime nella vulnerabilità per danni lievi.