Download to read offline


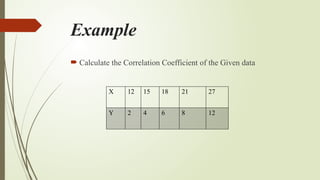
![Coefficient of Correlation
𝑟 =
𝑛(∑ 𝑥𝑦 )−(∑ 𝑥)(∑ 𝑦 )
√[𝑛∑ 𝑥2
¿− (∑ 𝑥 )
2
][𝑛∑ 𝑦2
−(∑ 𝑦 )
2
]¿](https://image.slidesharecdn.com/correlation-250826123156-f1ef16c3/85/Correlation-Explained-with-Examples-Types-Methods-Karl-Pearson-s-Coefficient-9-320.jpg)
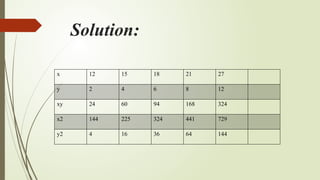
![ Formula:
Putting values in the equation.
84
.
0
)
296
)(
666
(
374
)
1024
1320
)(
8649
9315
(
2976
3350
)
32
(
)
264
(
5
)
93
(
)
1863
(
5
)
32
)(
93
(
)
670
(
5
2
2
r
r
r
r
𝑟 =
𝑛 (∑ 𝑥𝑦 )−(∑ 𝑥)(∑ 𝑦 )
√[𝑛∑ 𝑥
2
¿− (∑ 𝑥 )
2
][𝑛∑ 𝑦
2
−(∑ 𝑦 )
2
]¿](https://image.slidesharecdn.com/correlation-250826123156-f1ef16c3/85/Correlation-Explained-with-Examples-Types-Methods-Karl-Pearson-s-Coefficient-18-320.jpg)


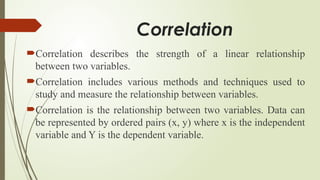
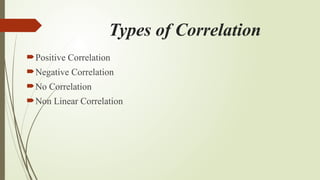
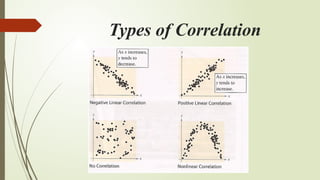
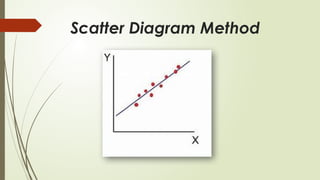
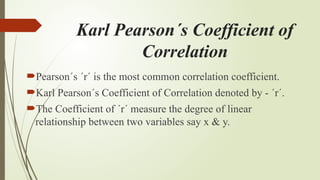
Learn the concept of correlation in statistics with clear examples and easy methods. This presentation covers types of correlation, Karl Pearson's coefficient, scatter diagram method, and properties of correlation. Perfect for students, researchers, and data enthusiasts who want to understand the strength of relationships between variables. Download, study, and share for better learning!