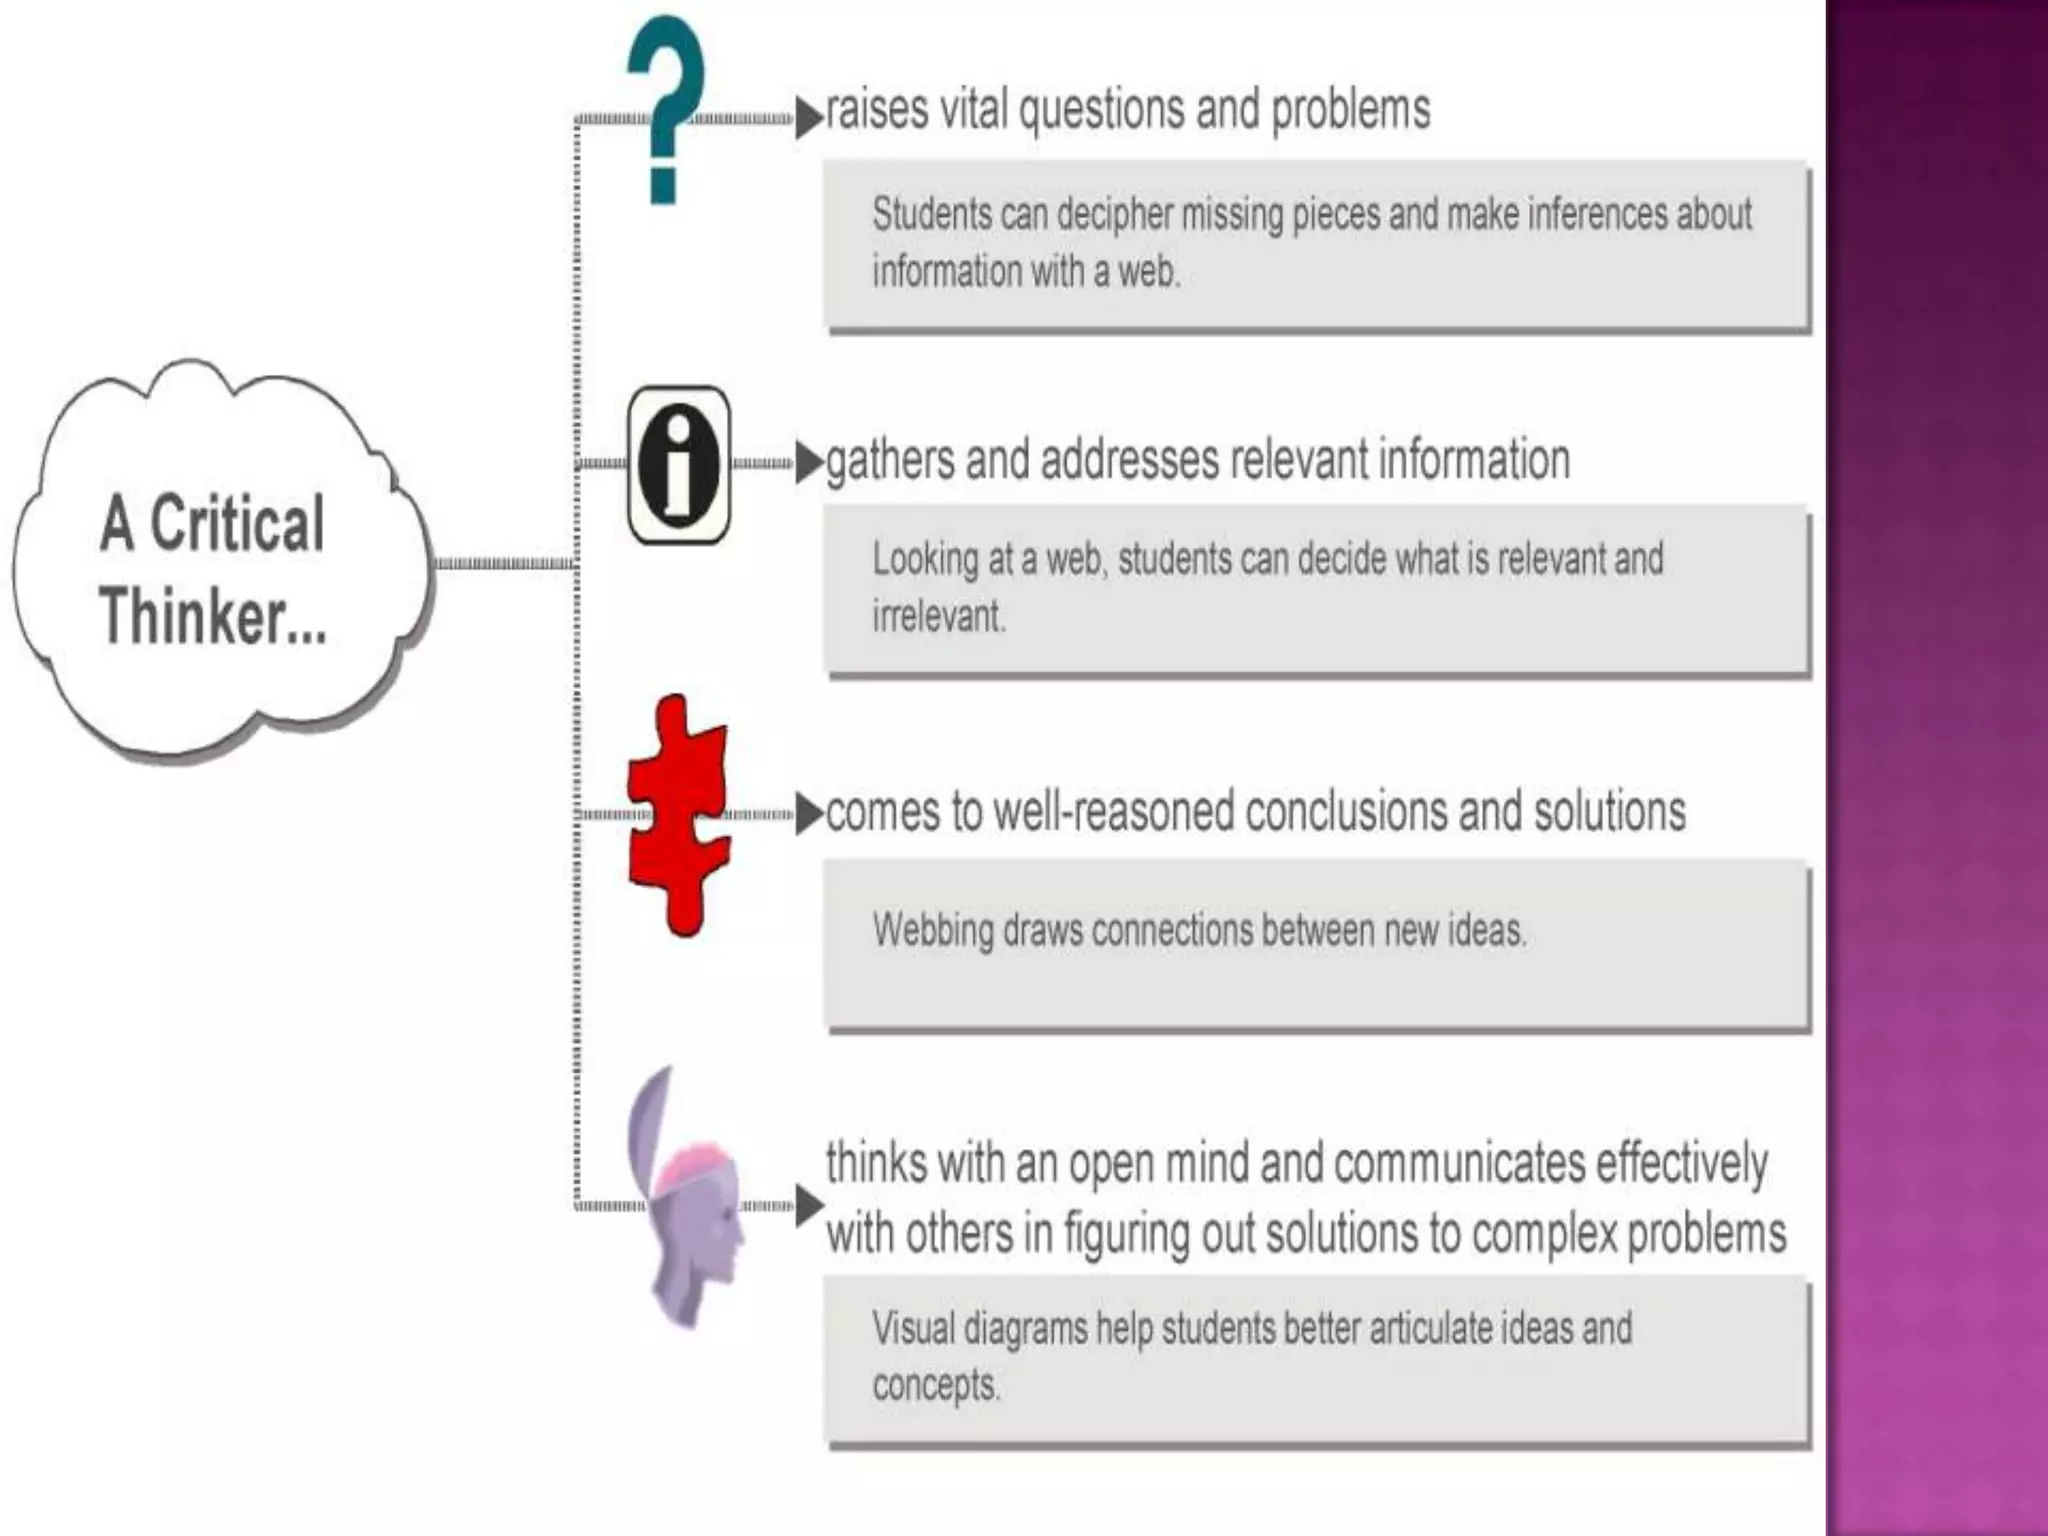
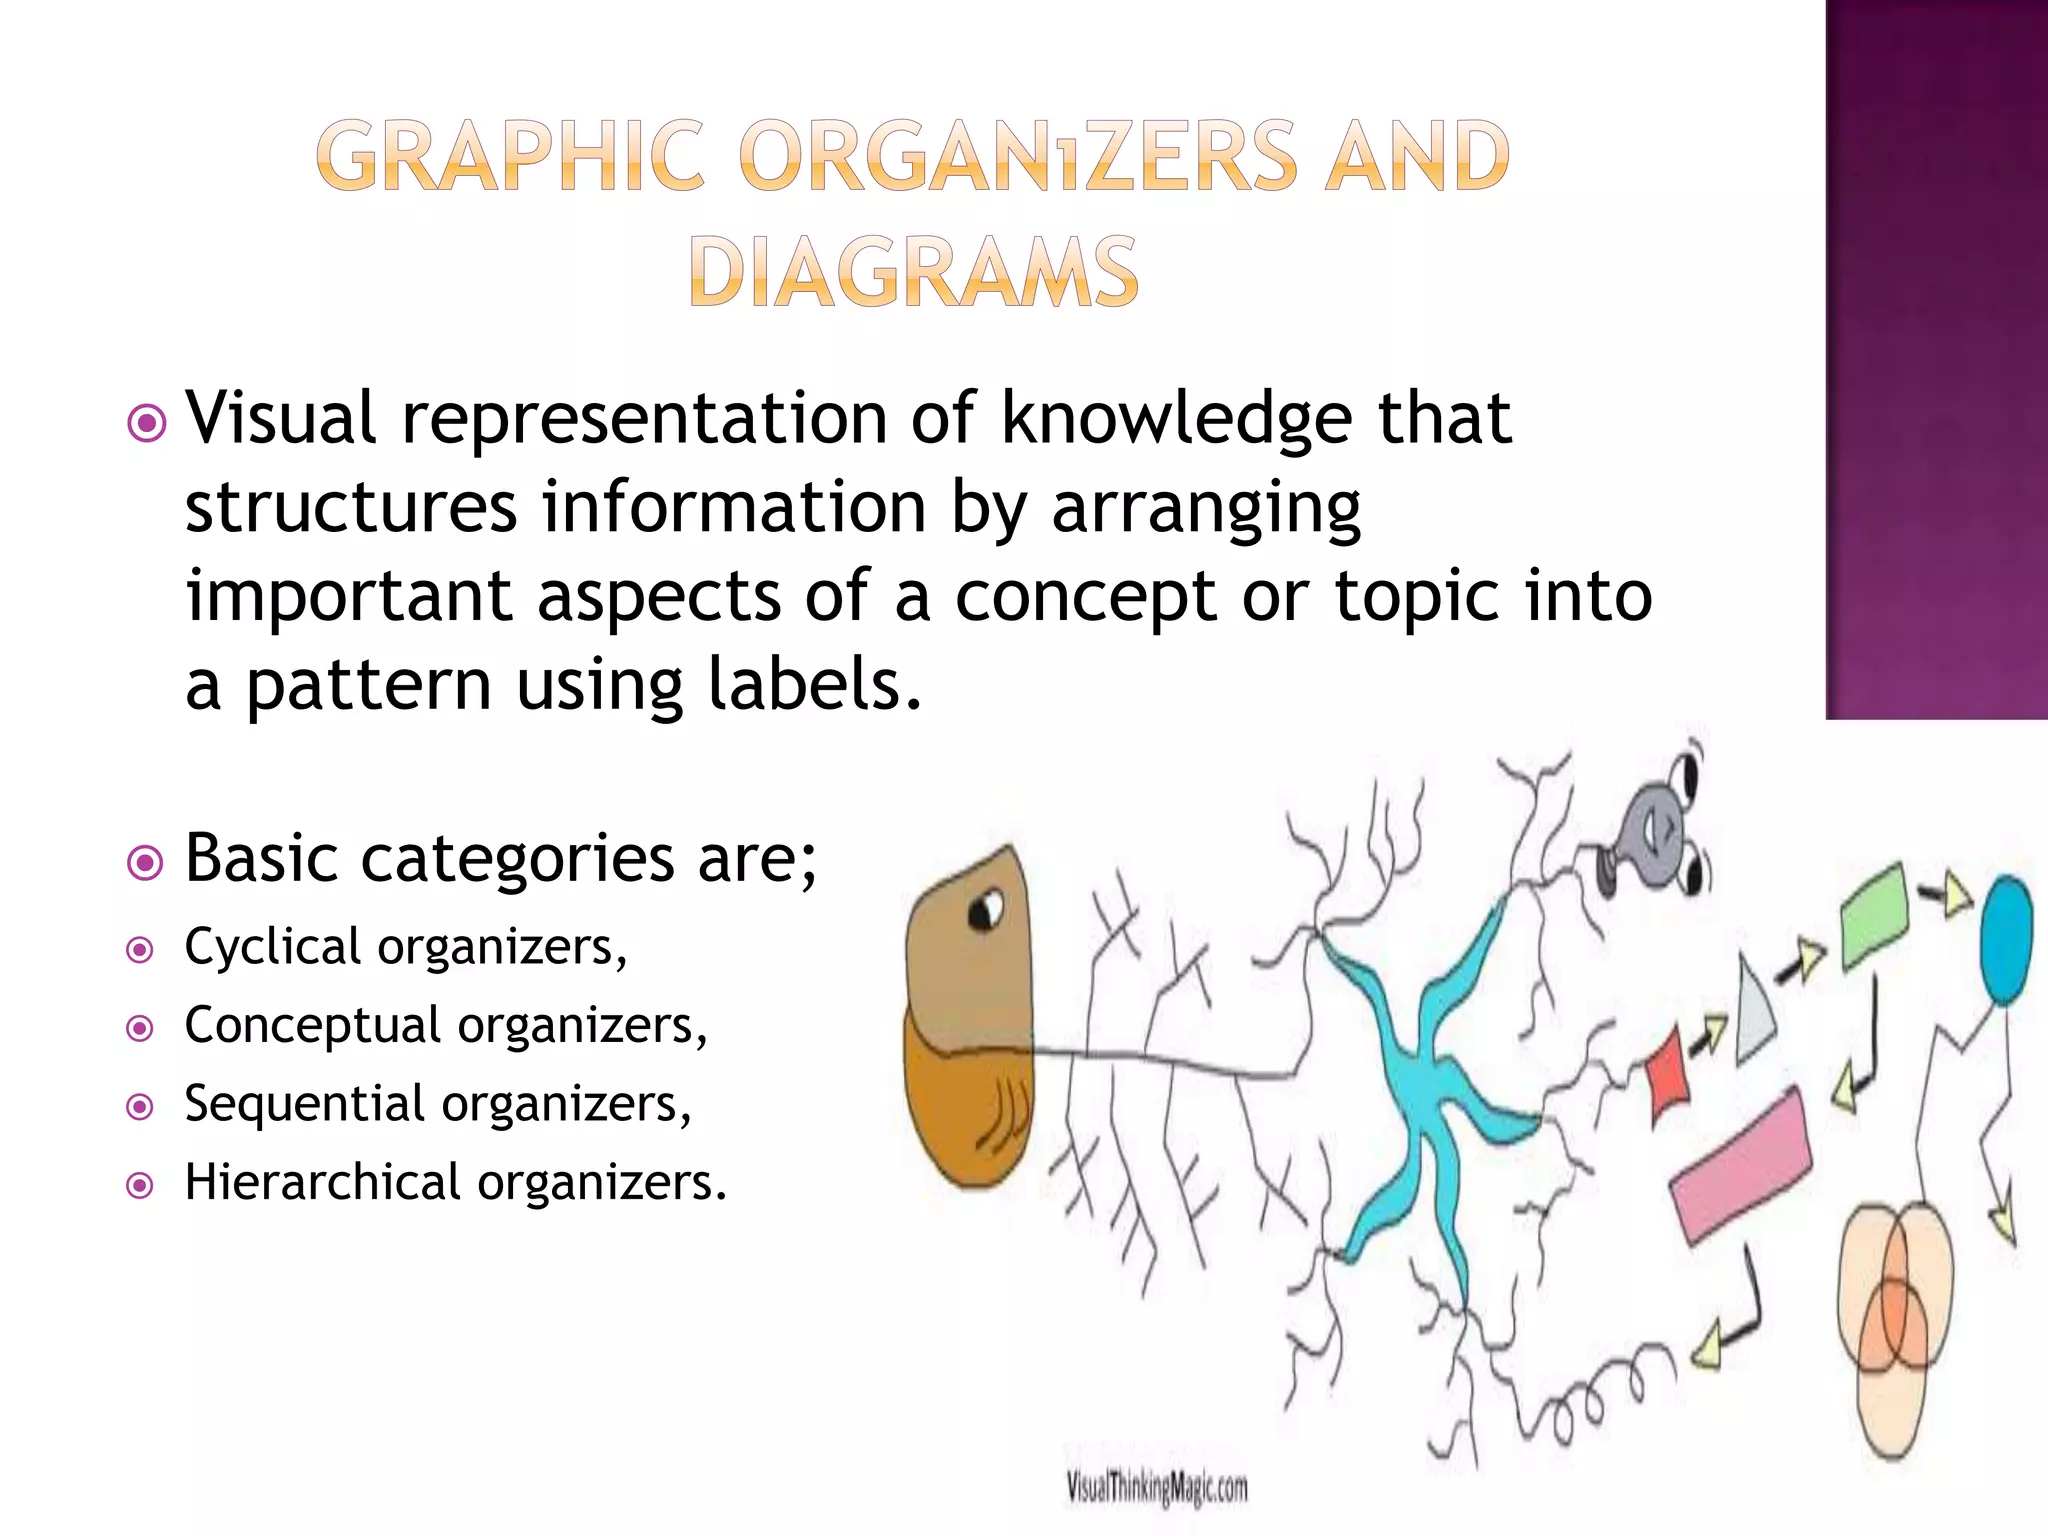
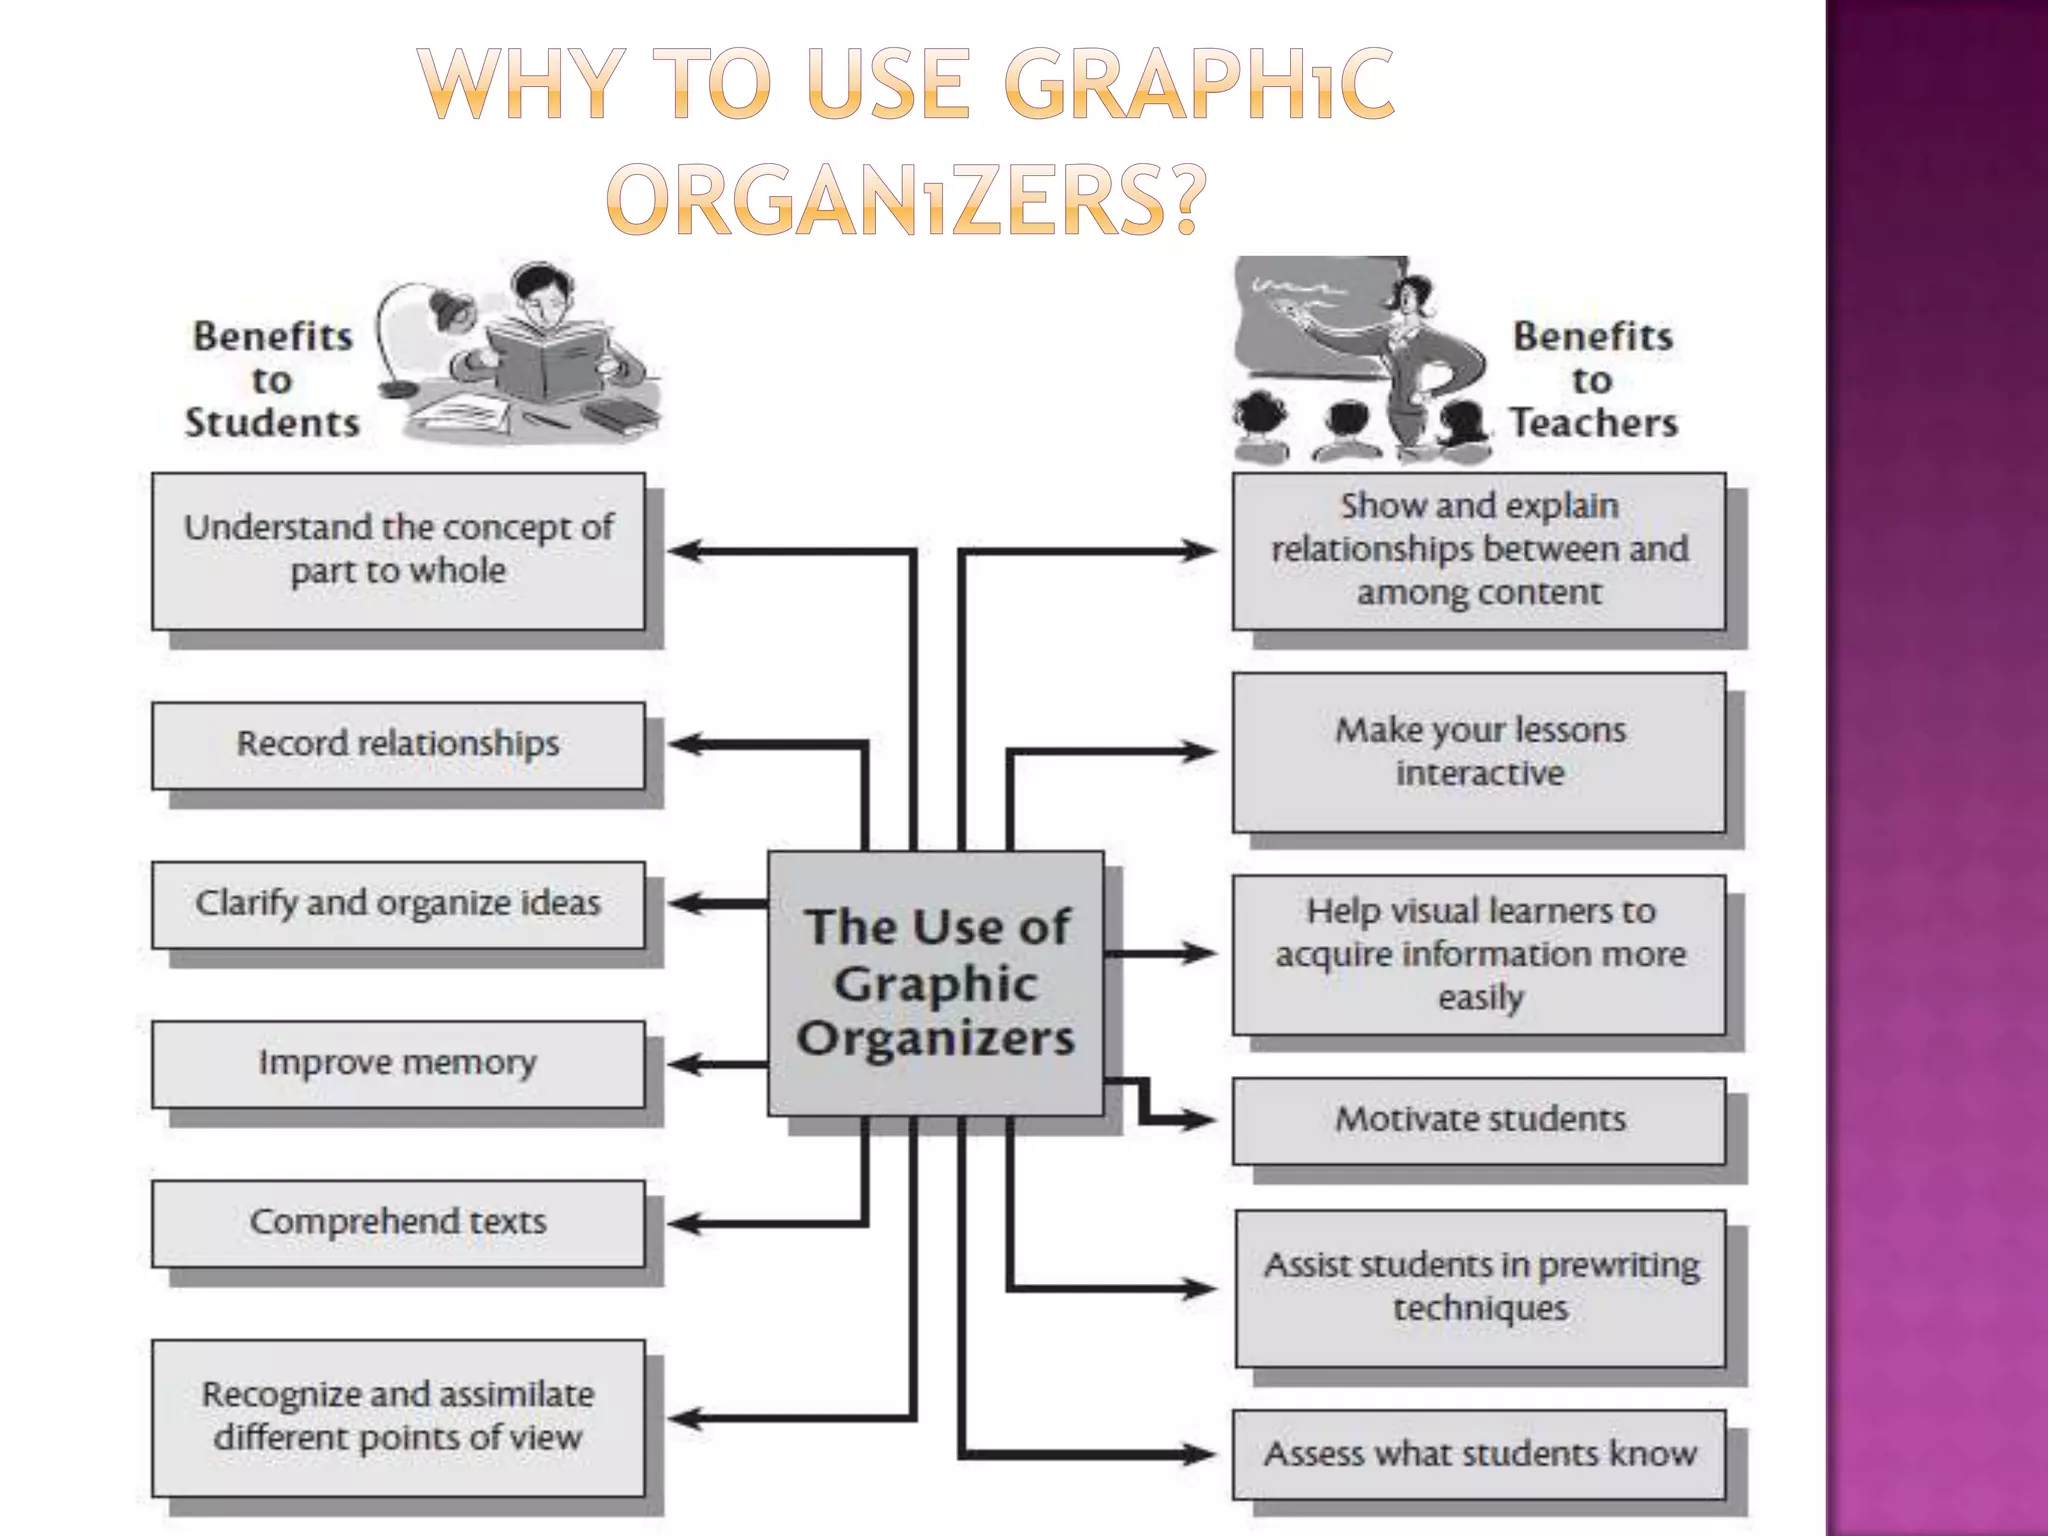
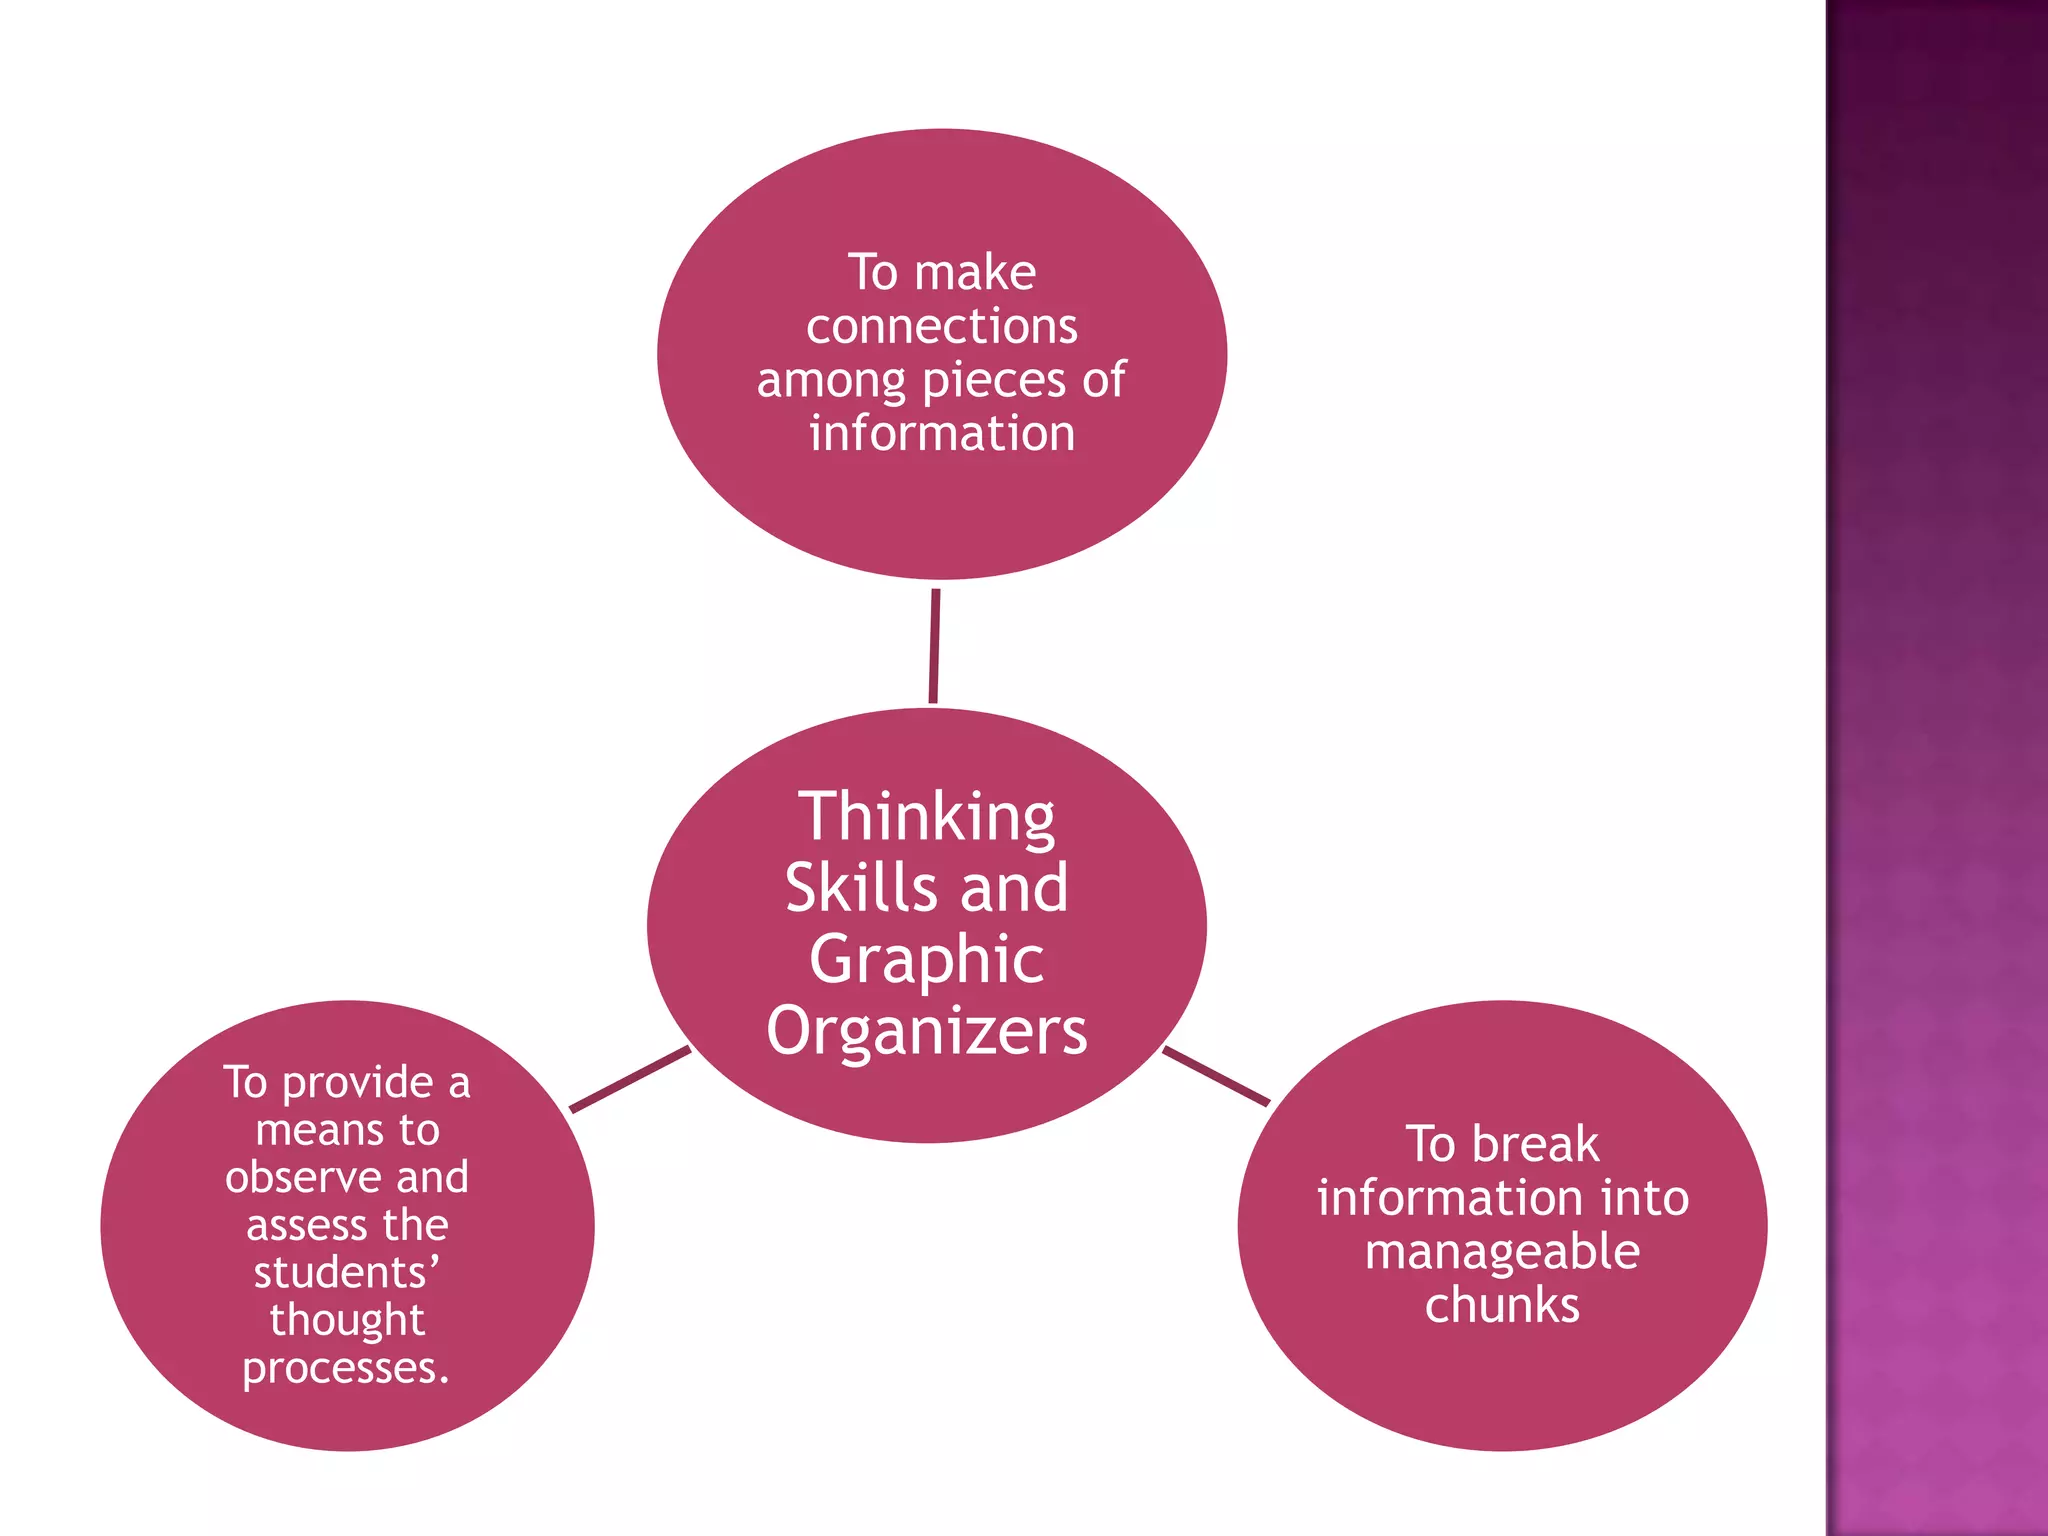
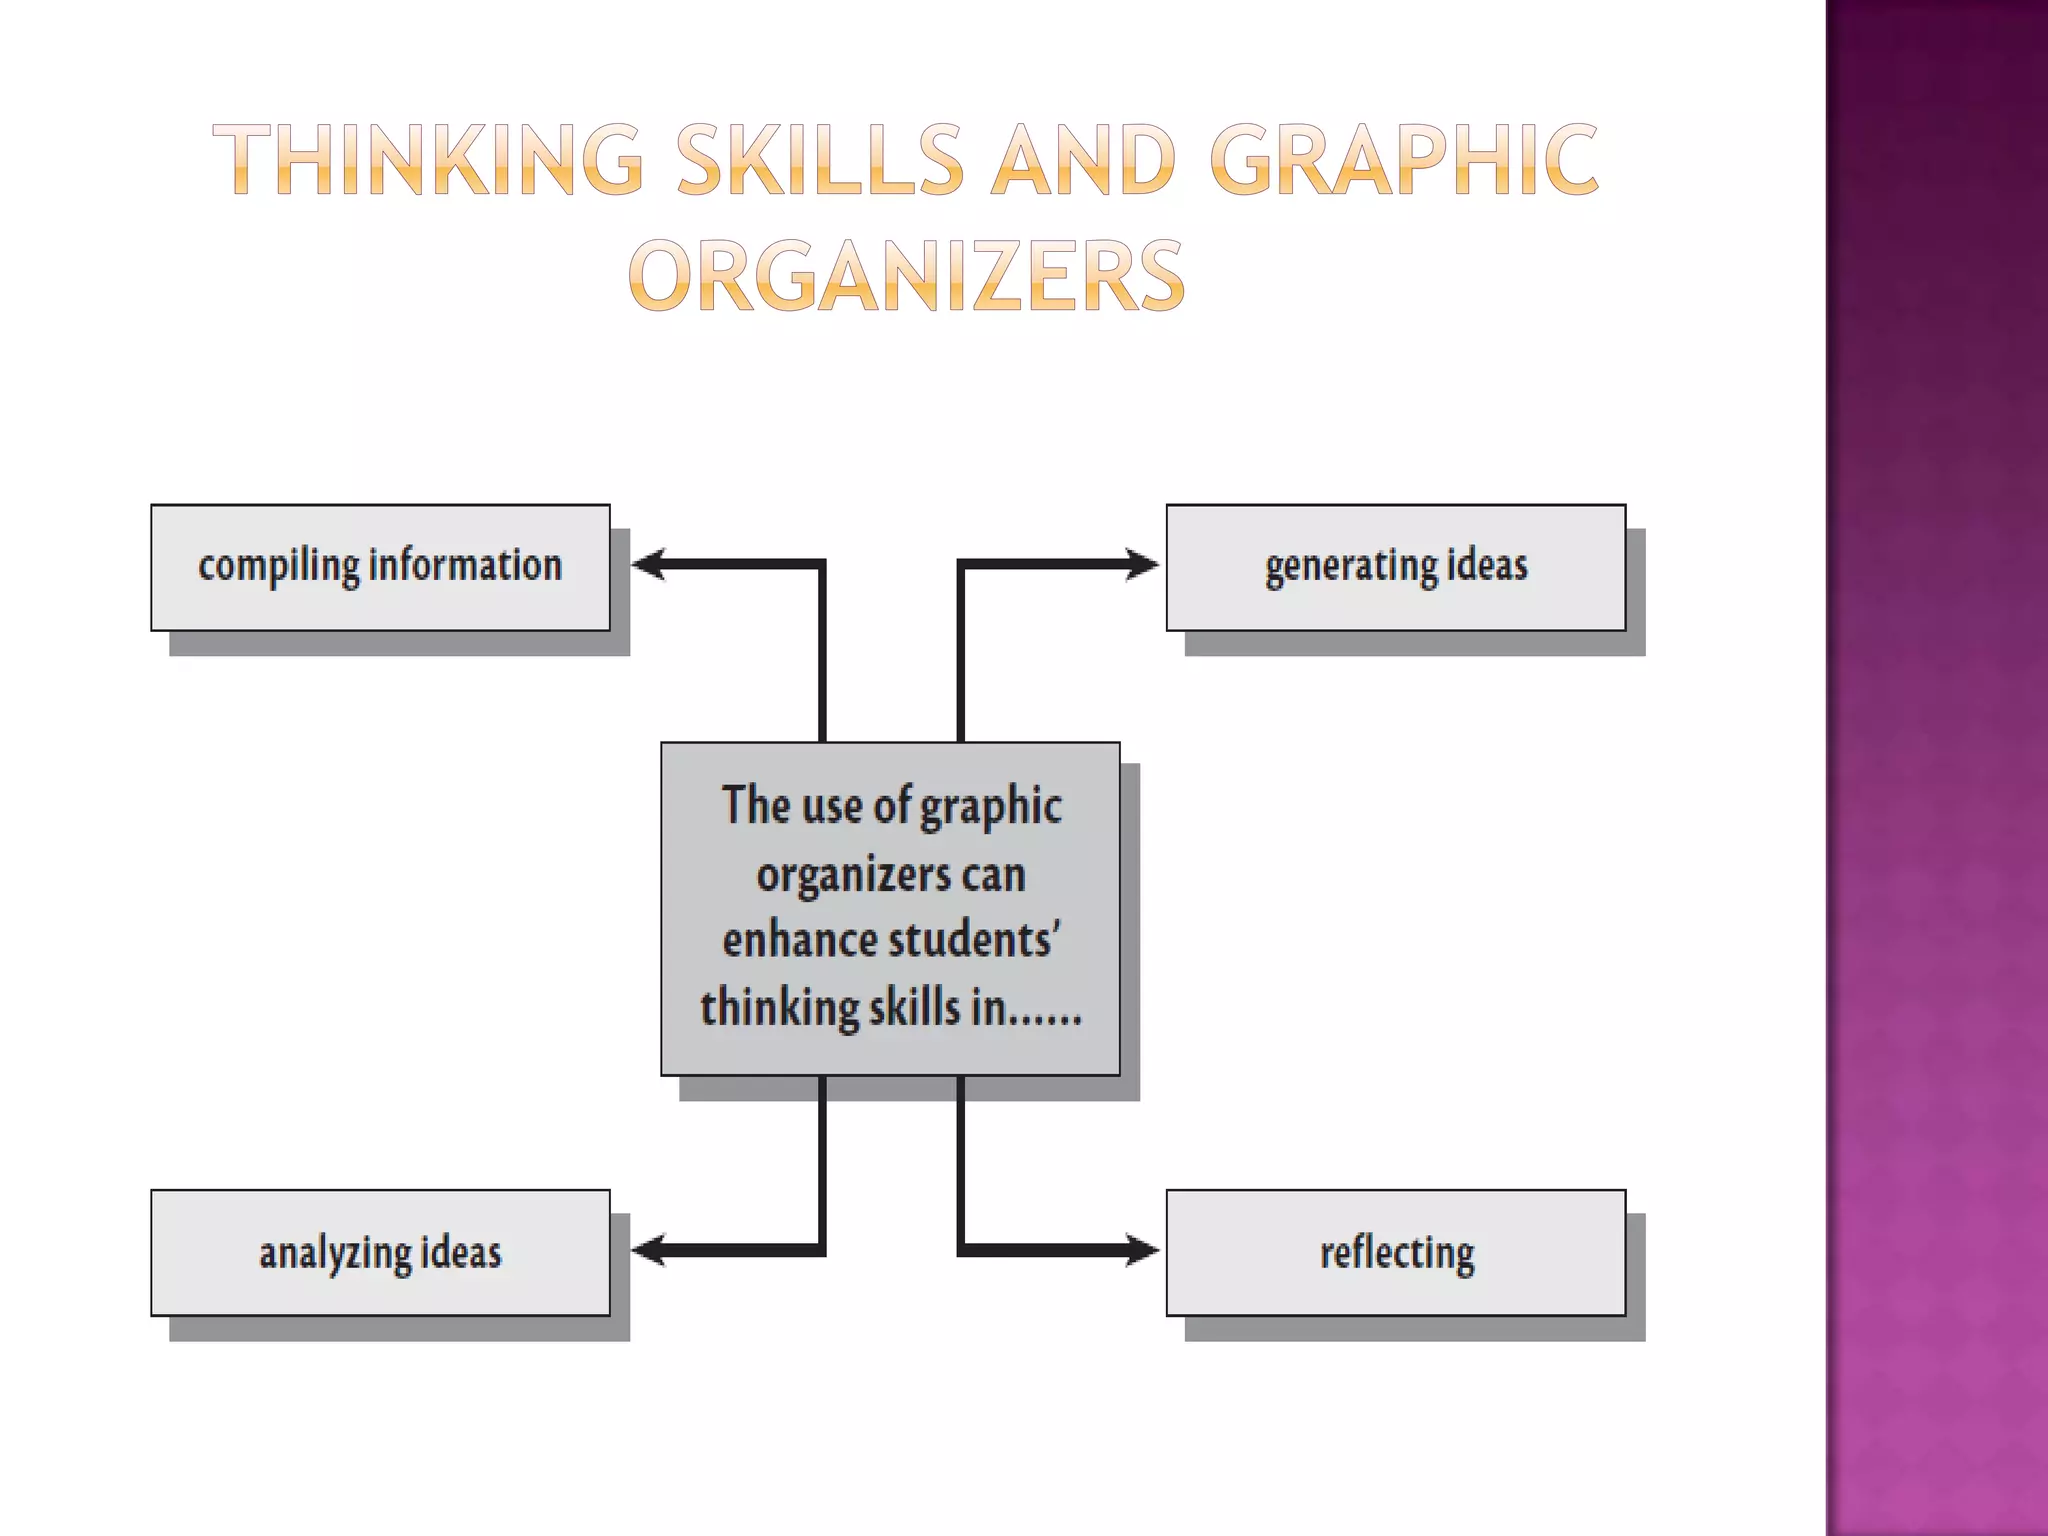
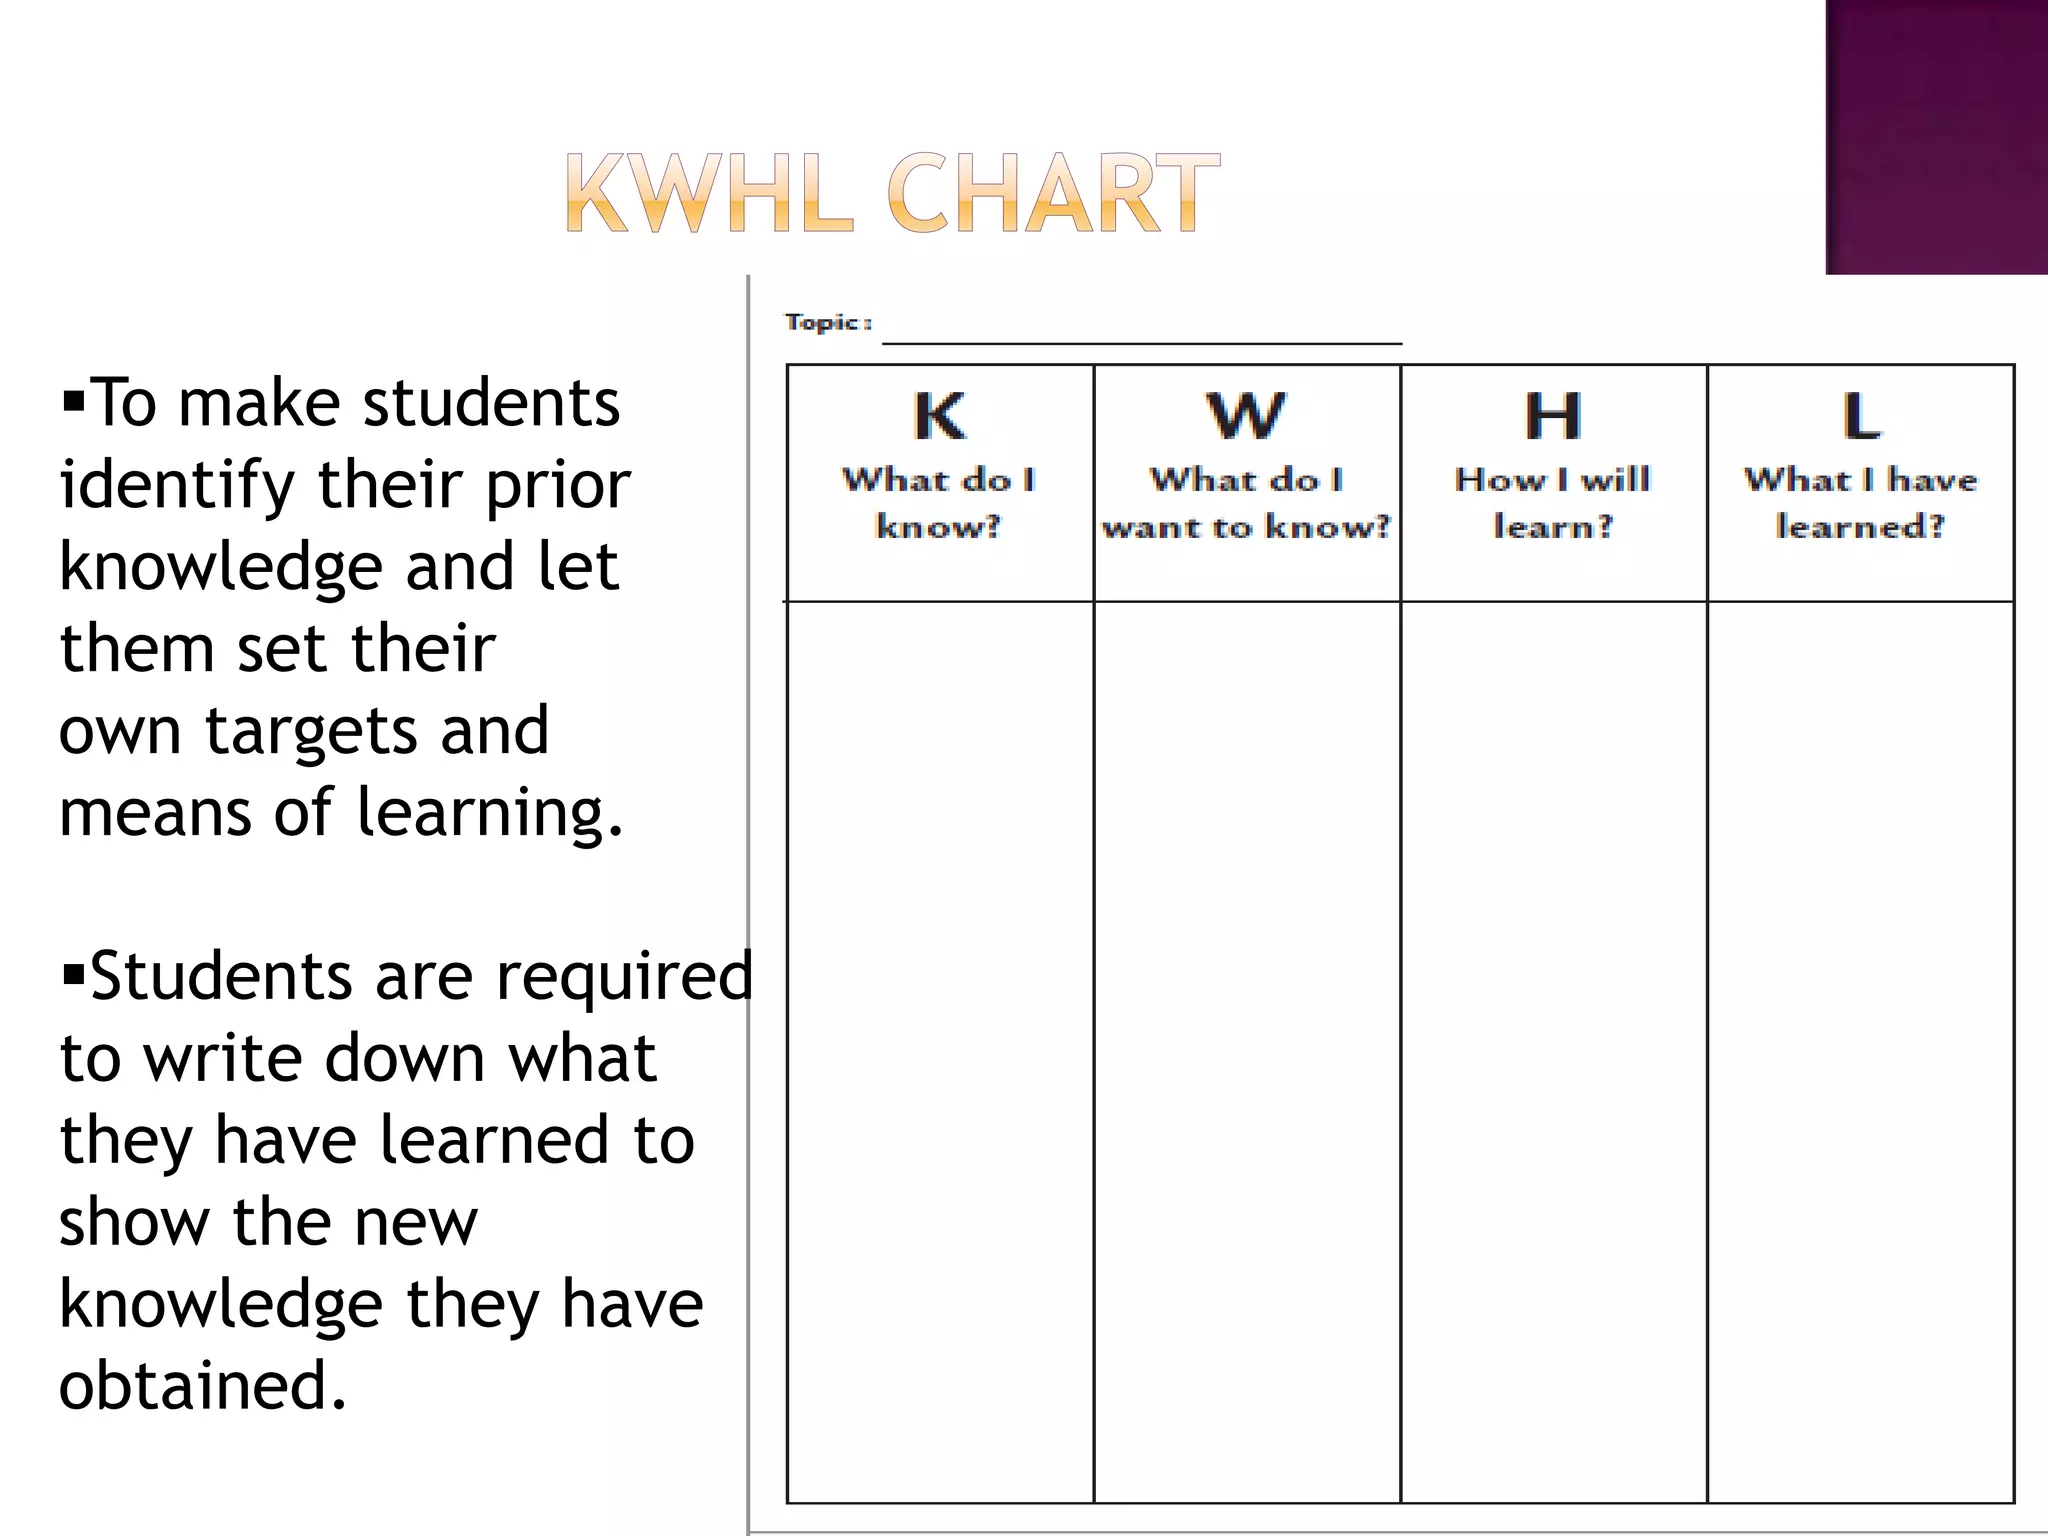
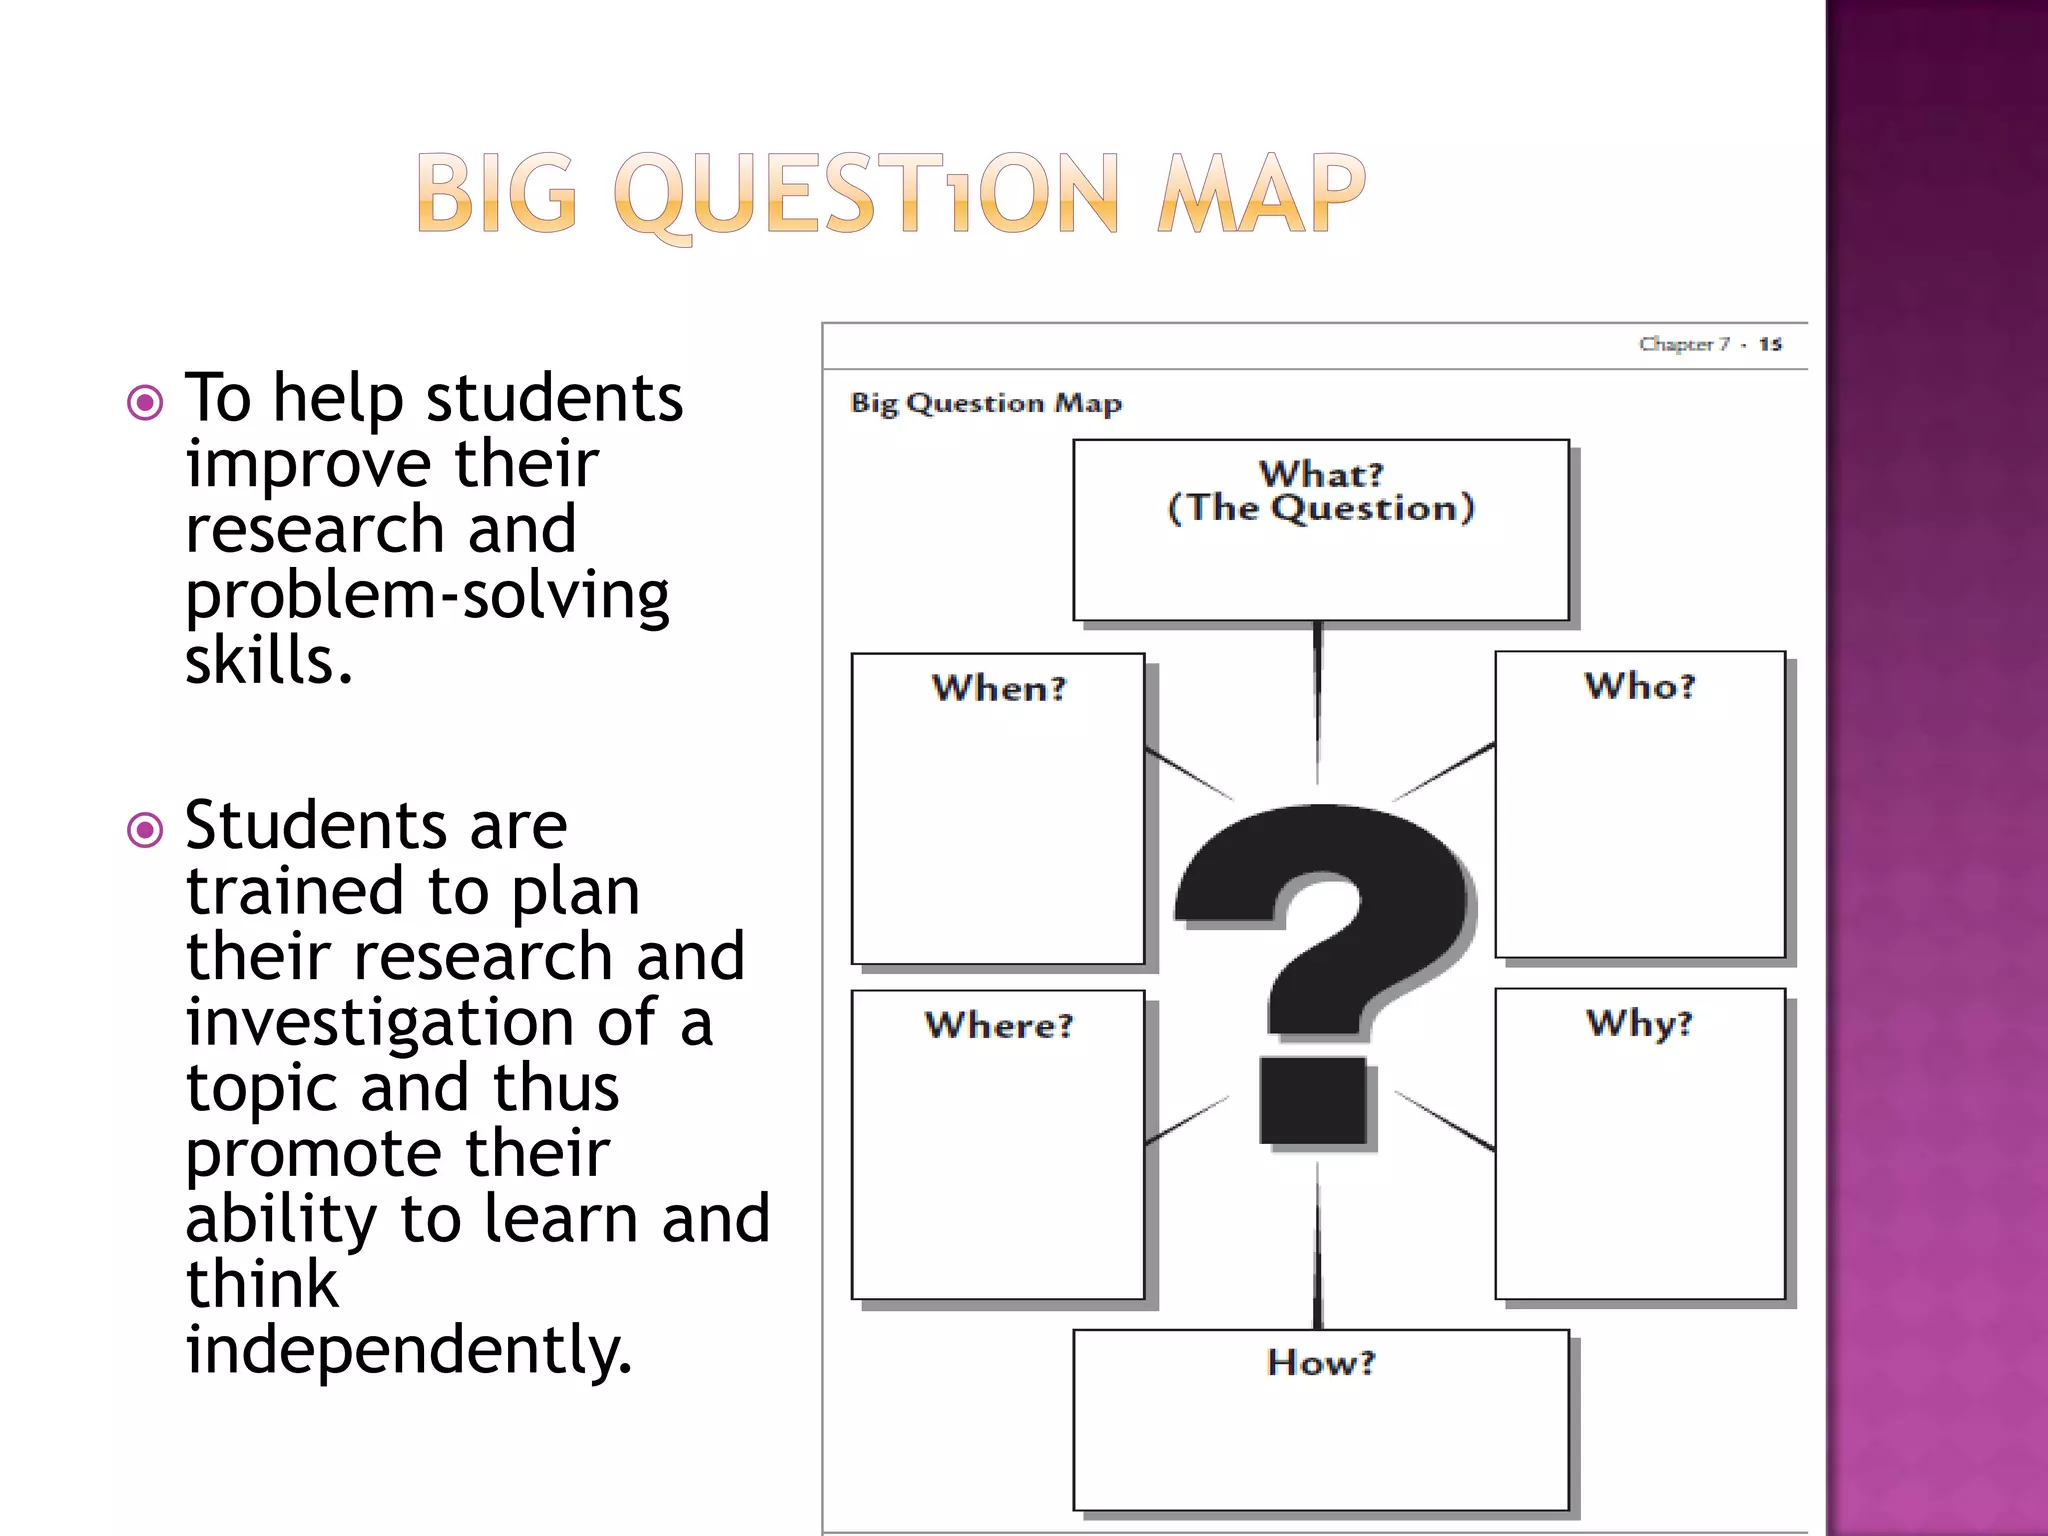
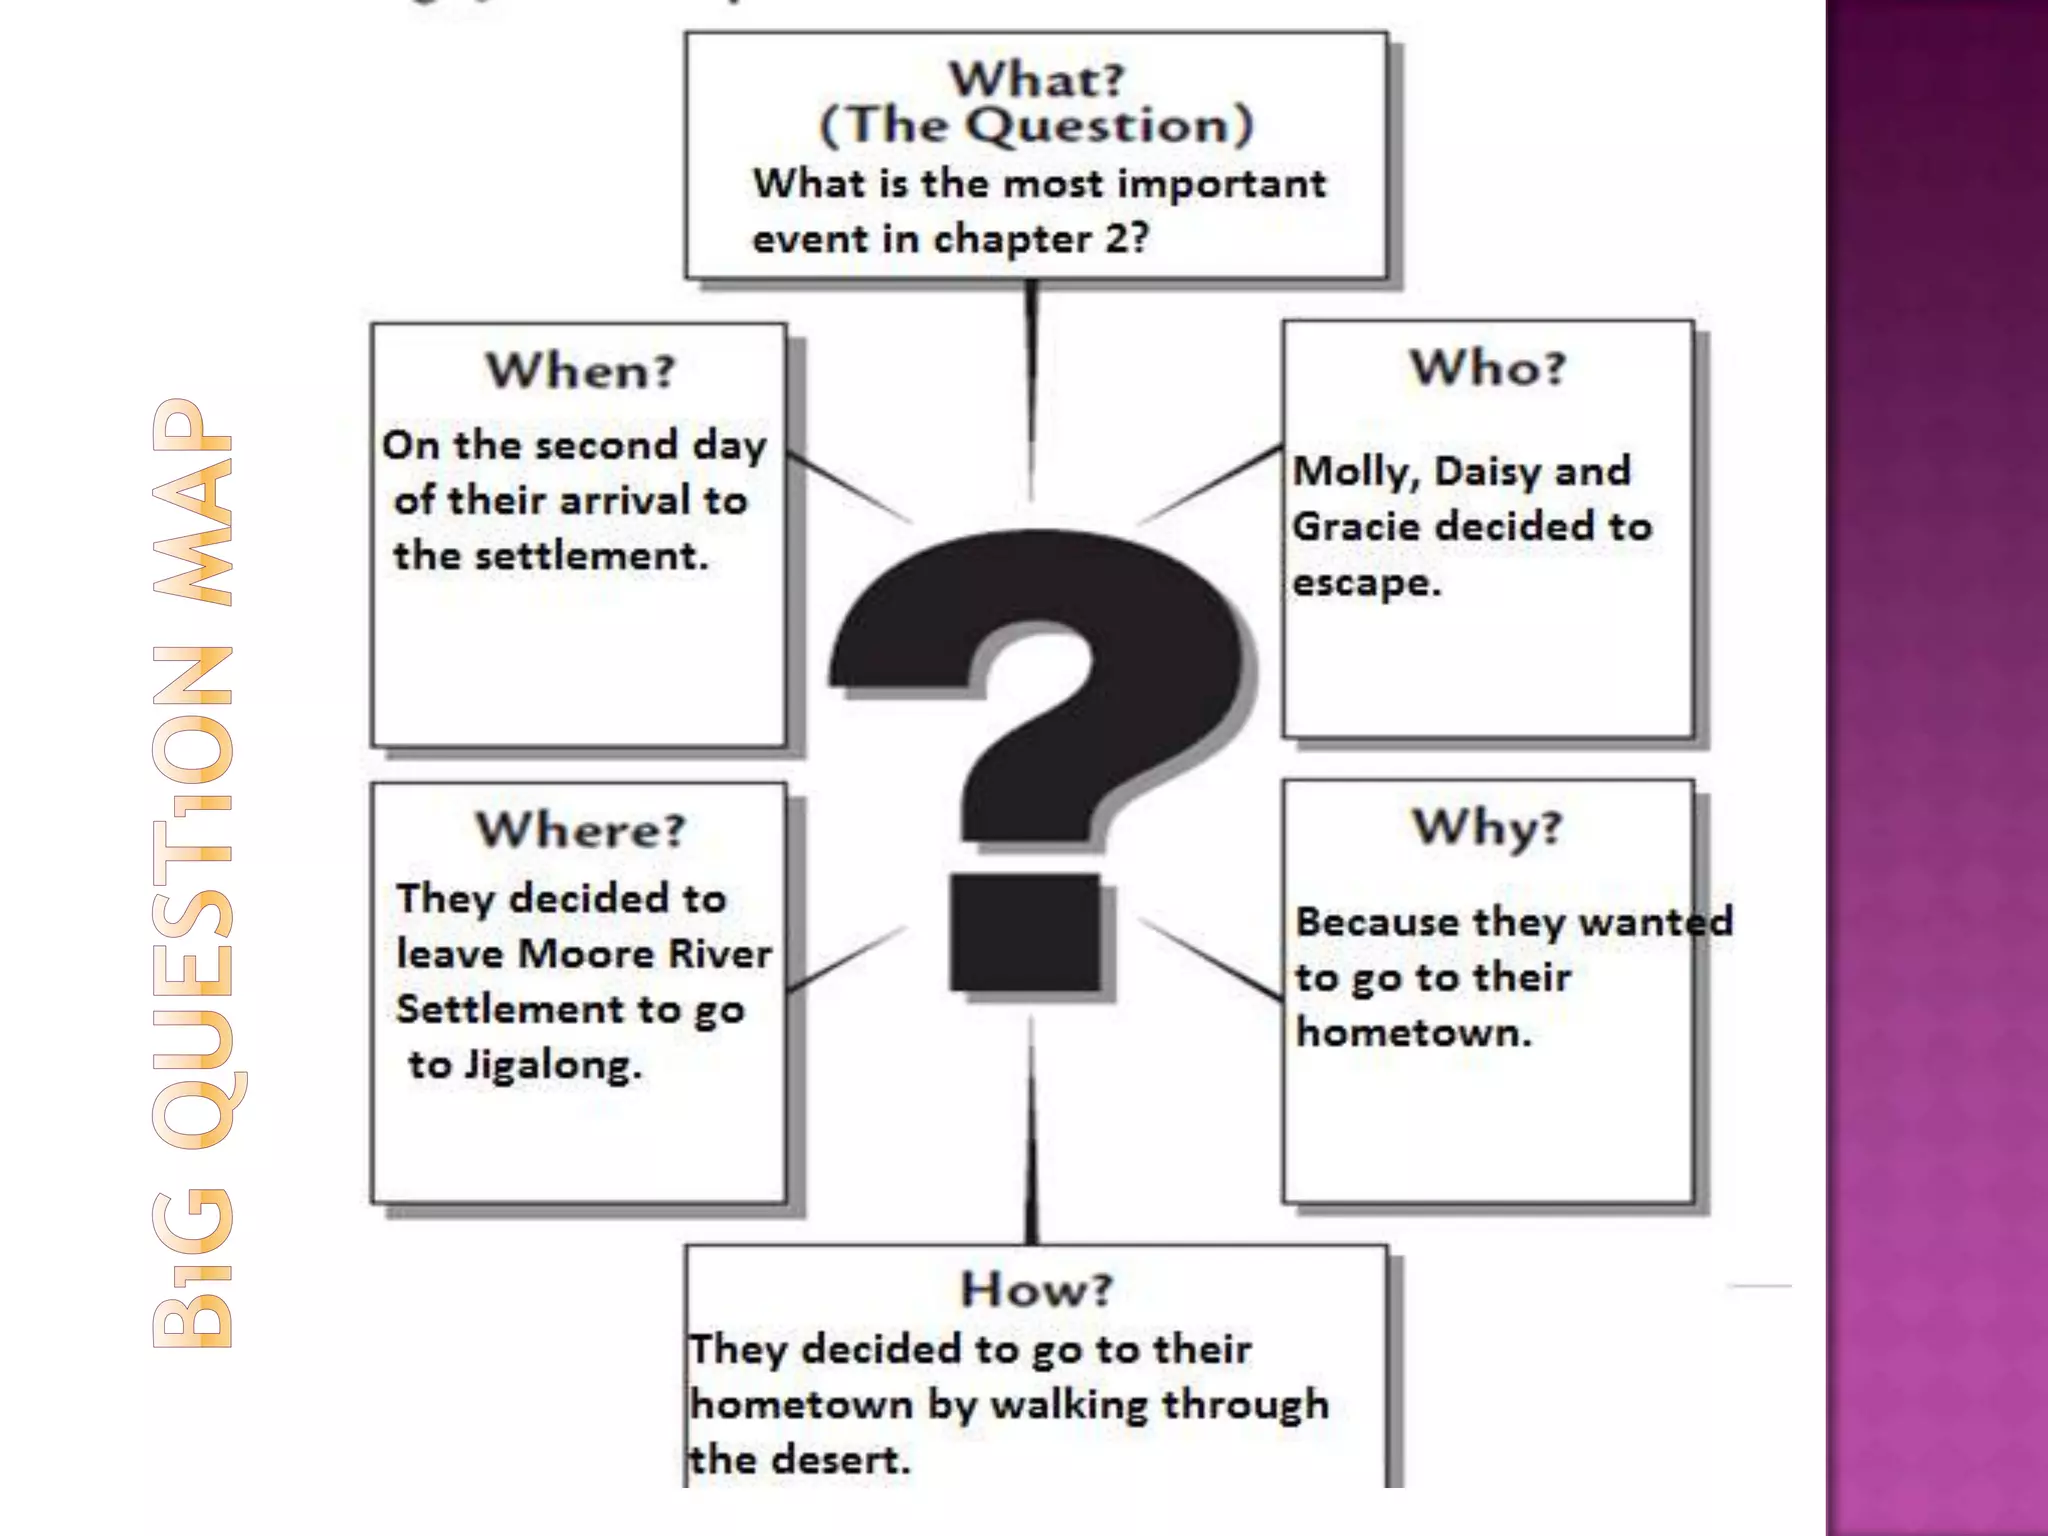
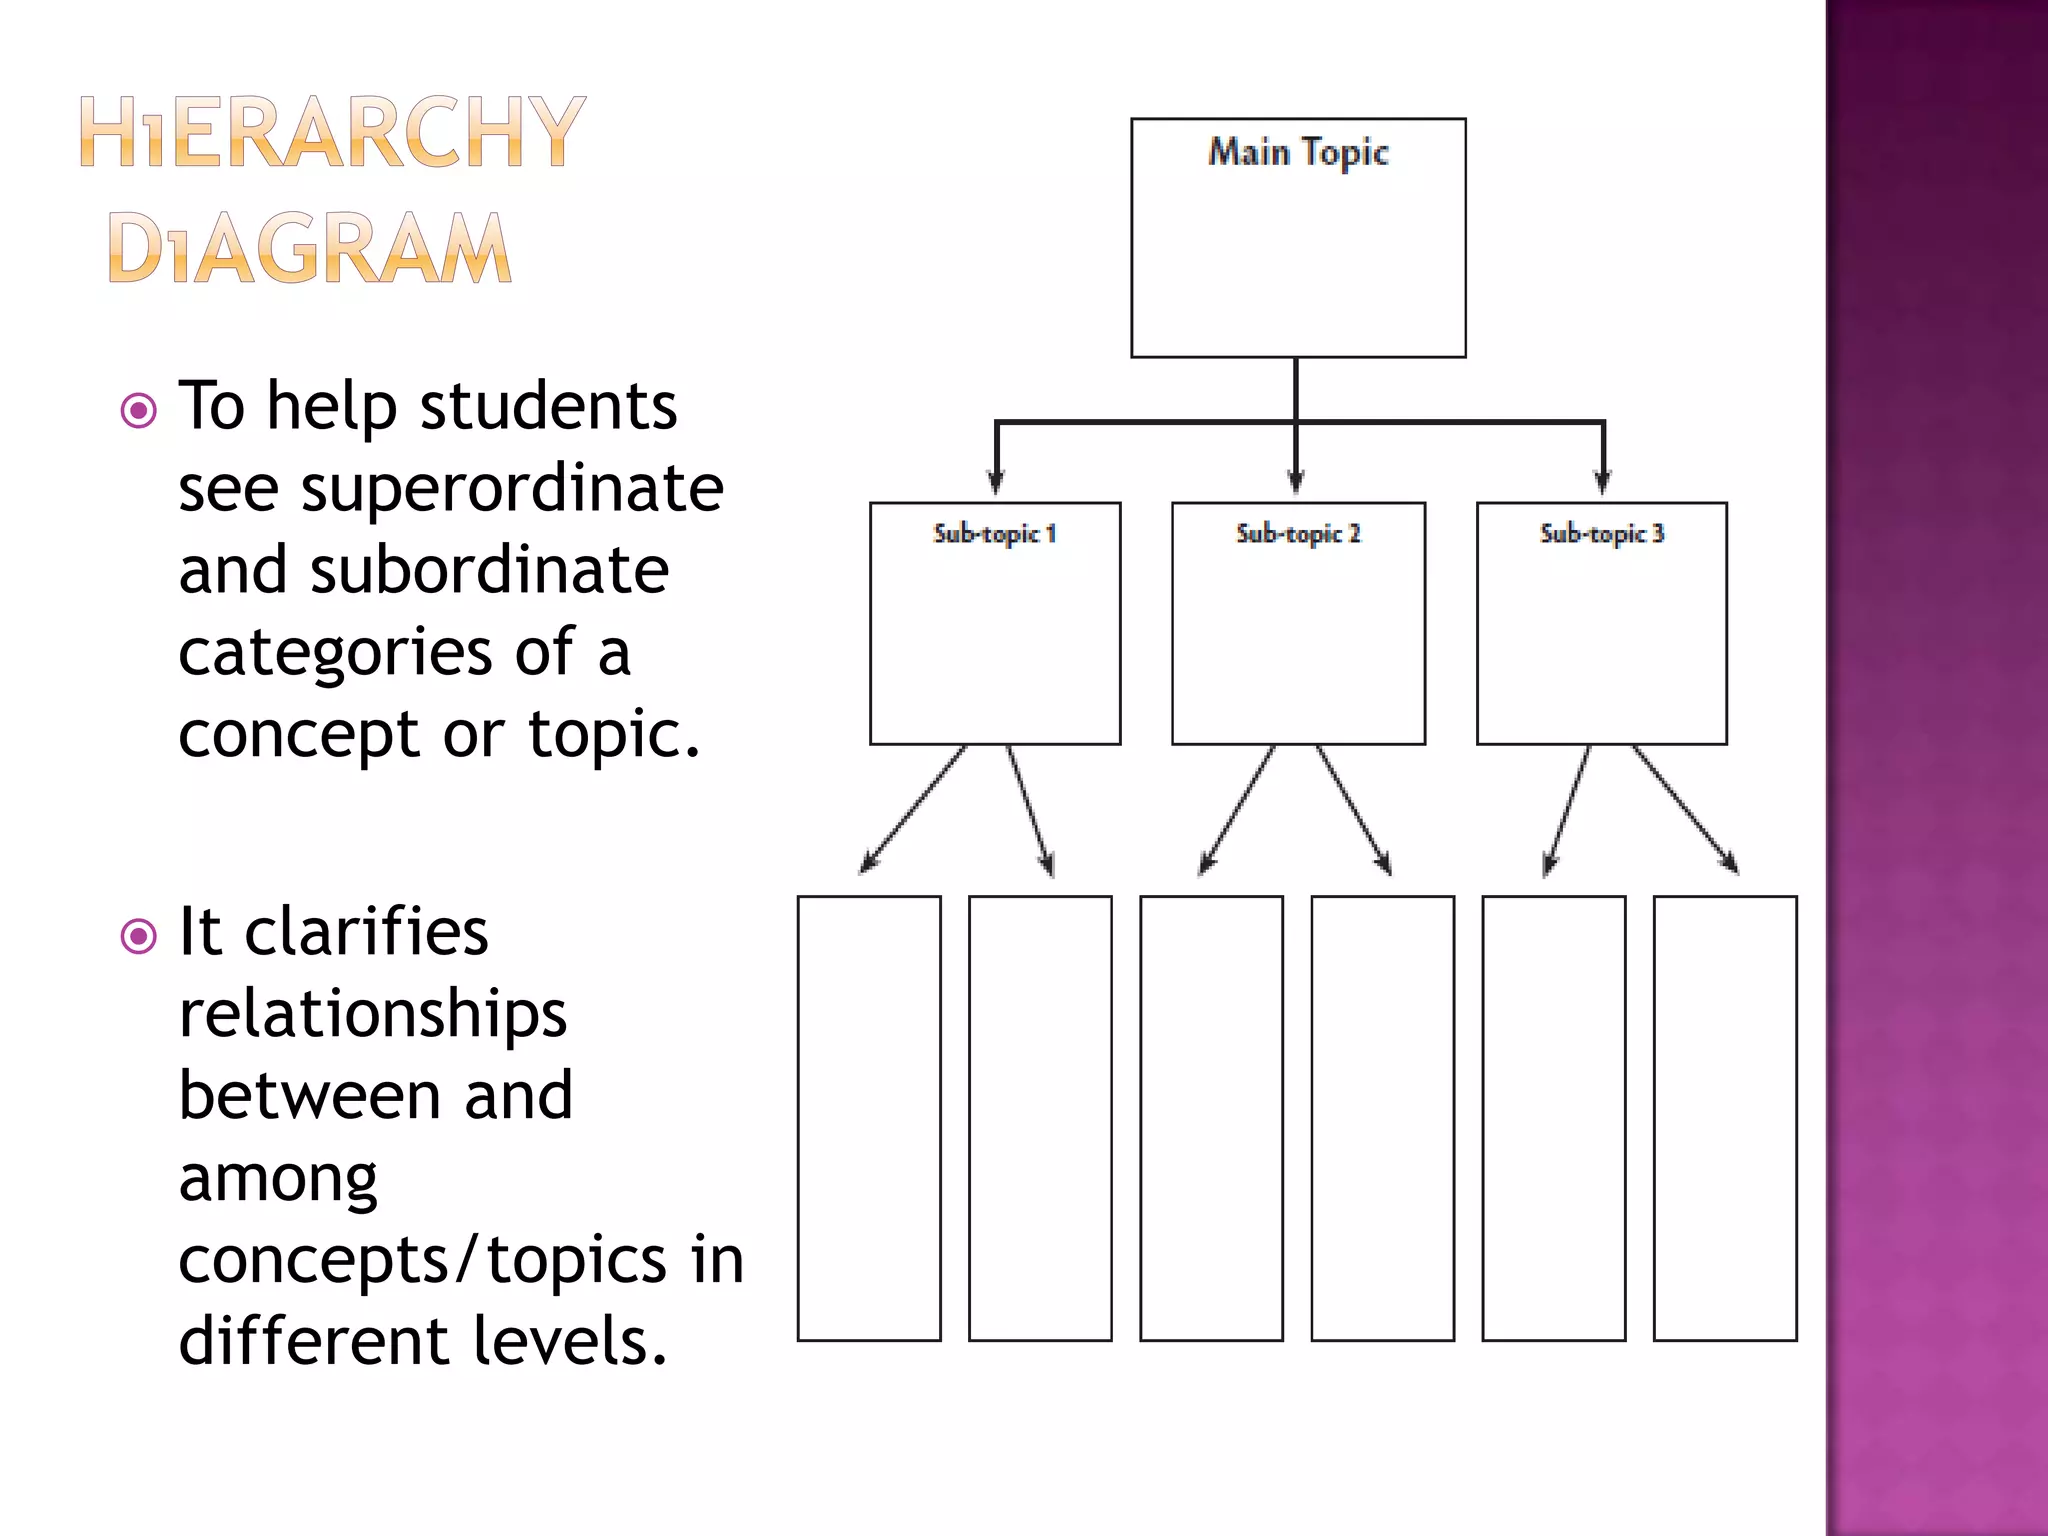
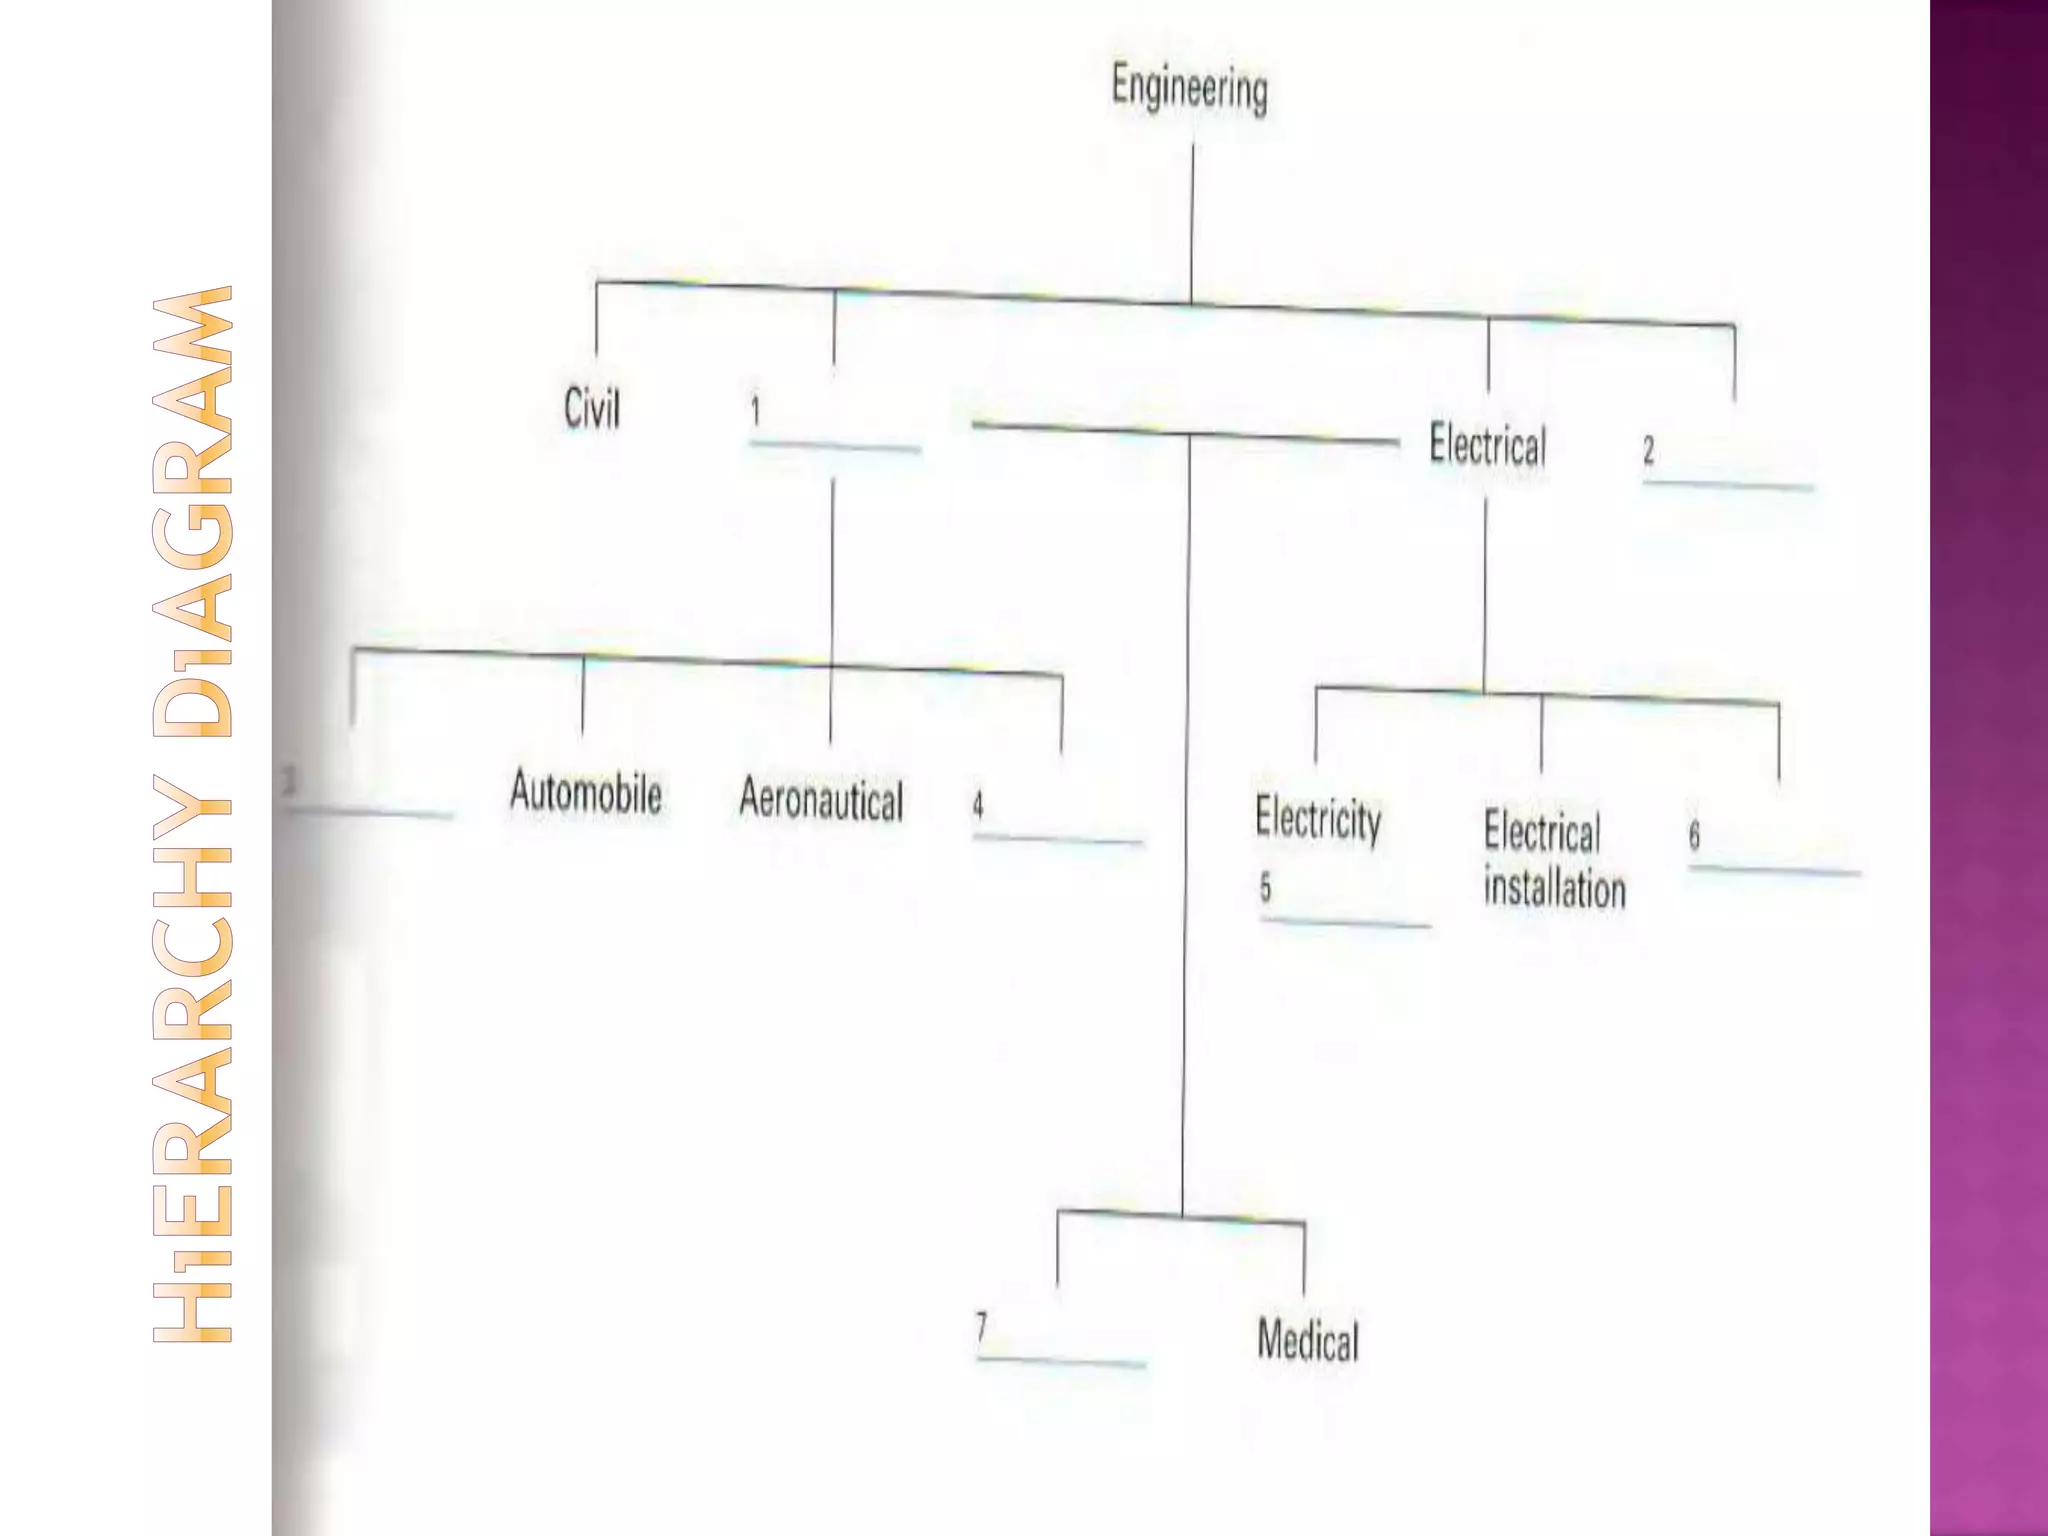
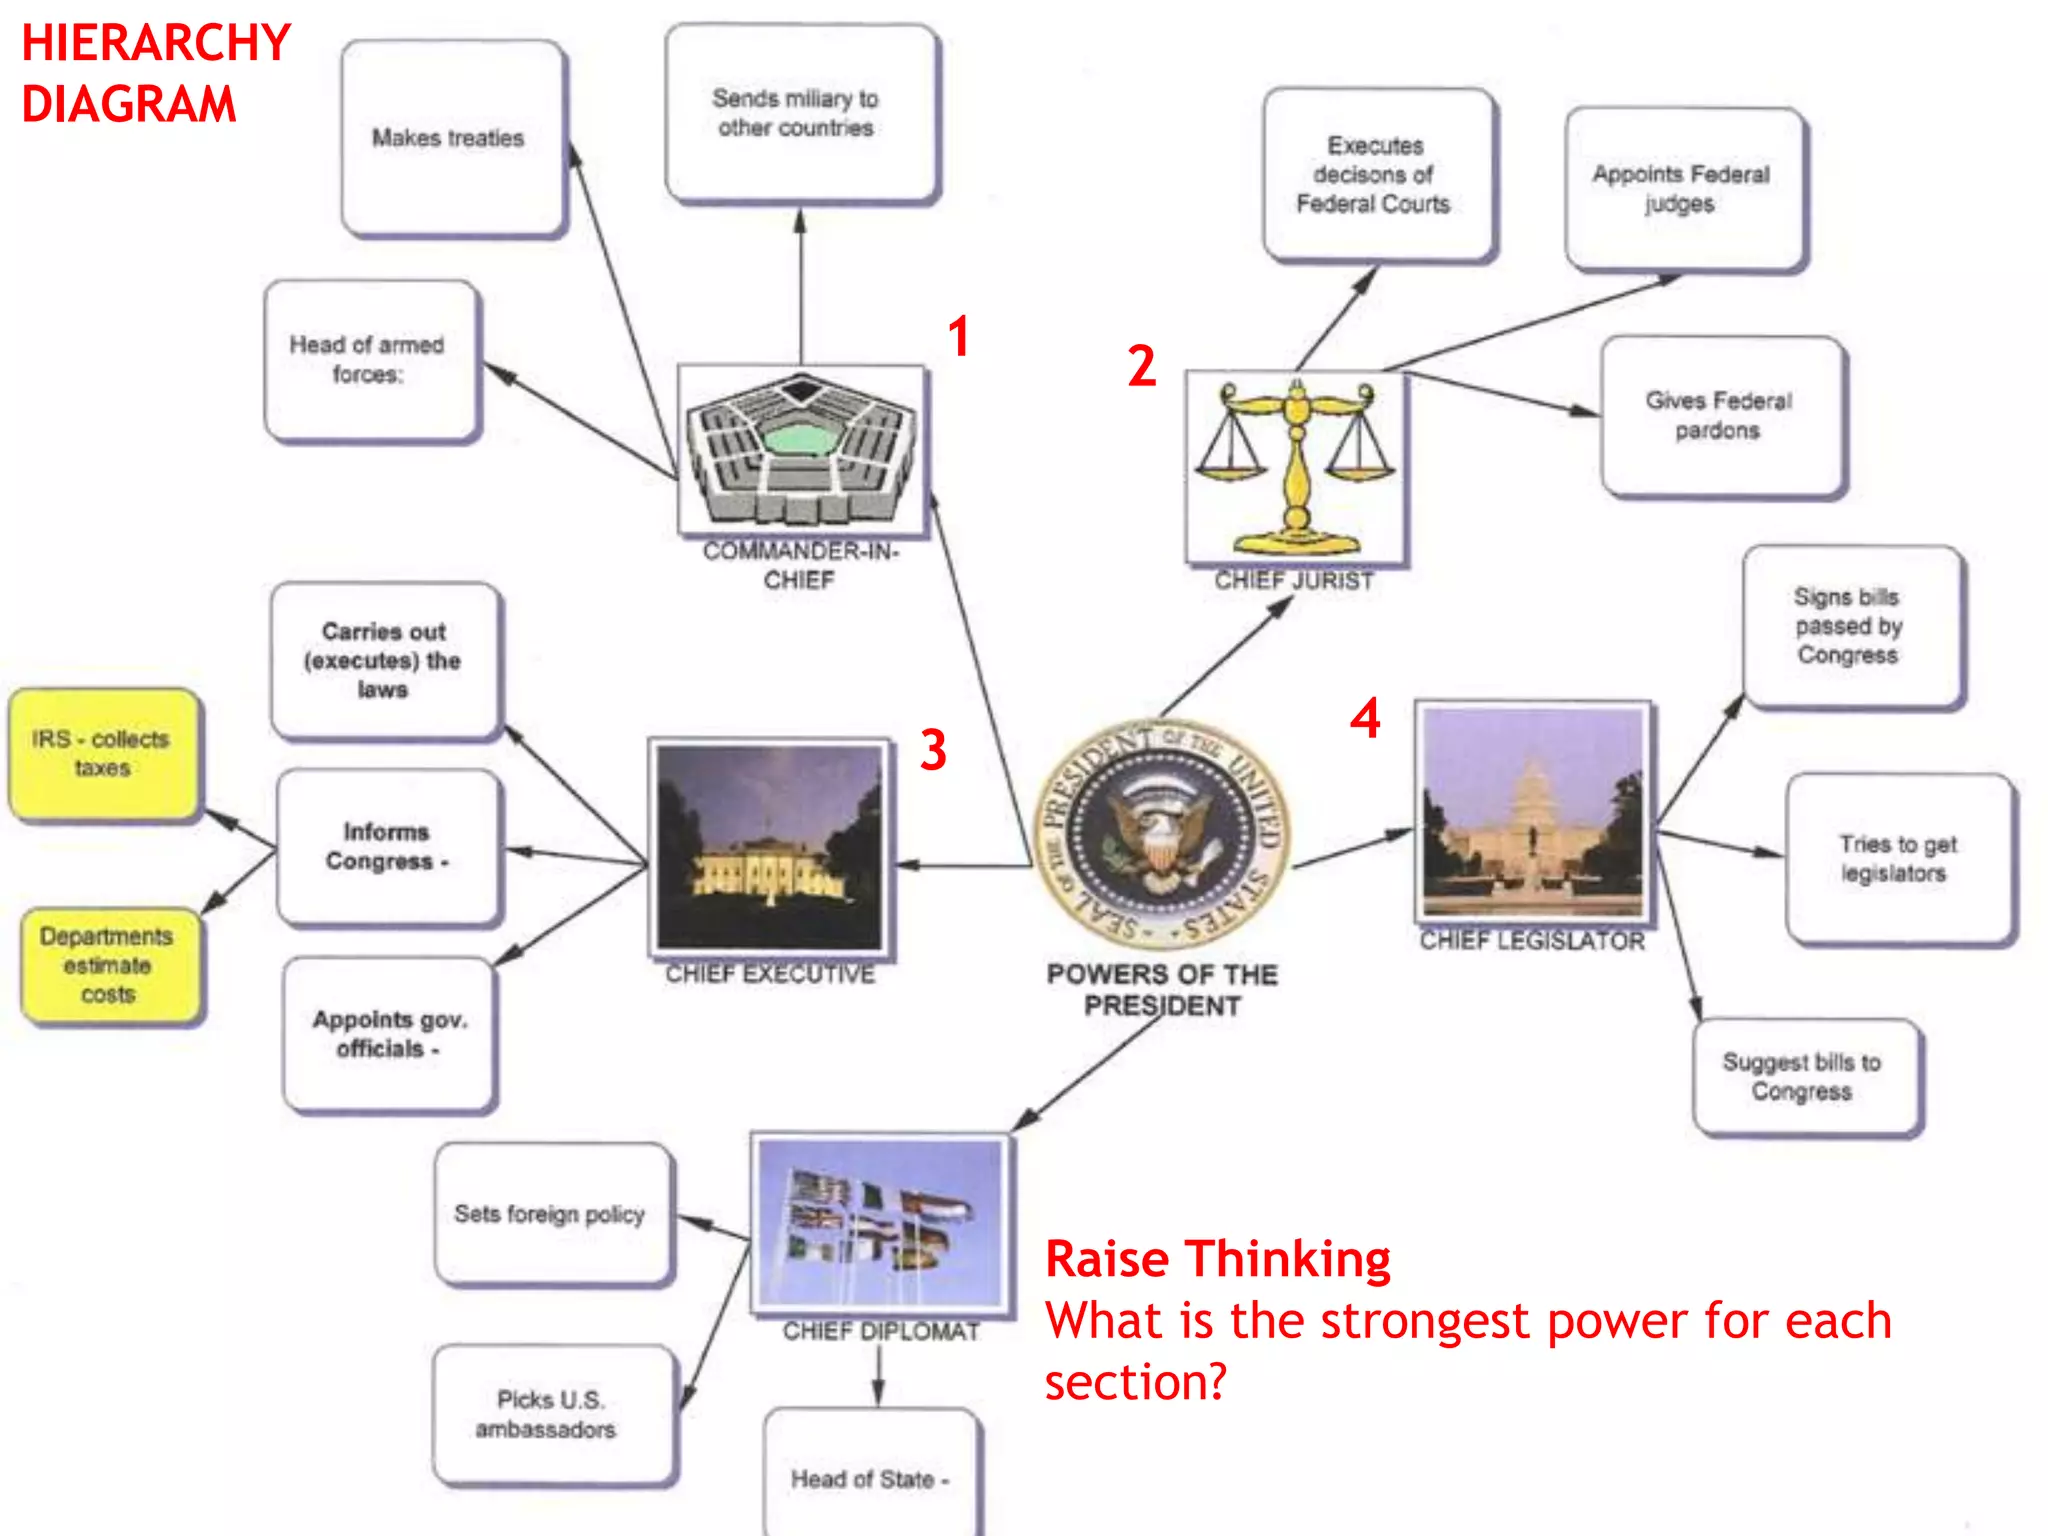
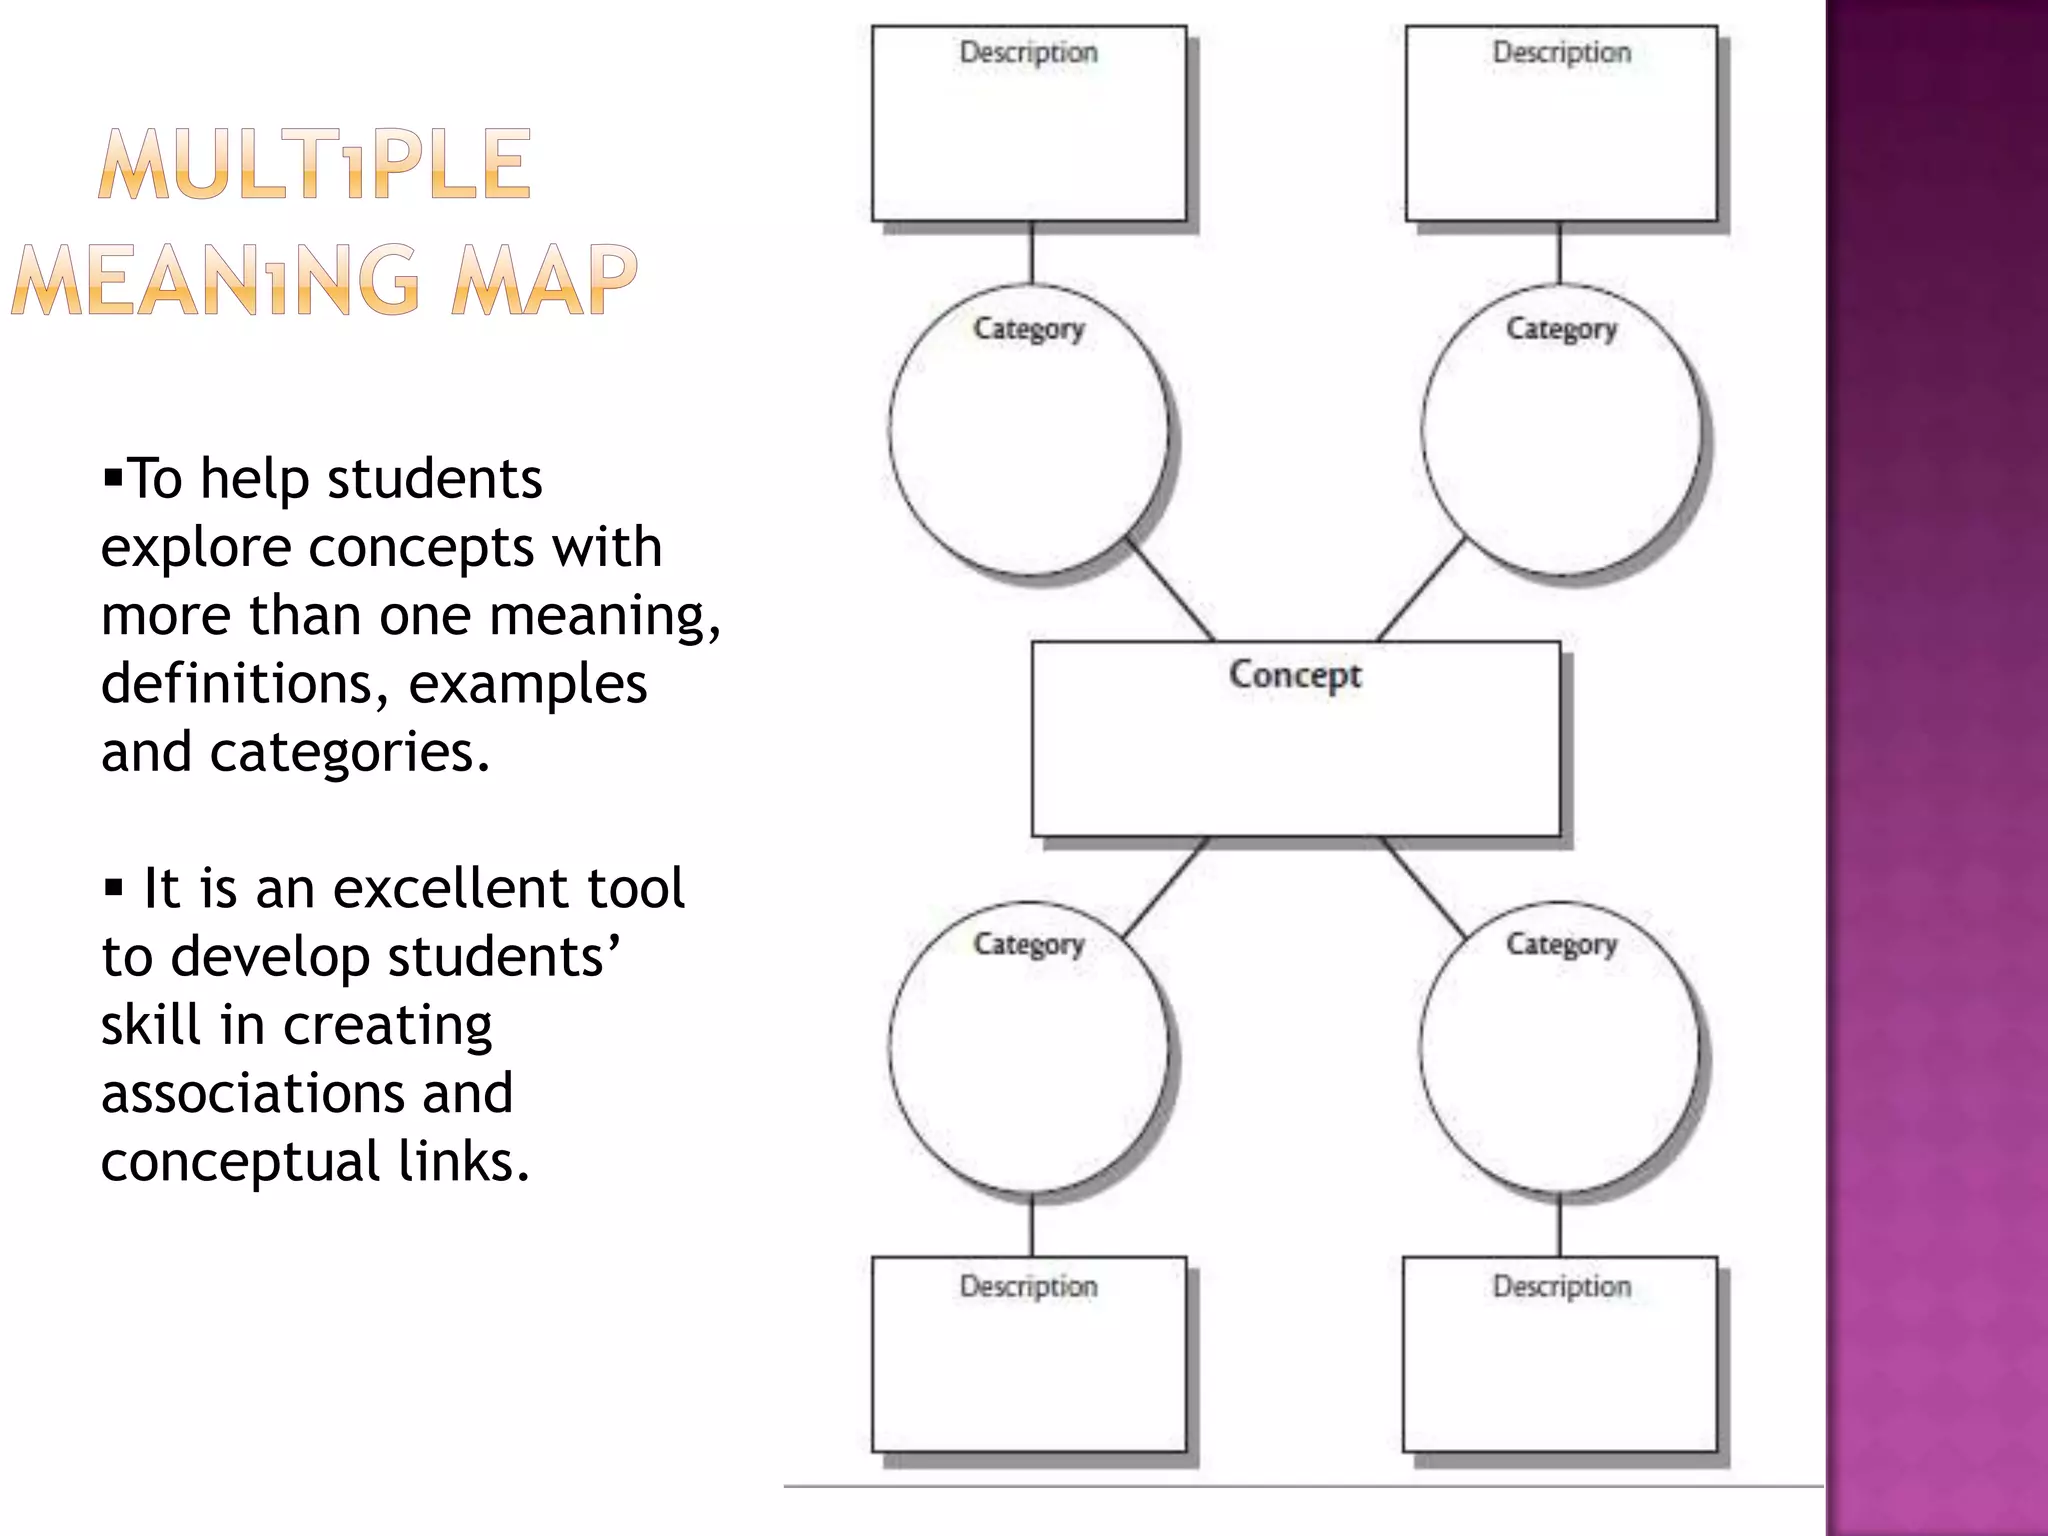
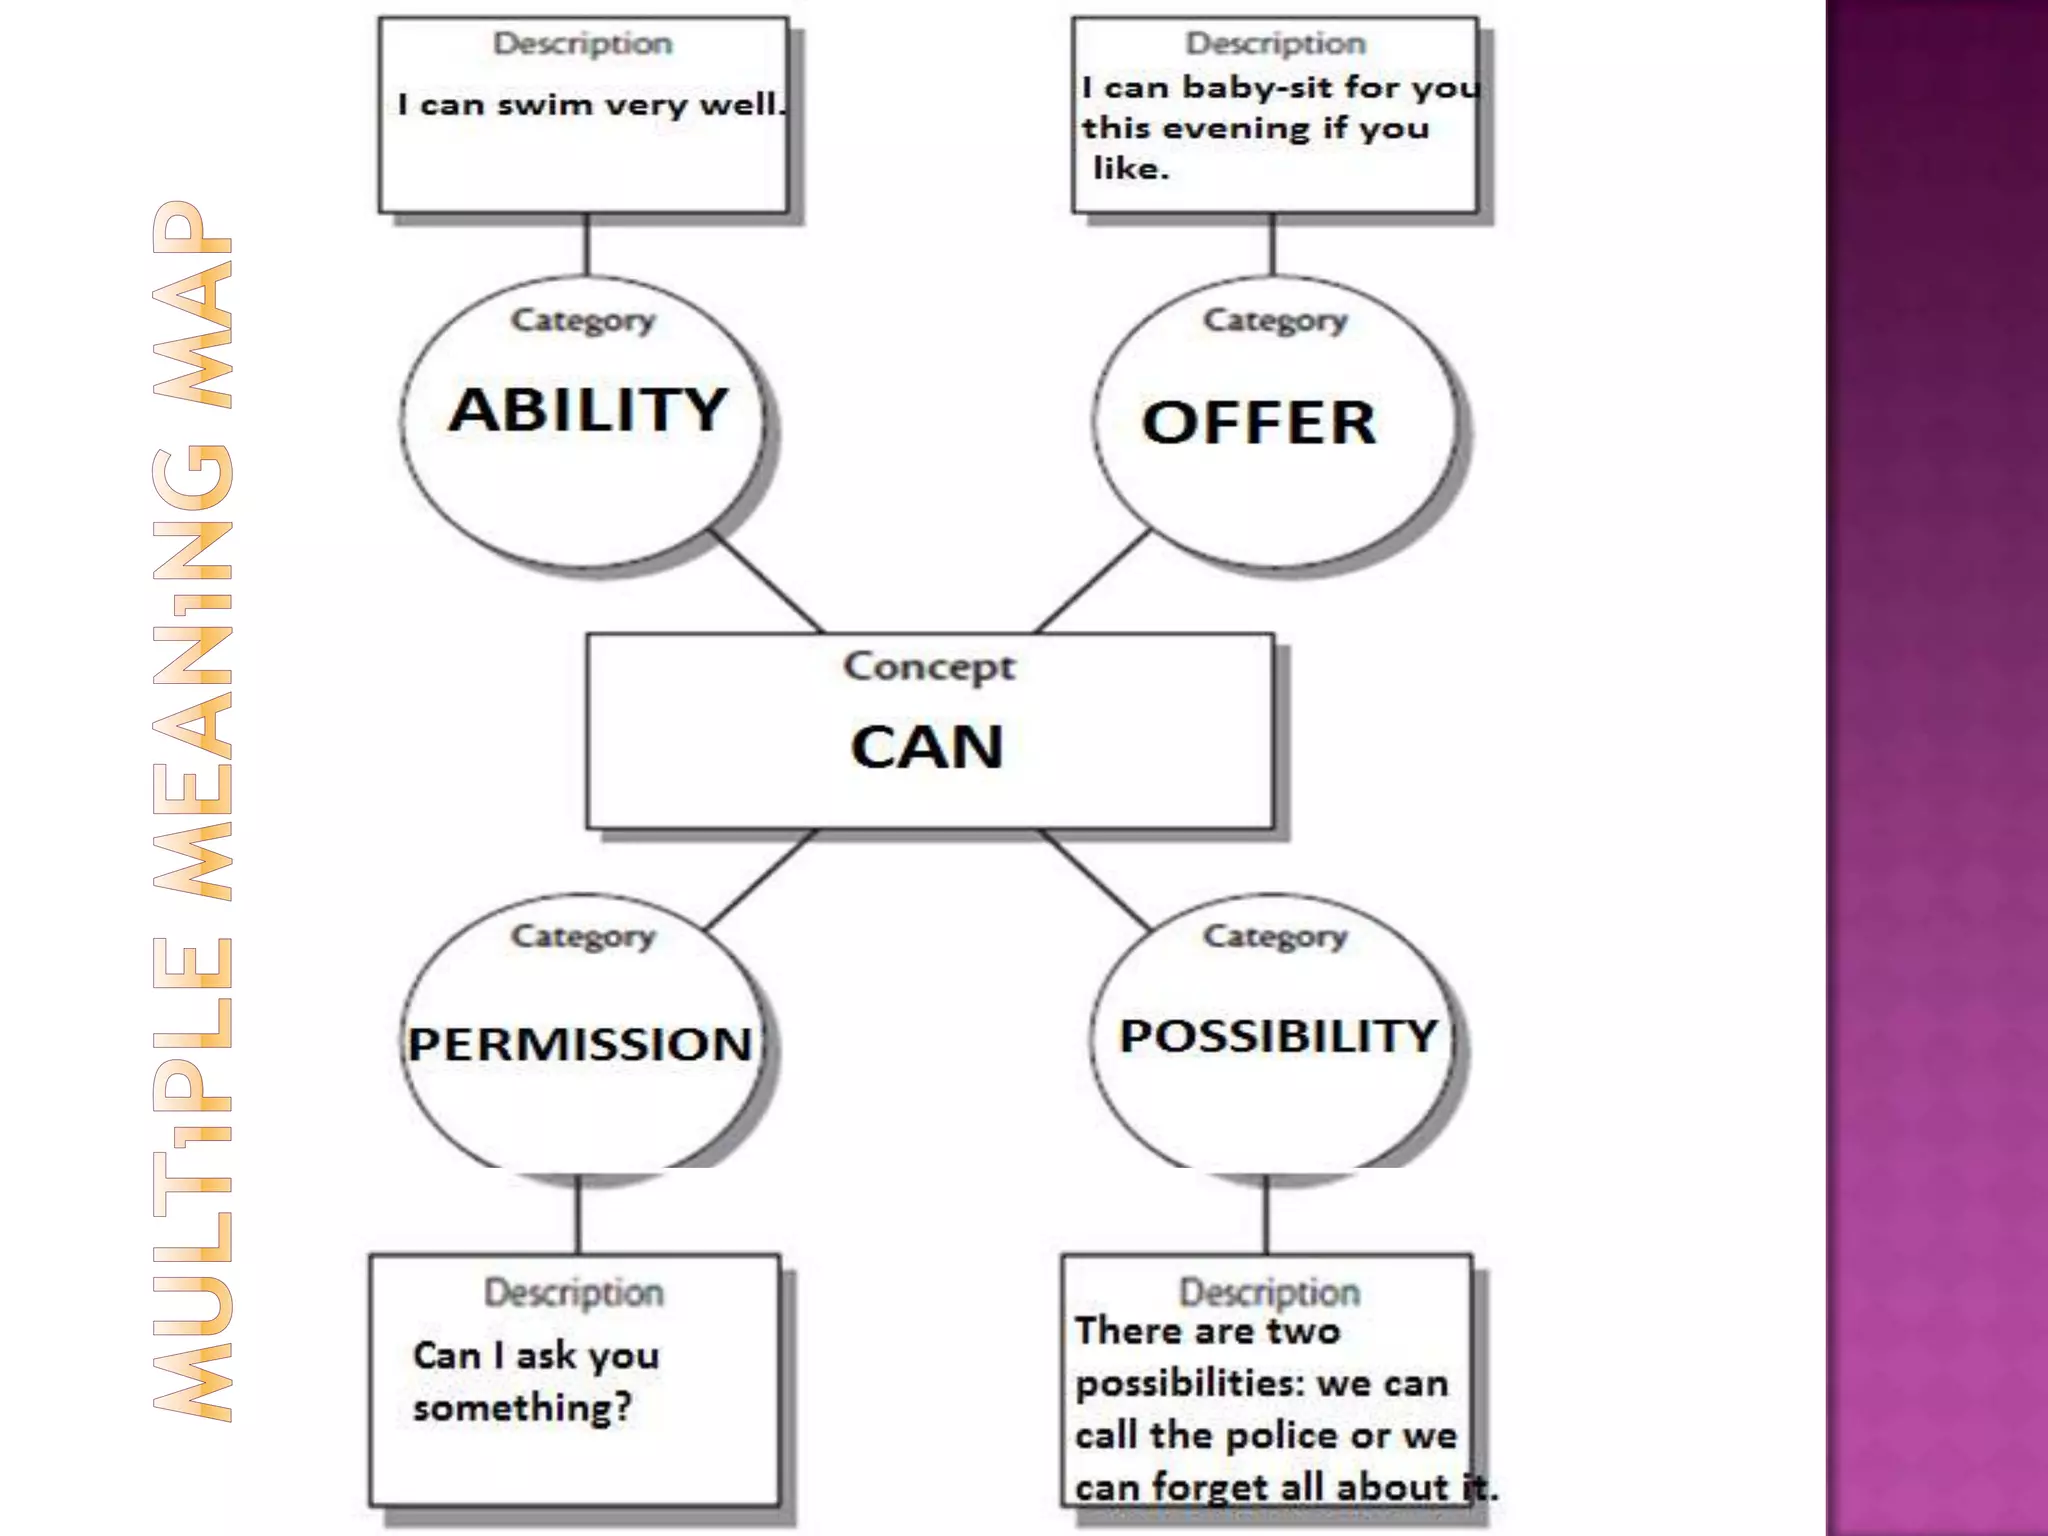
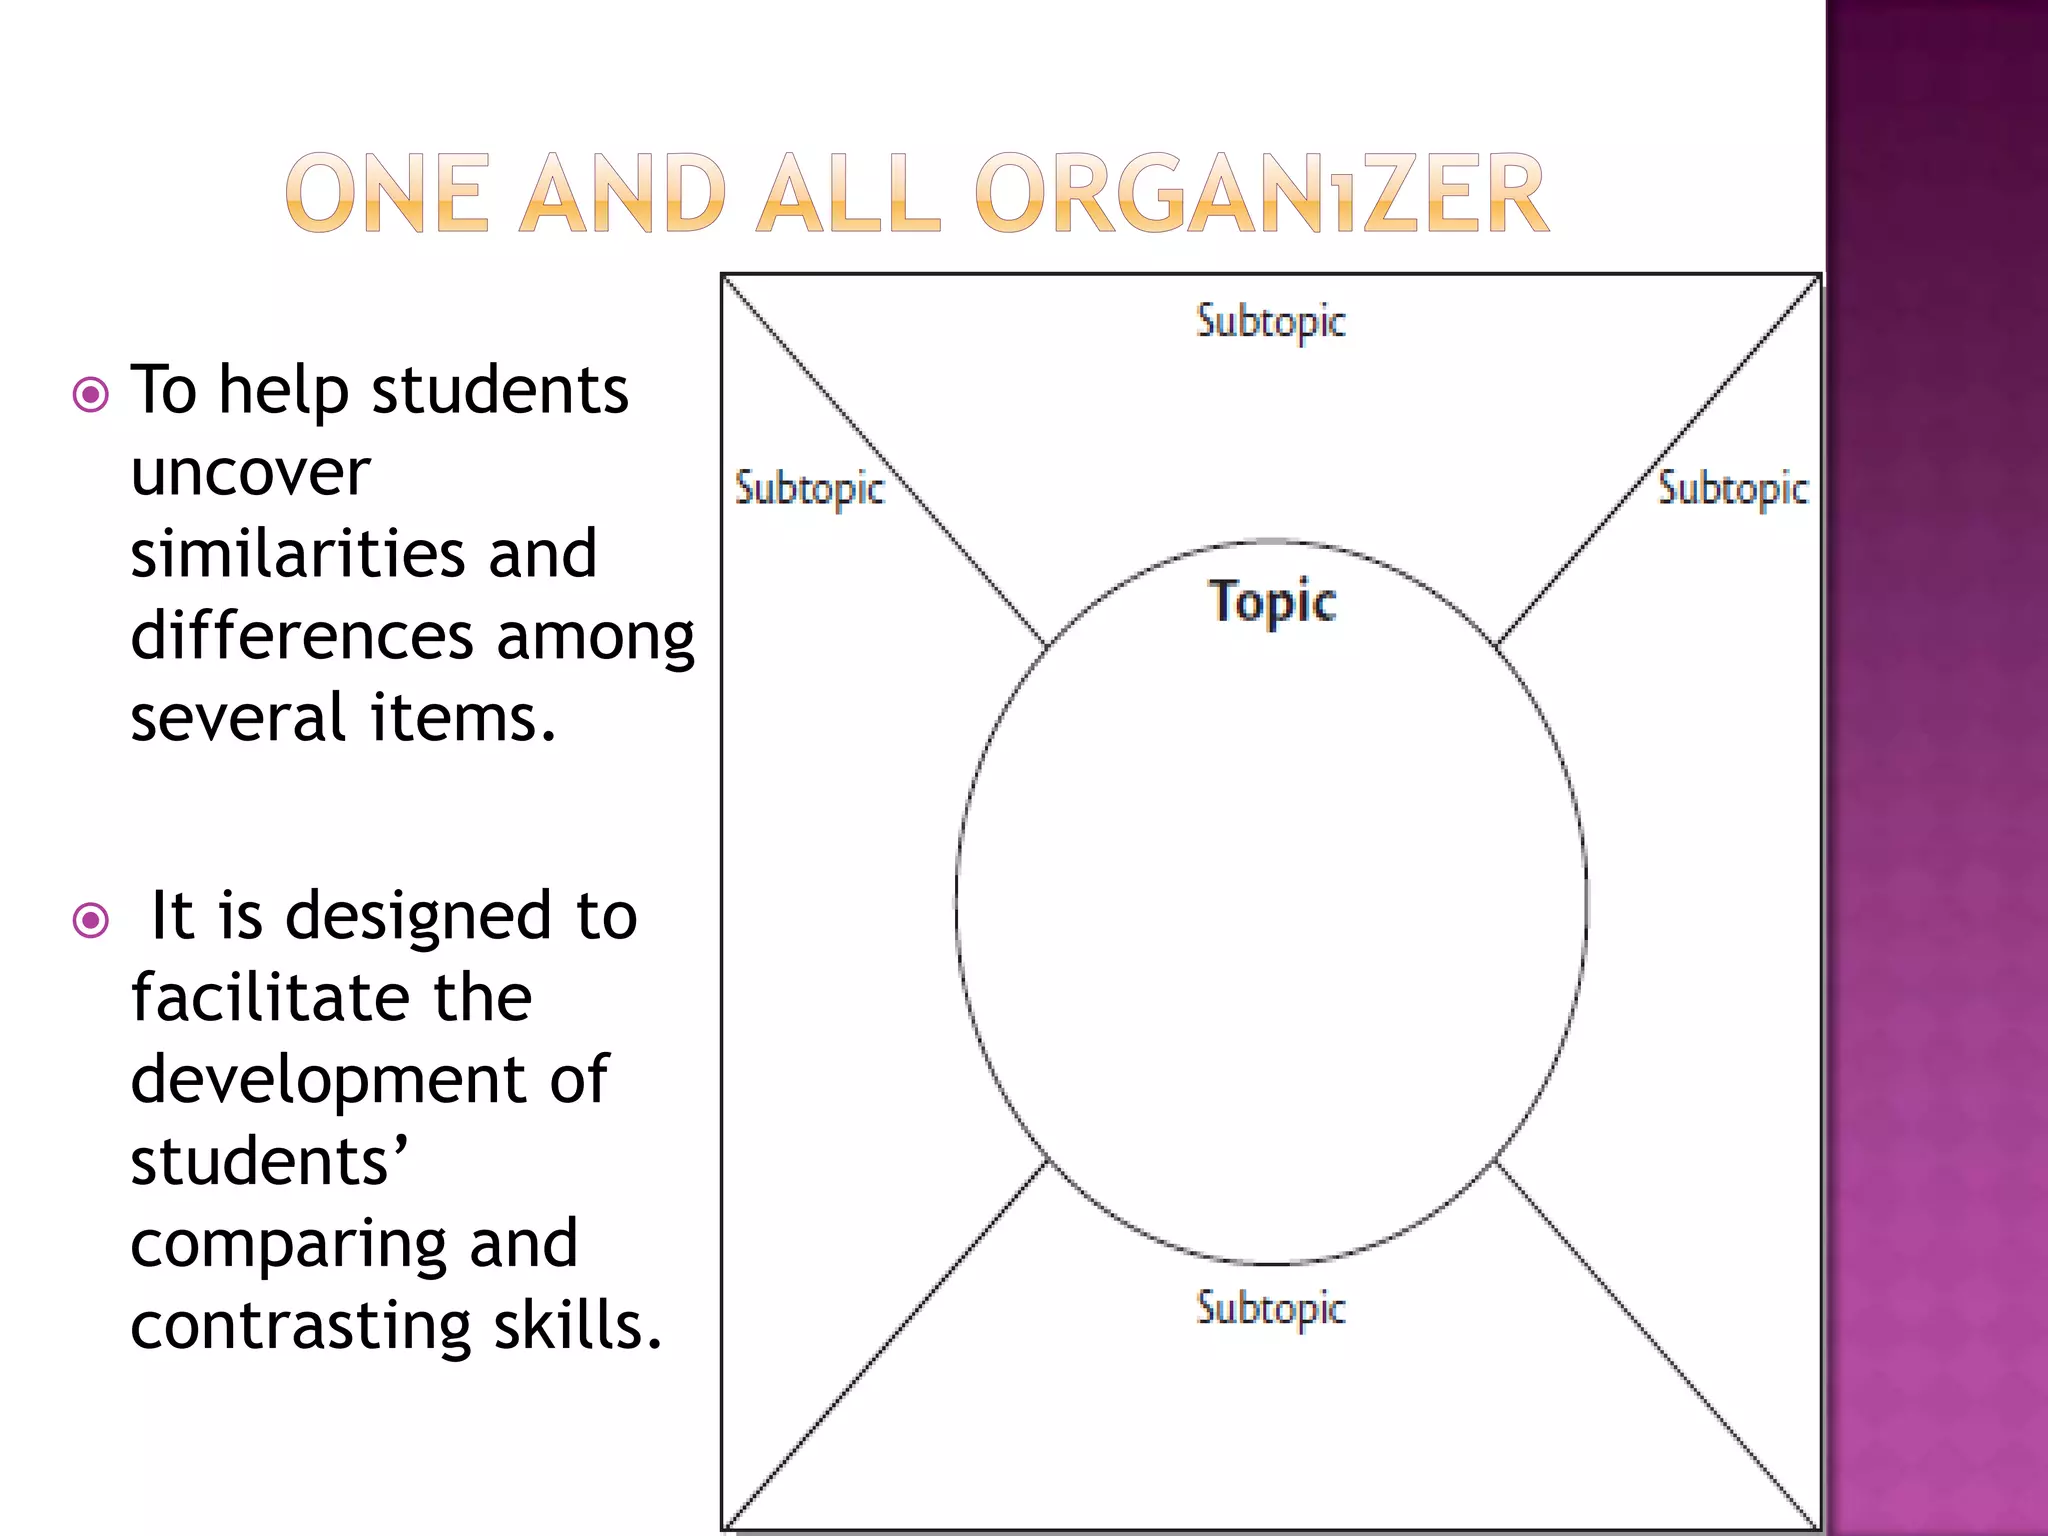
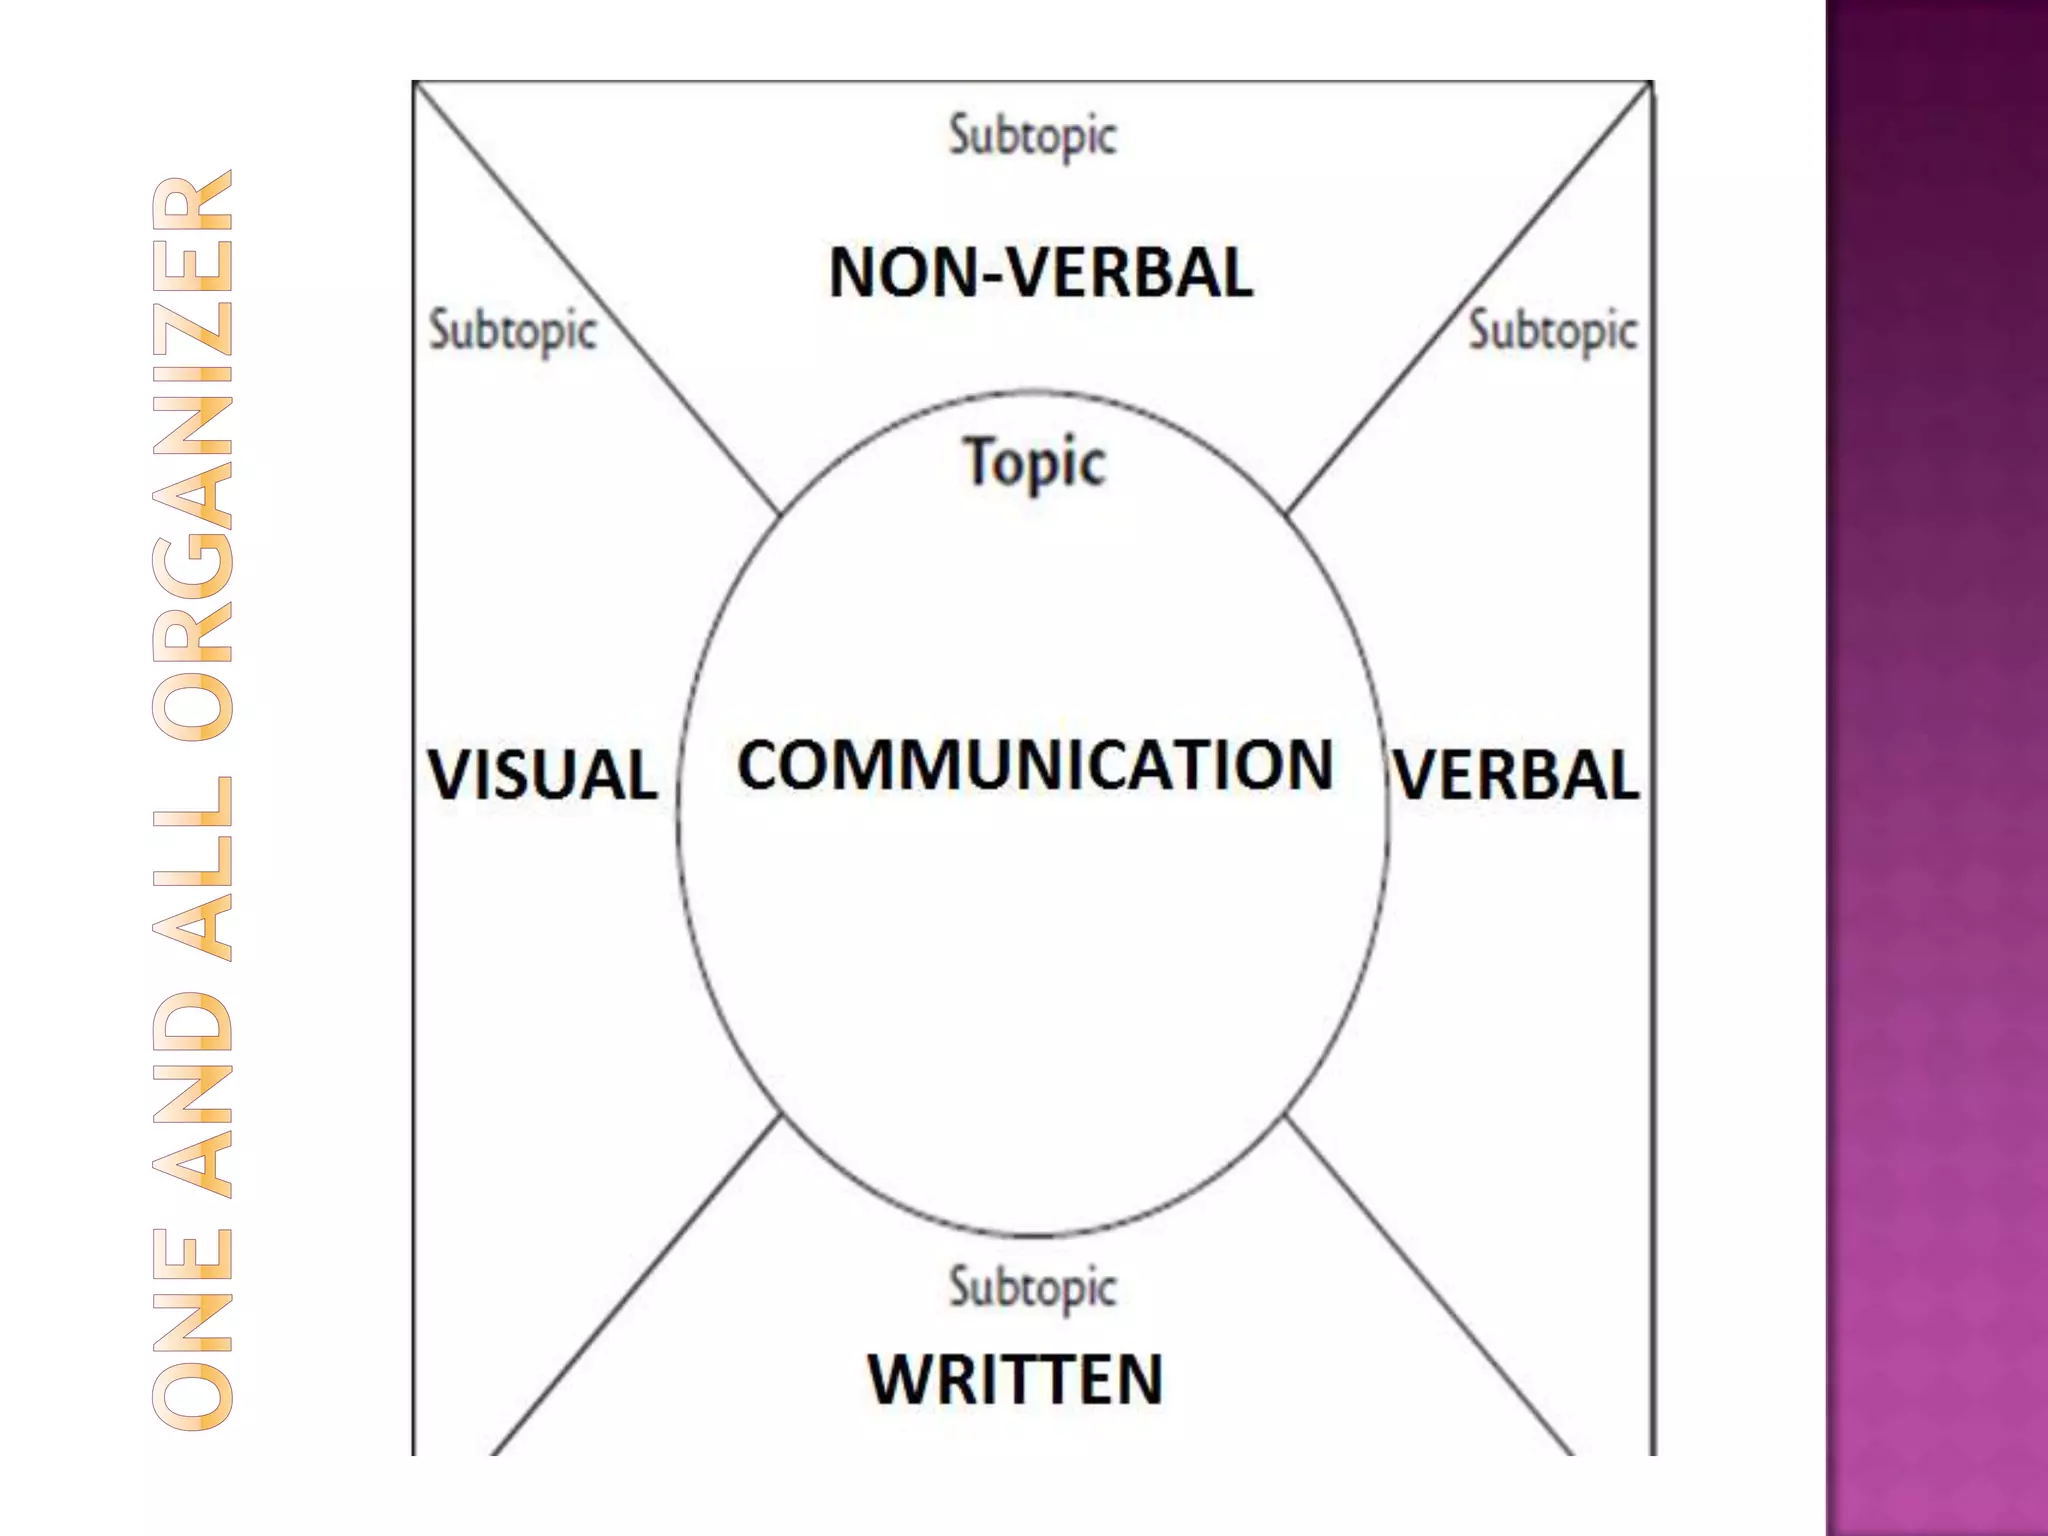
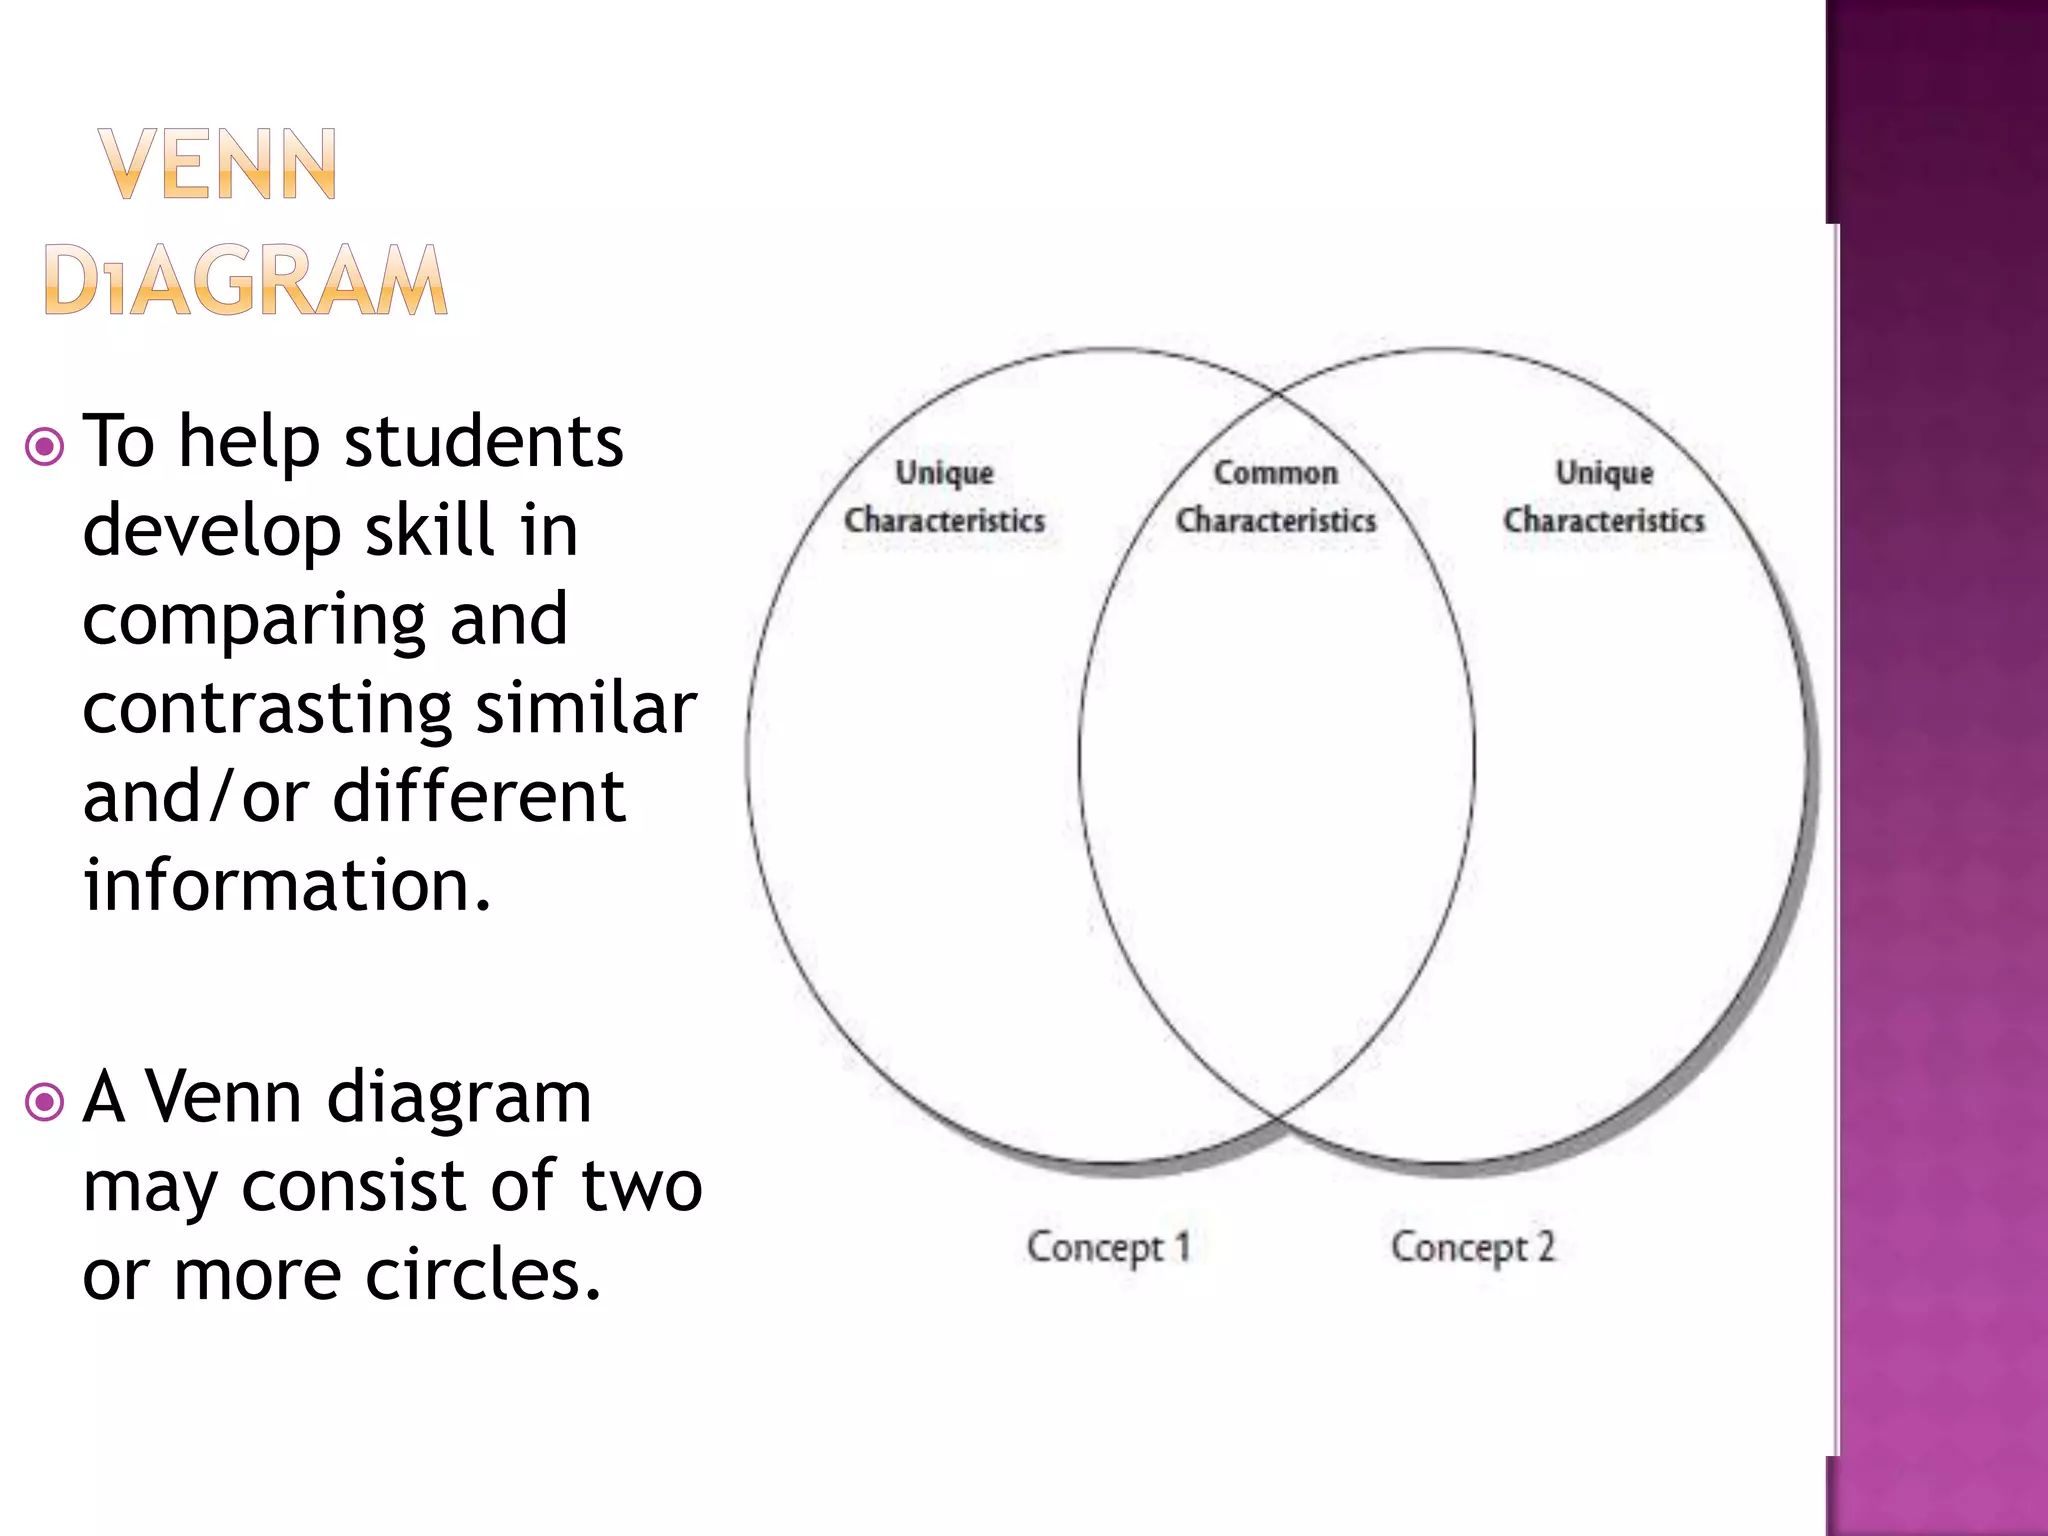
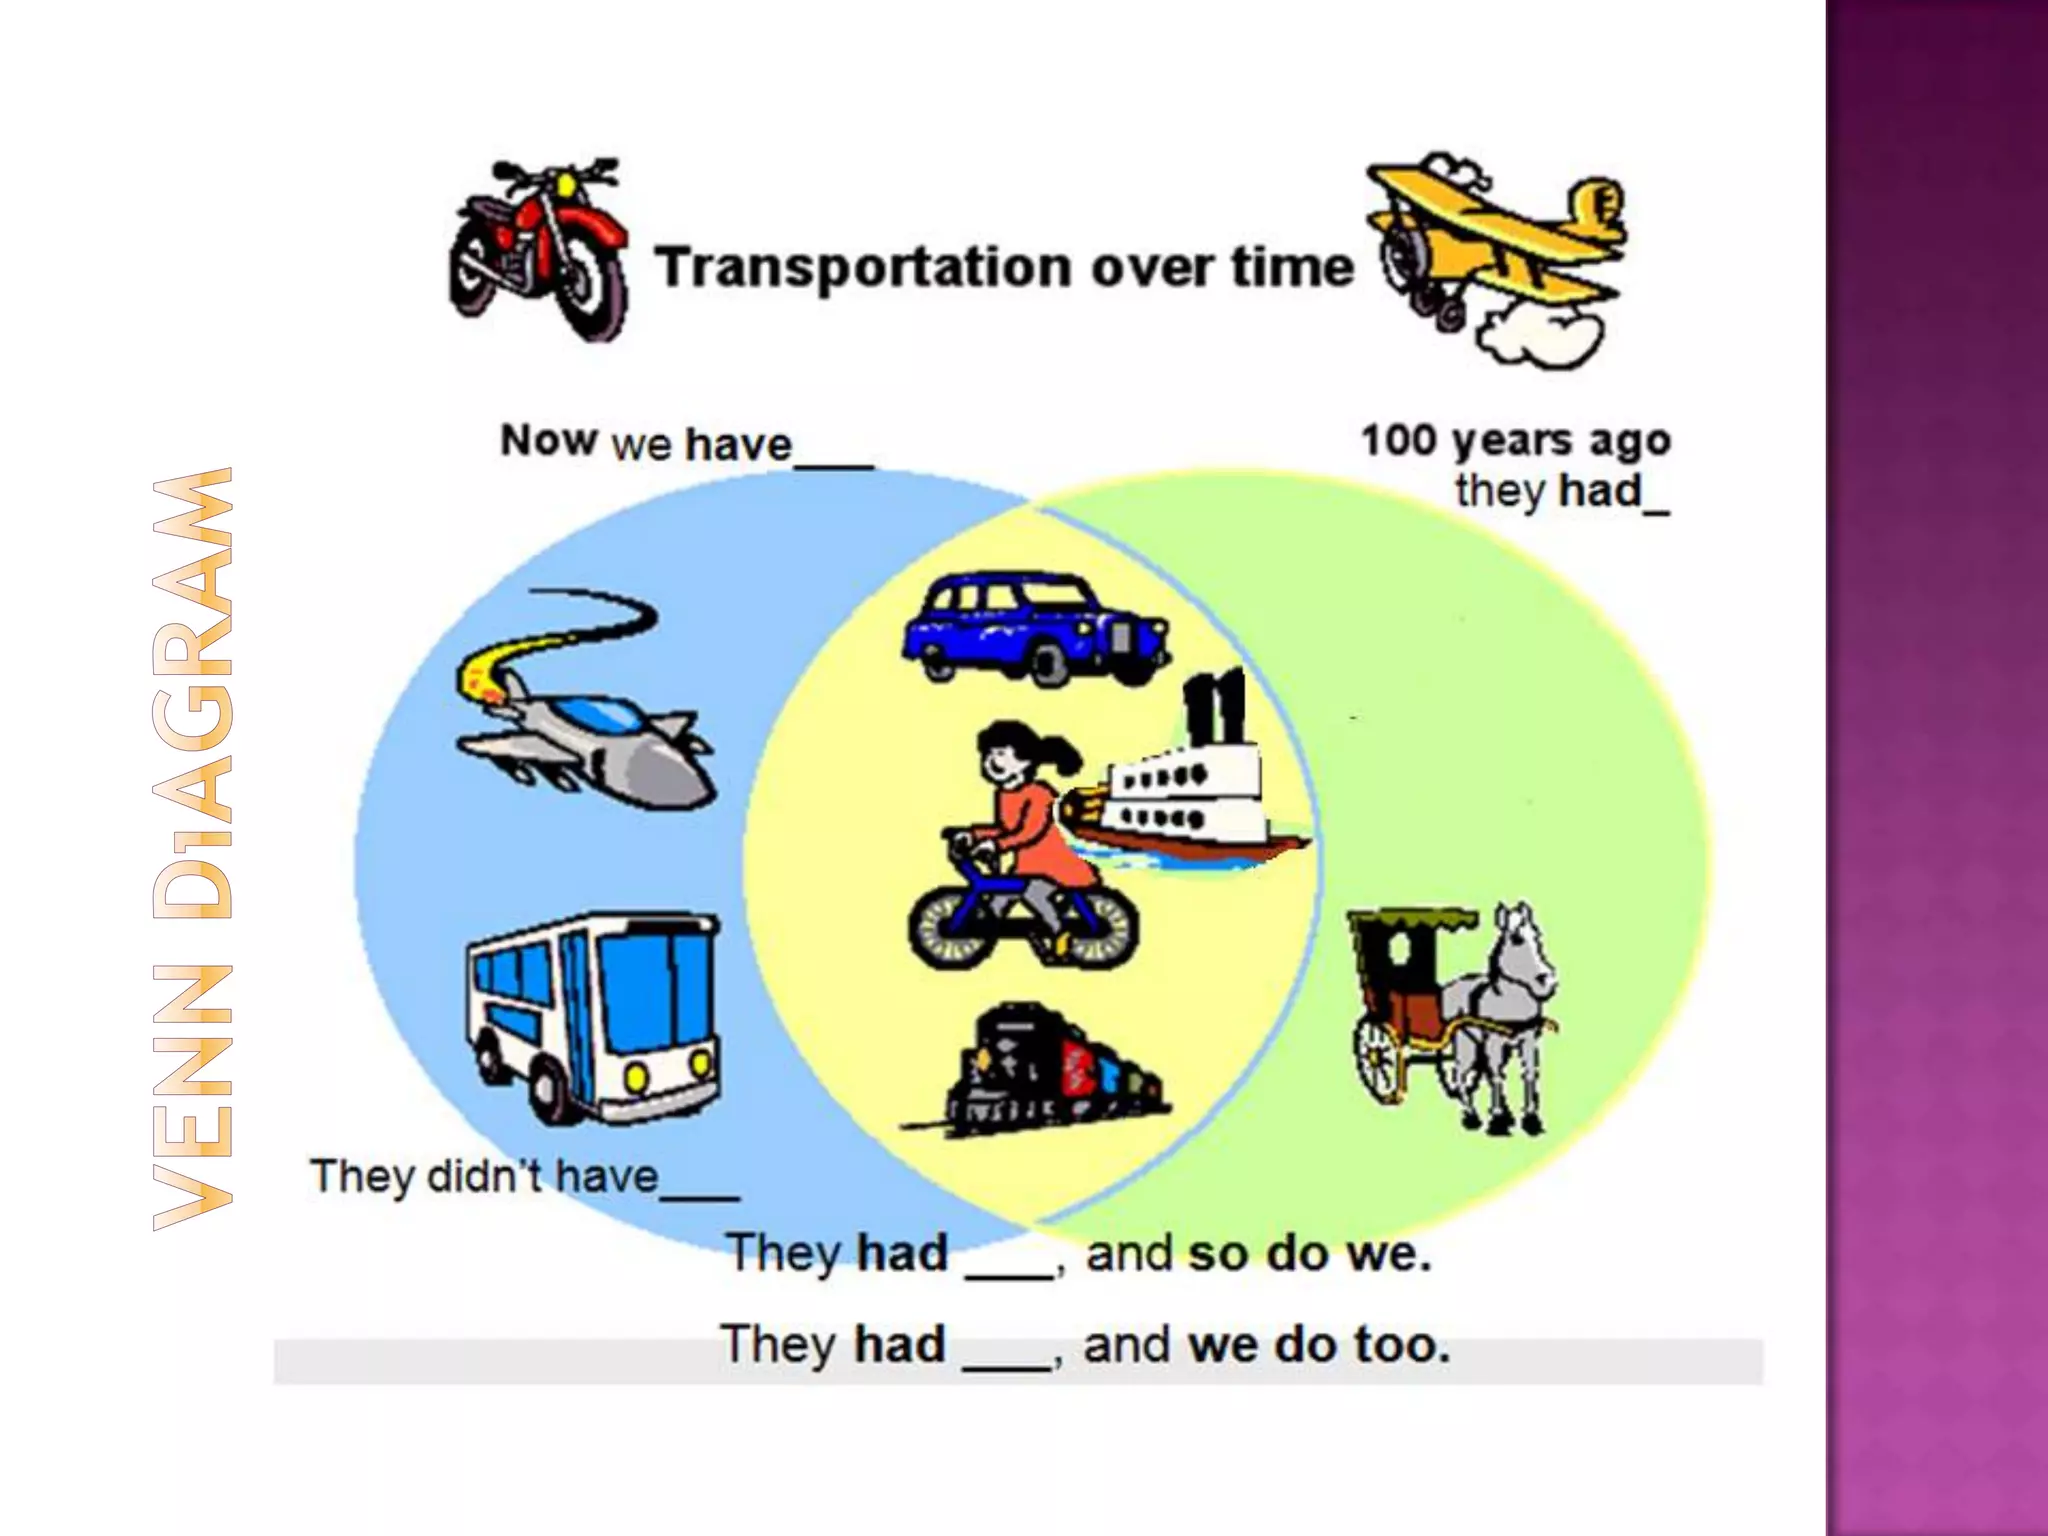
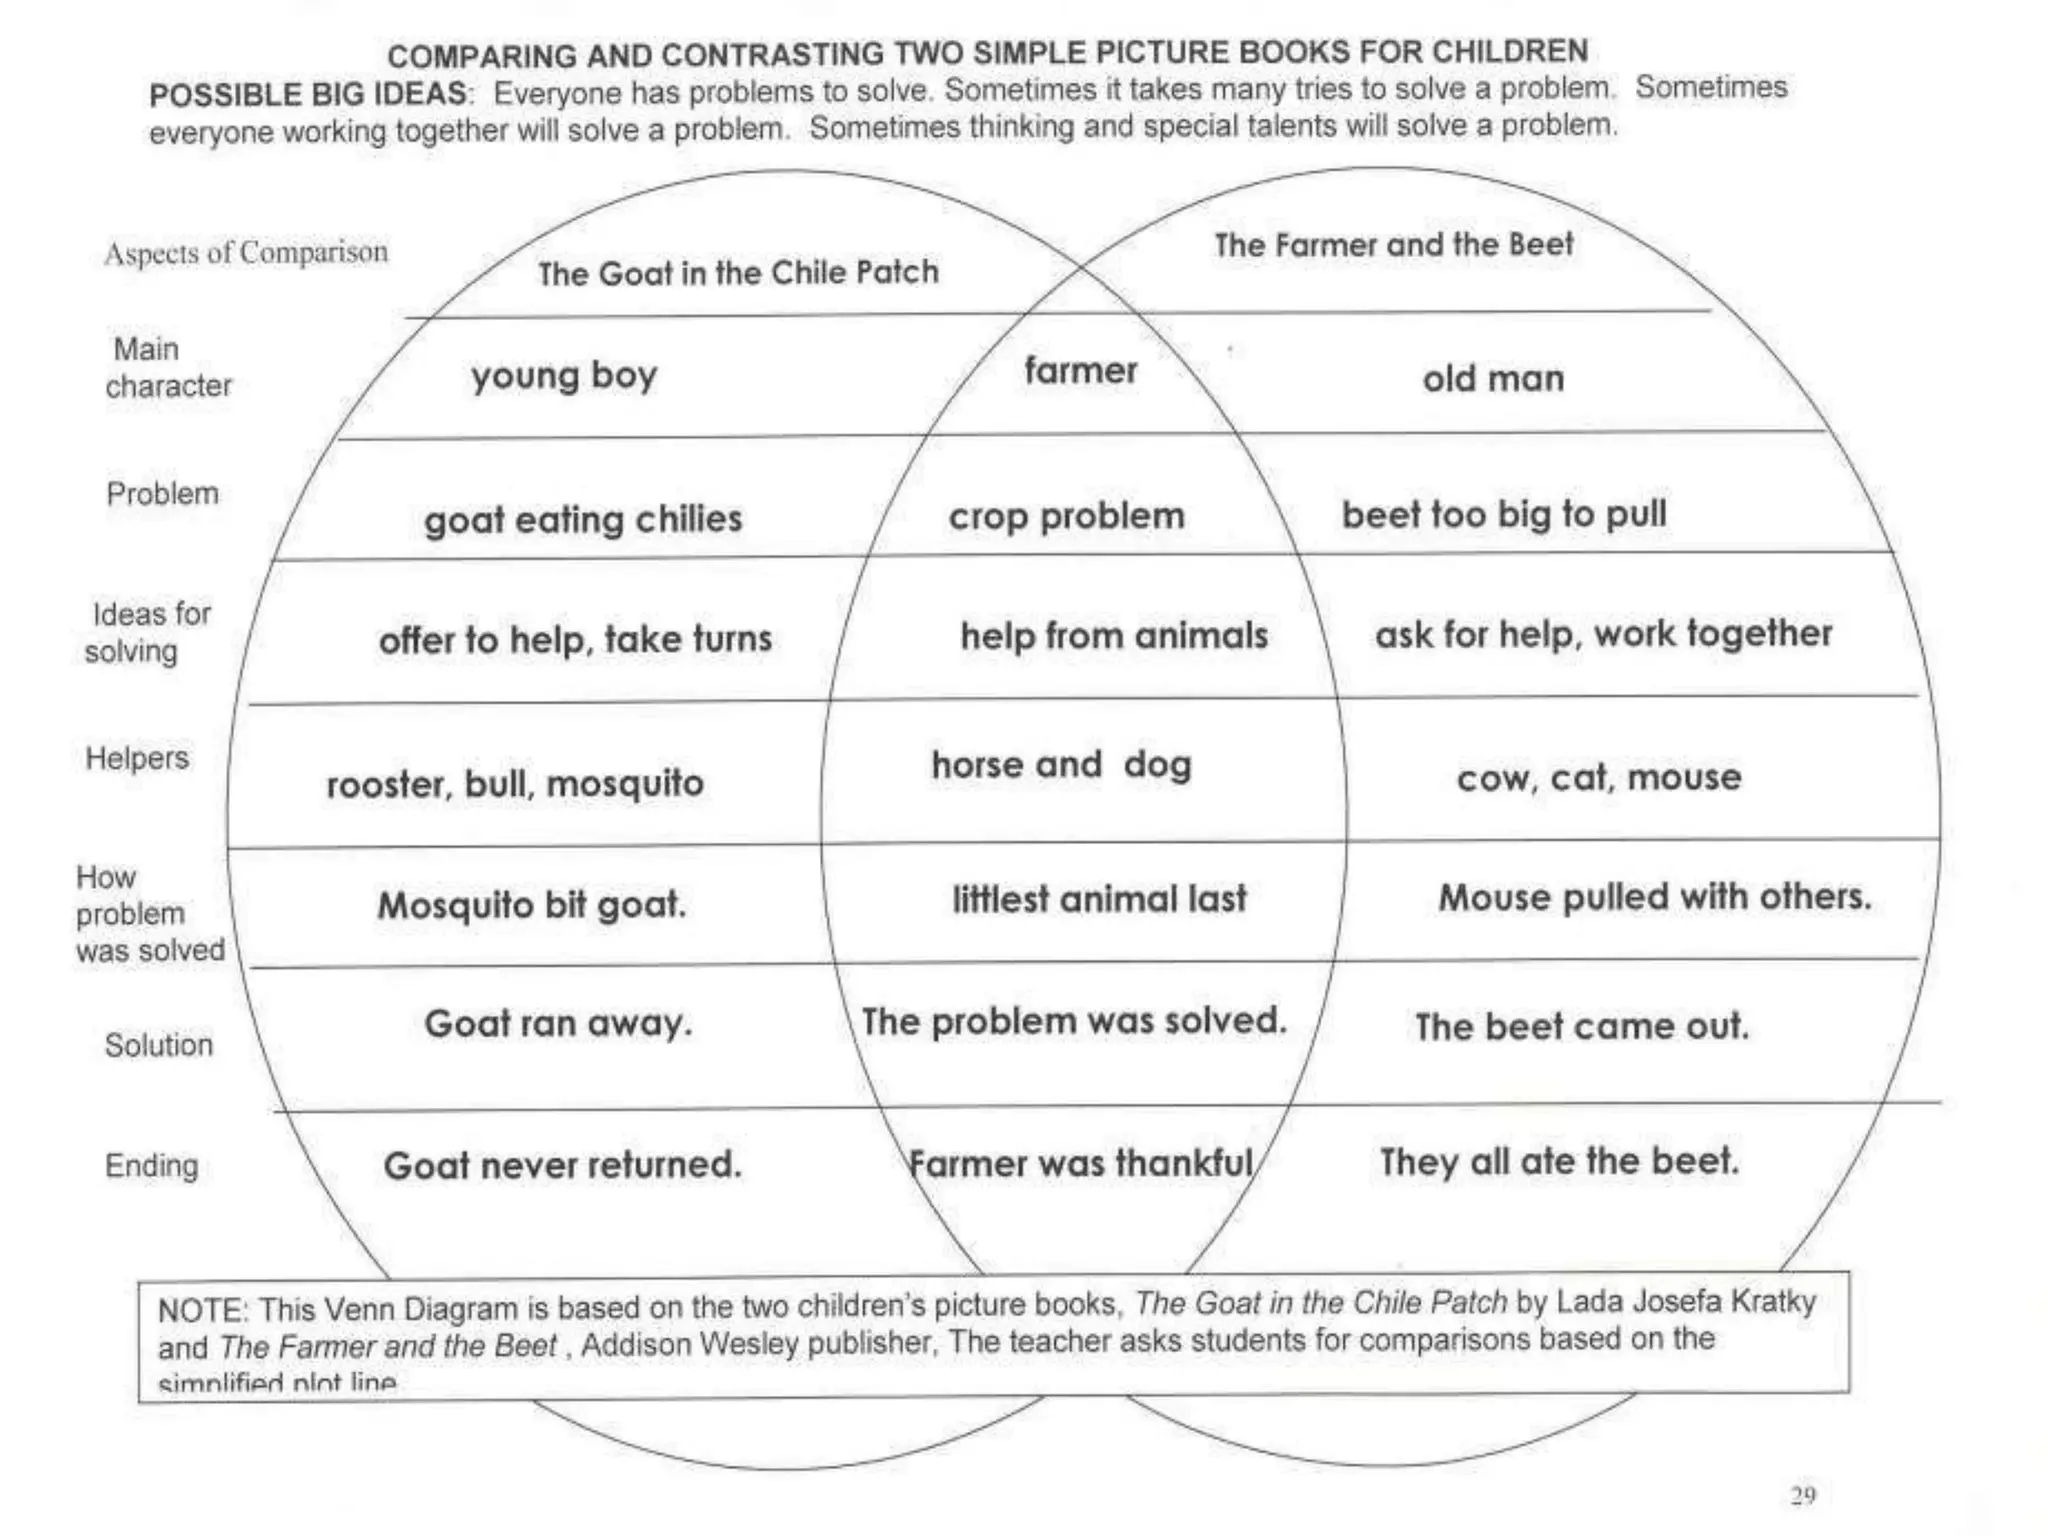
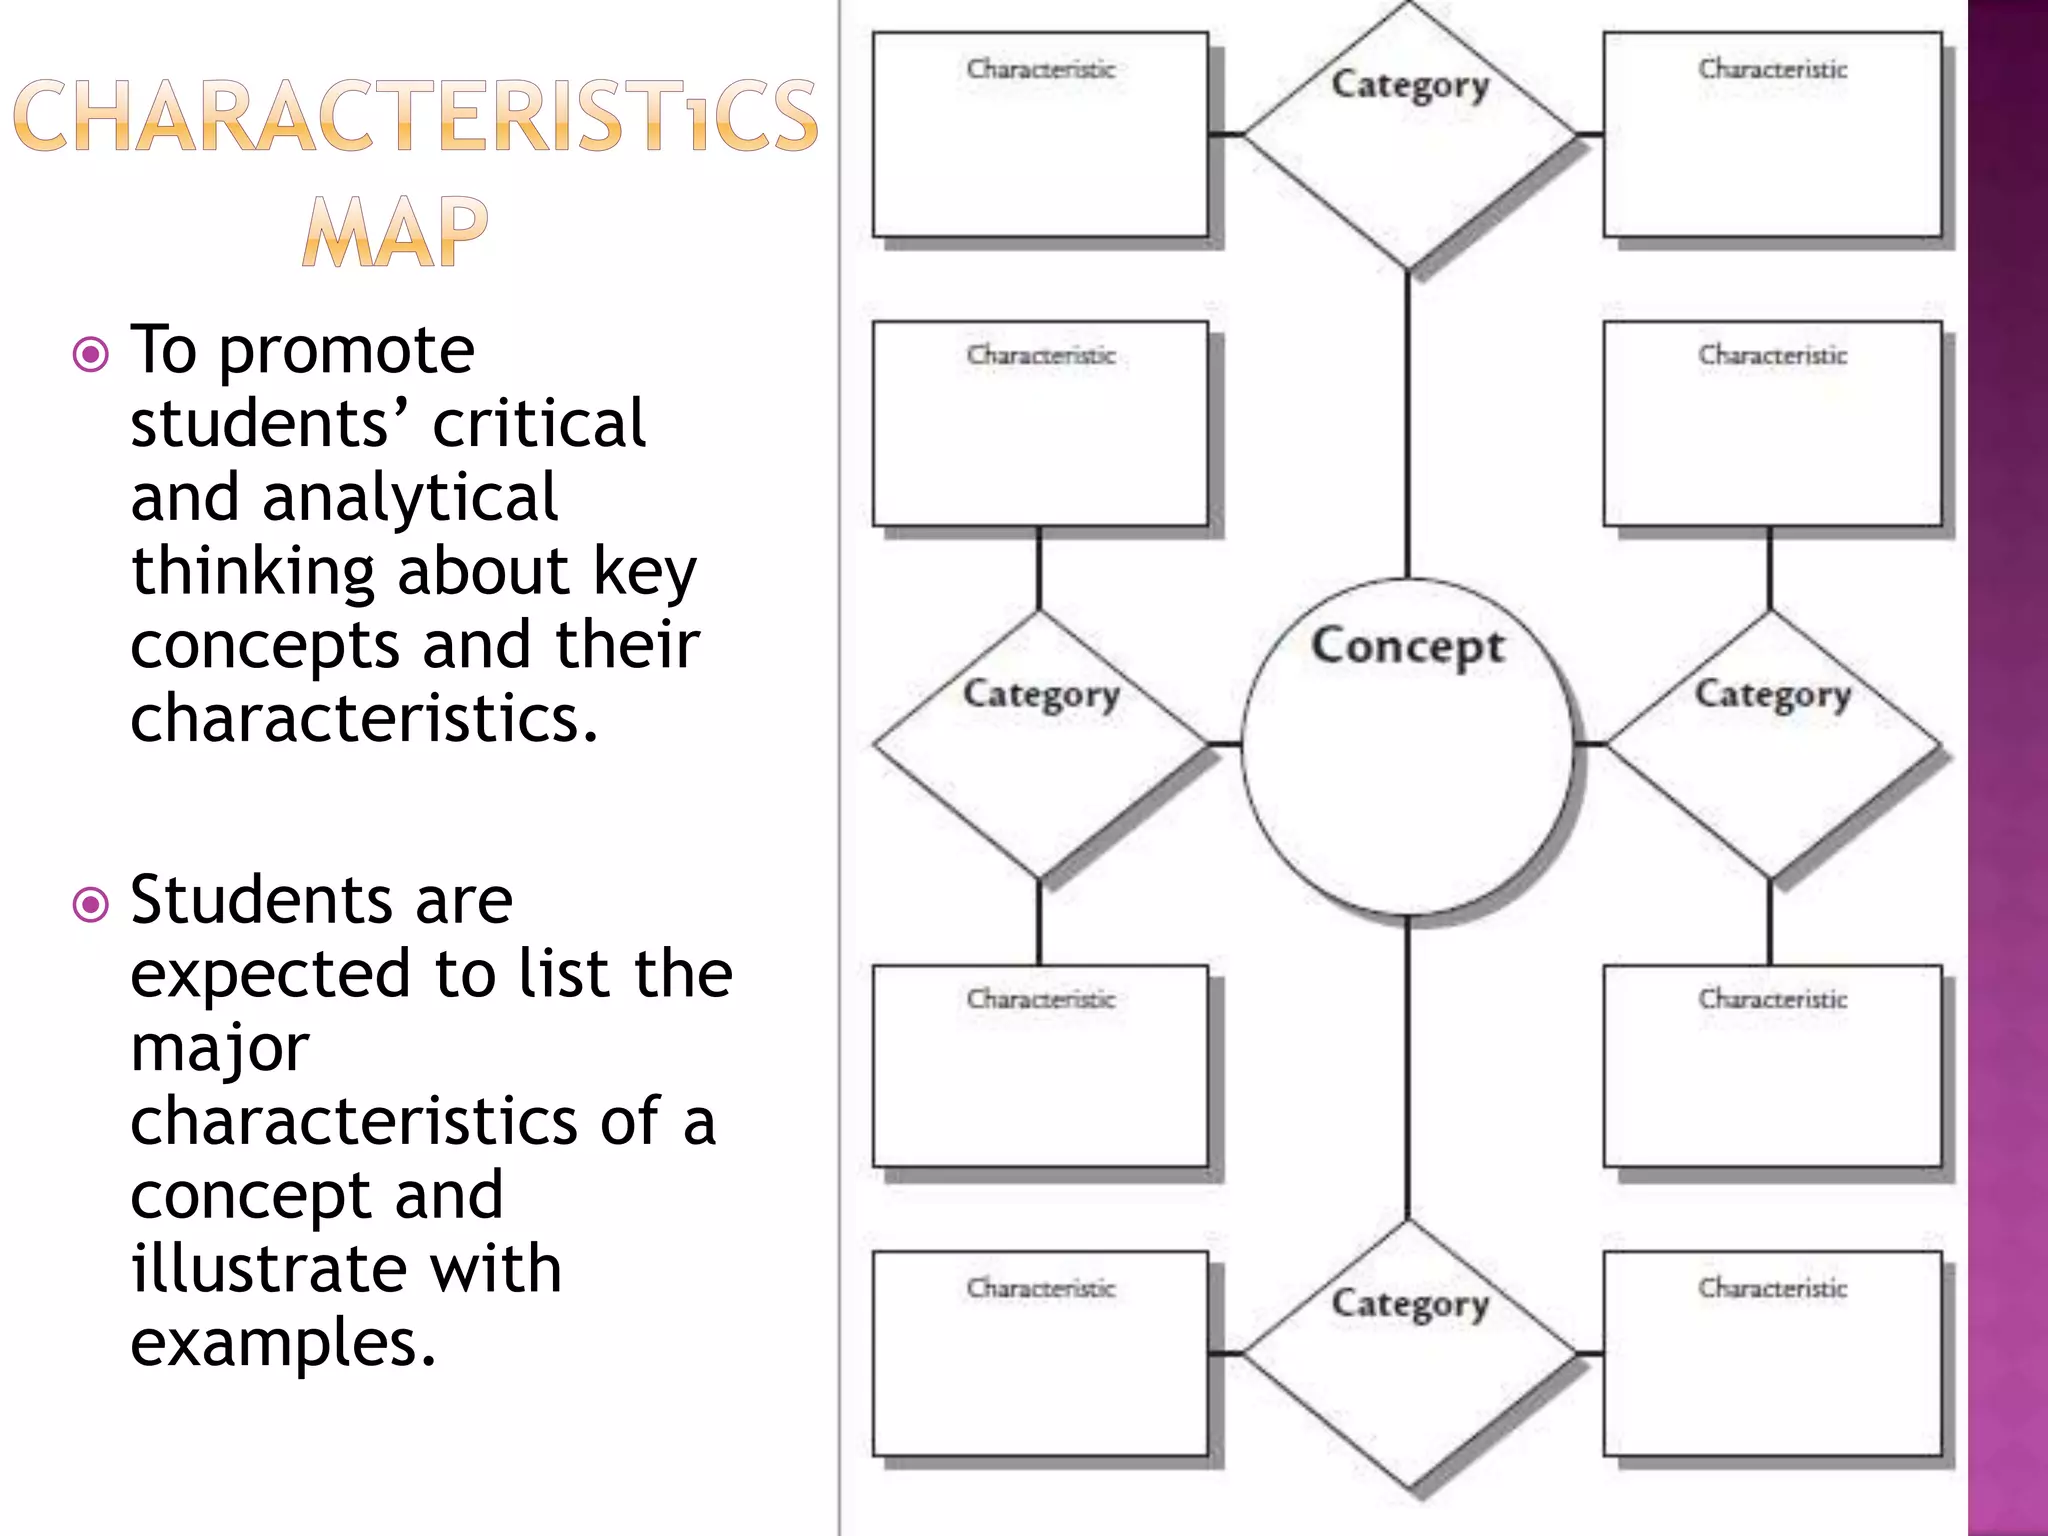
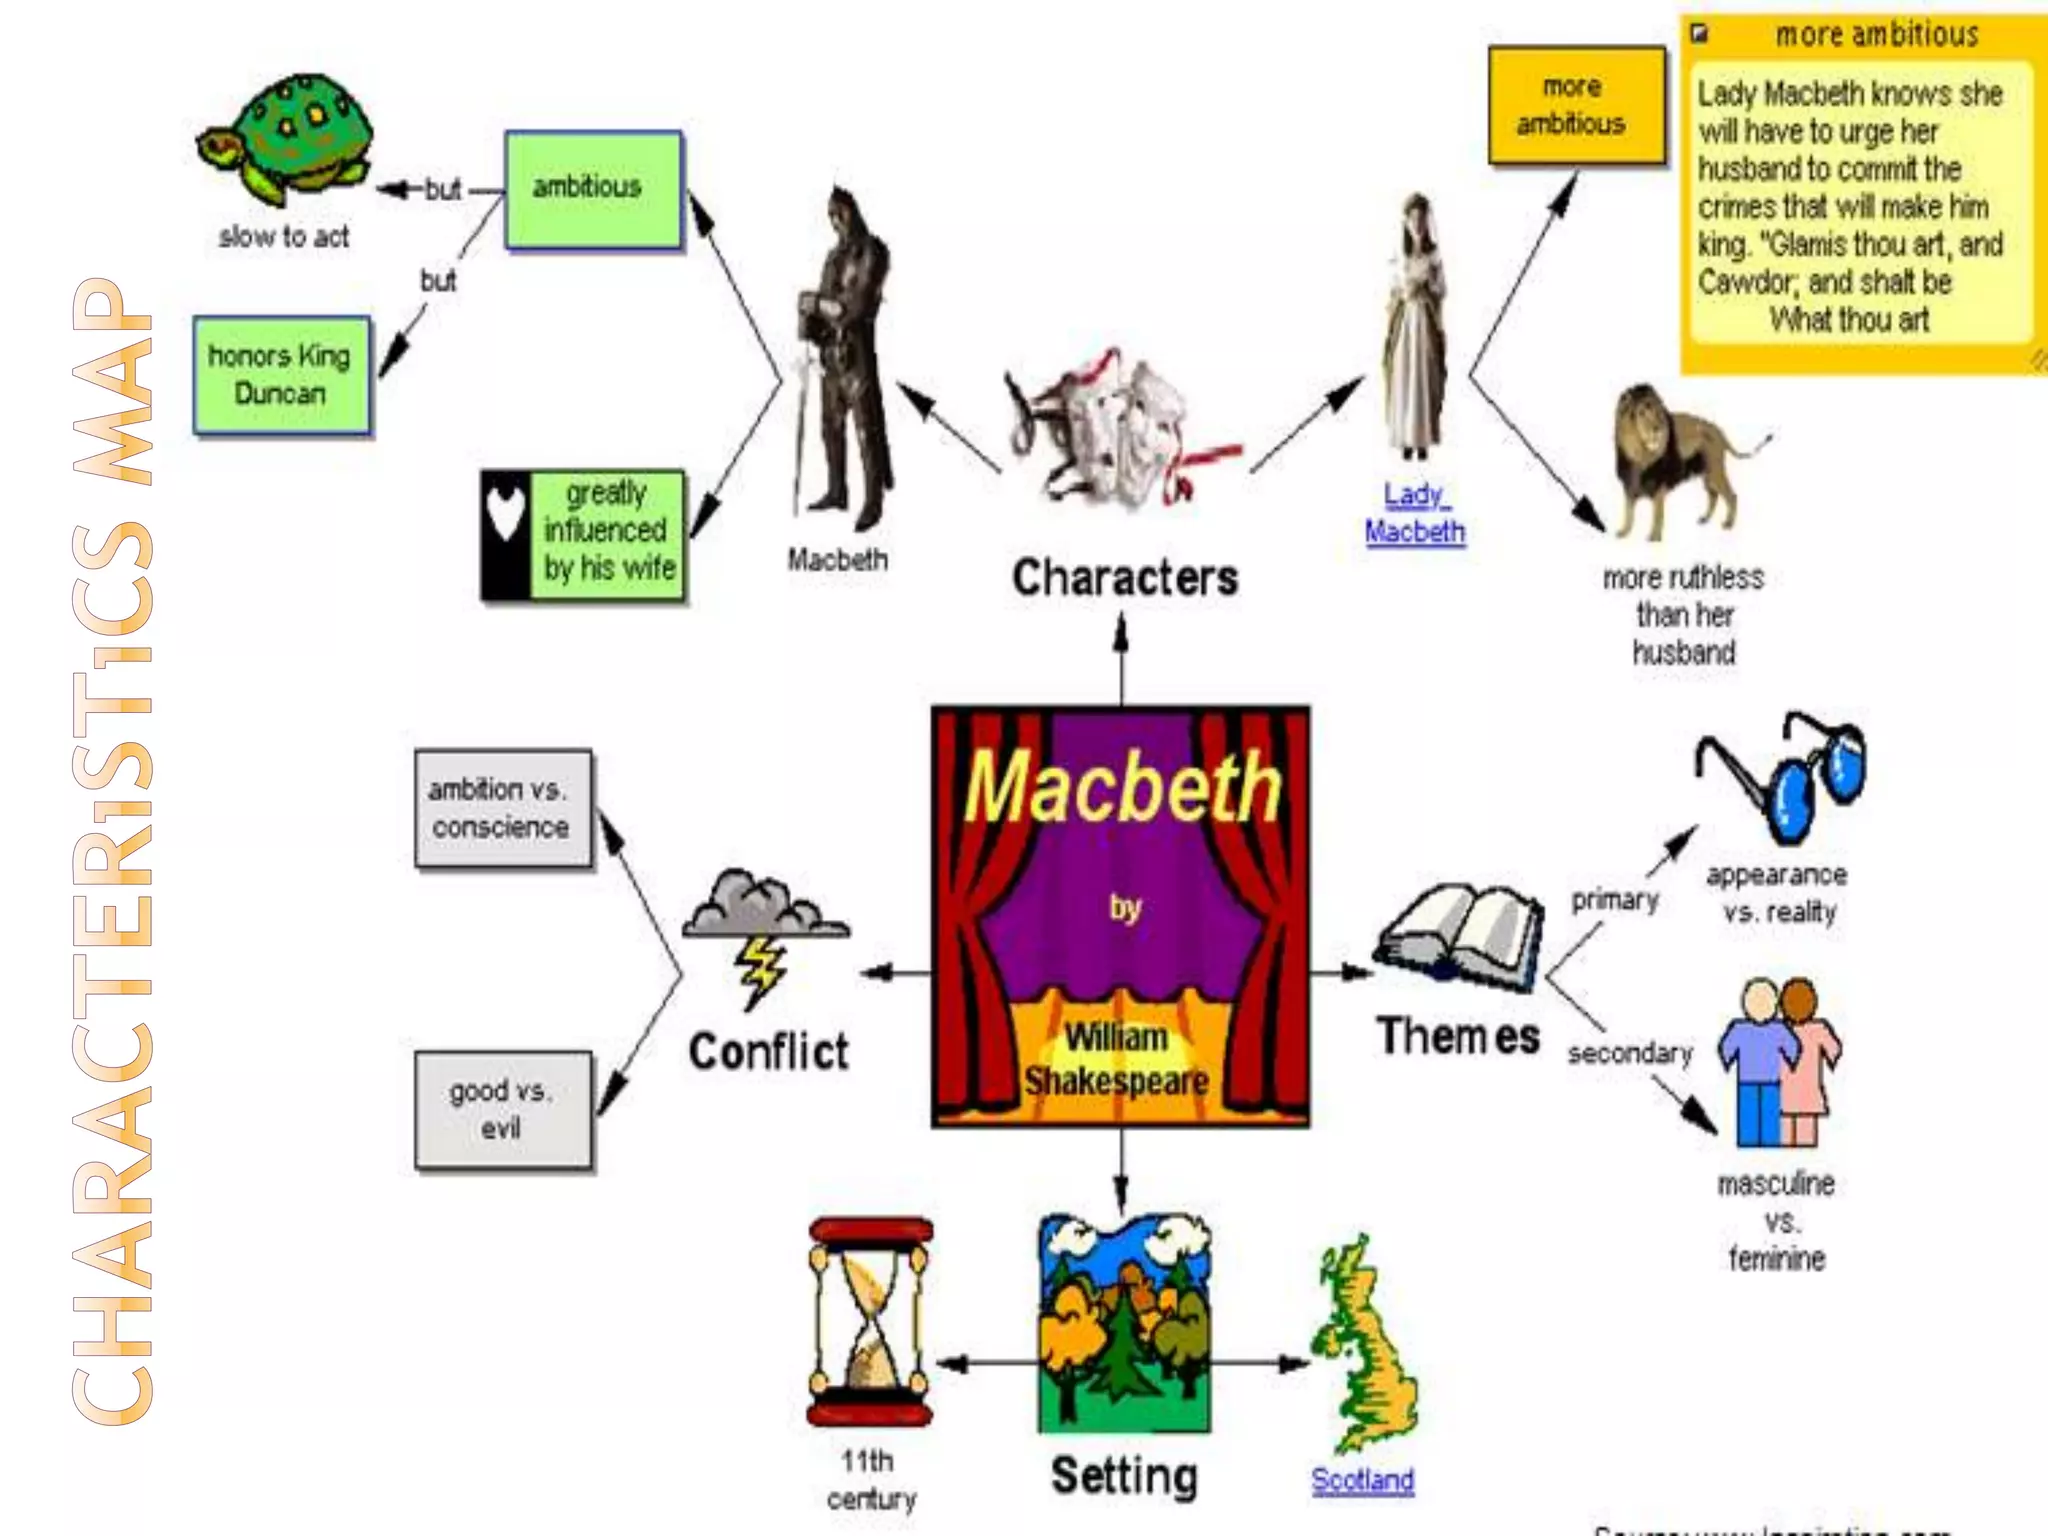
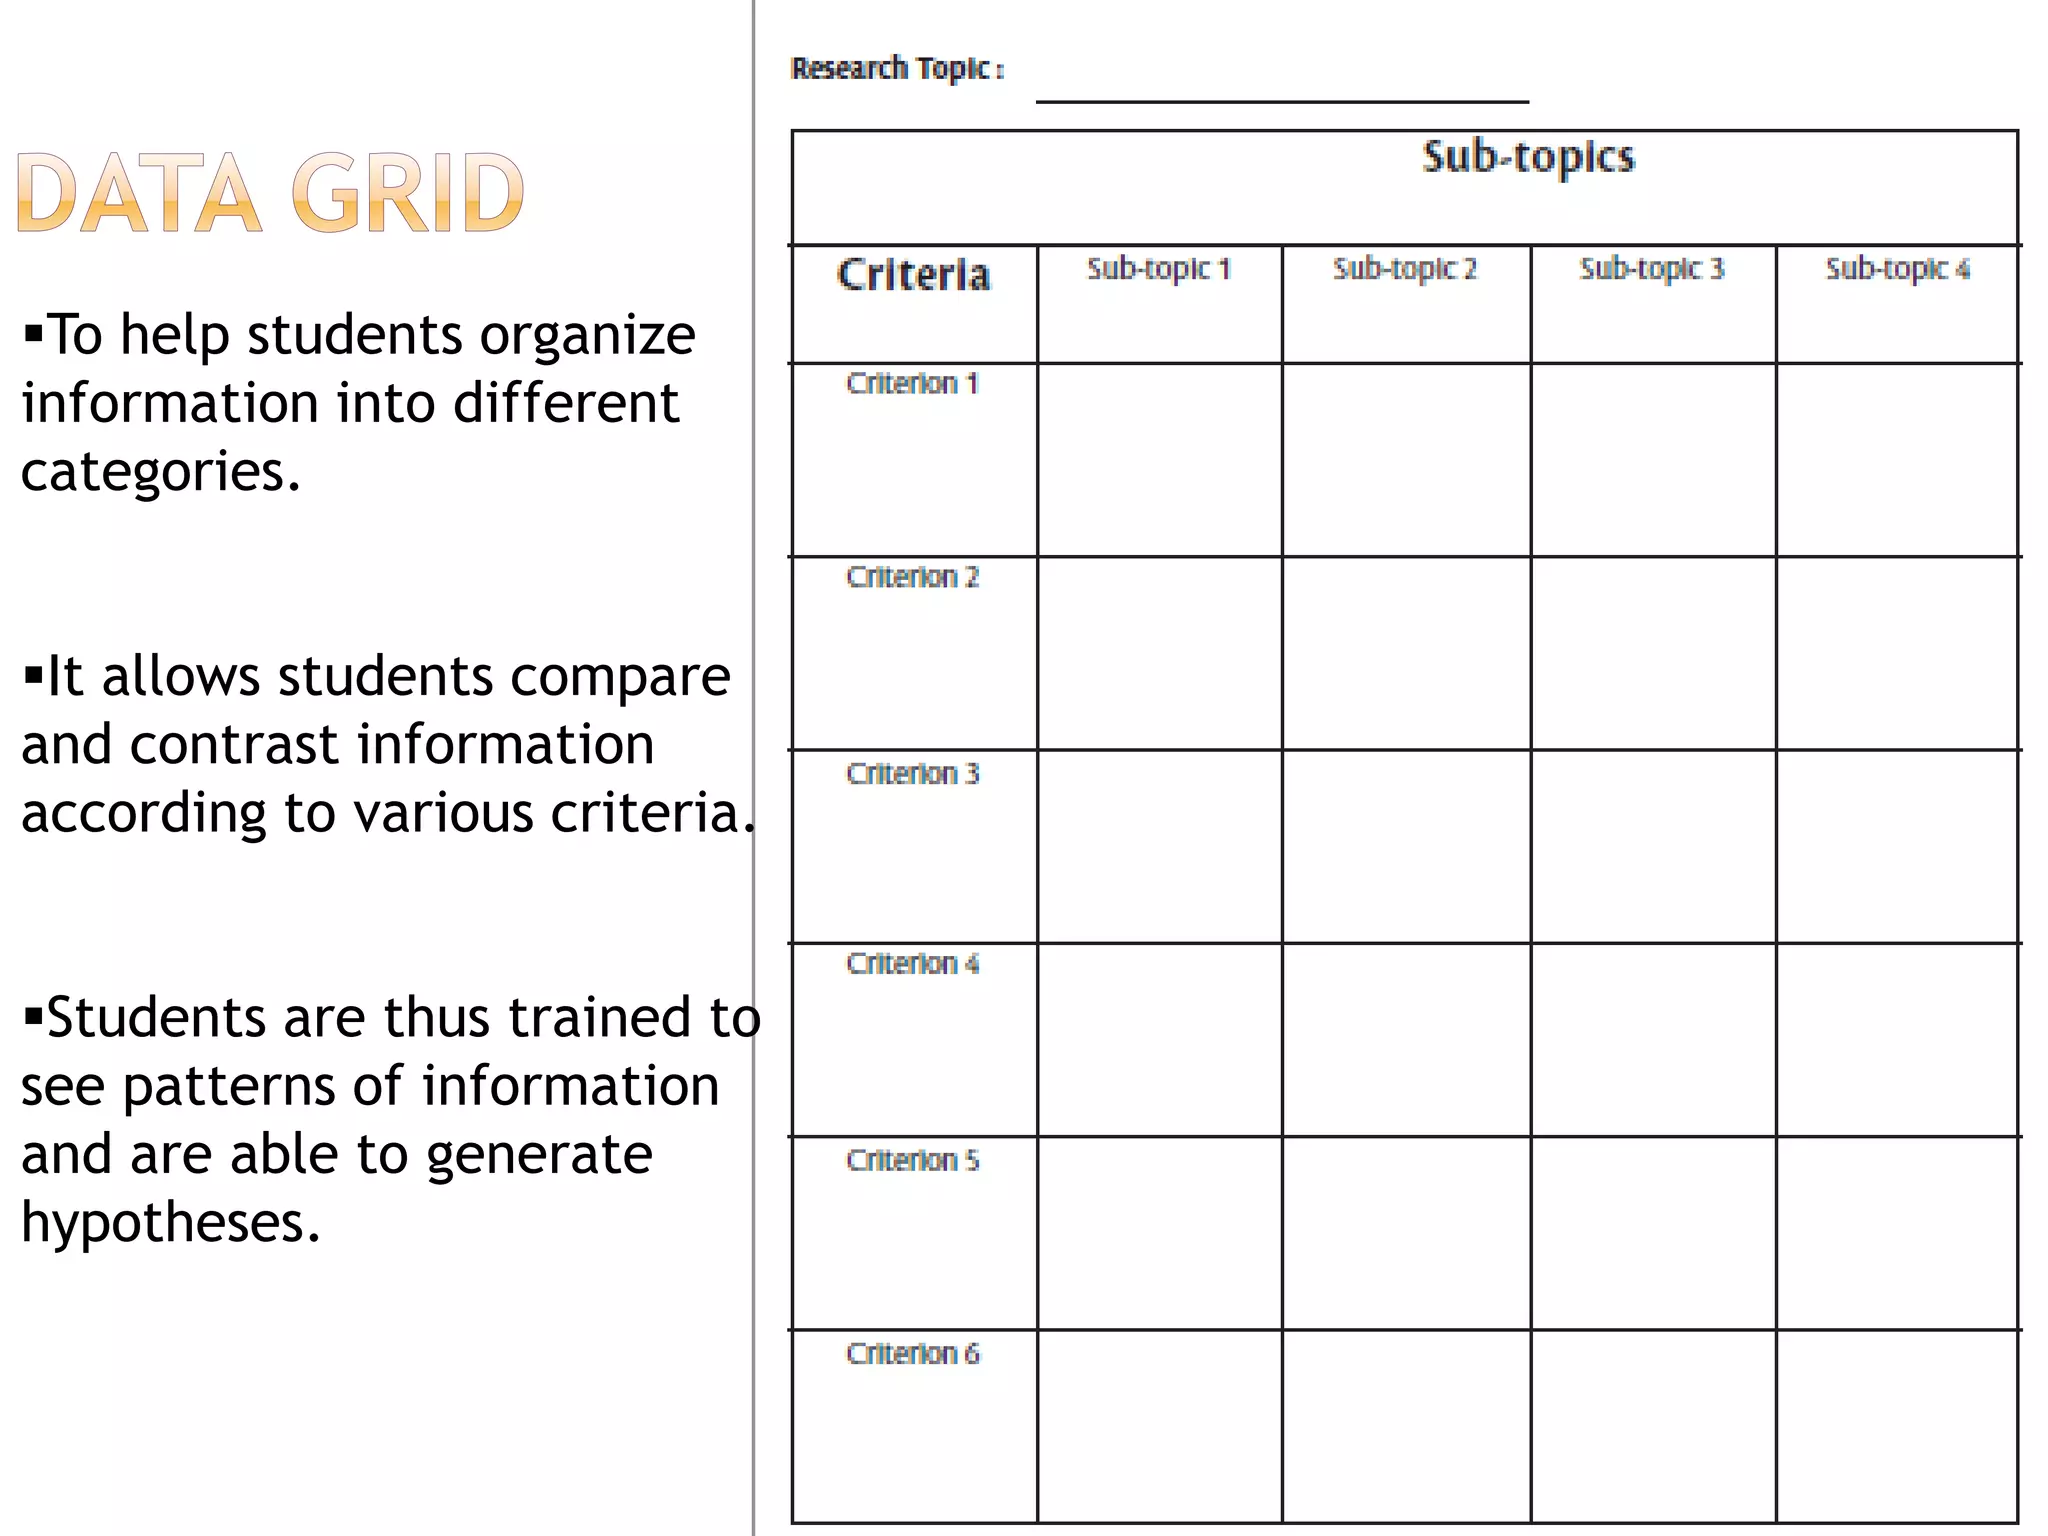
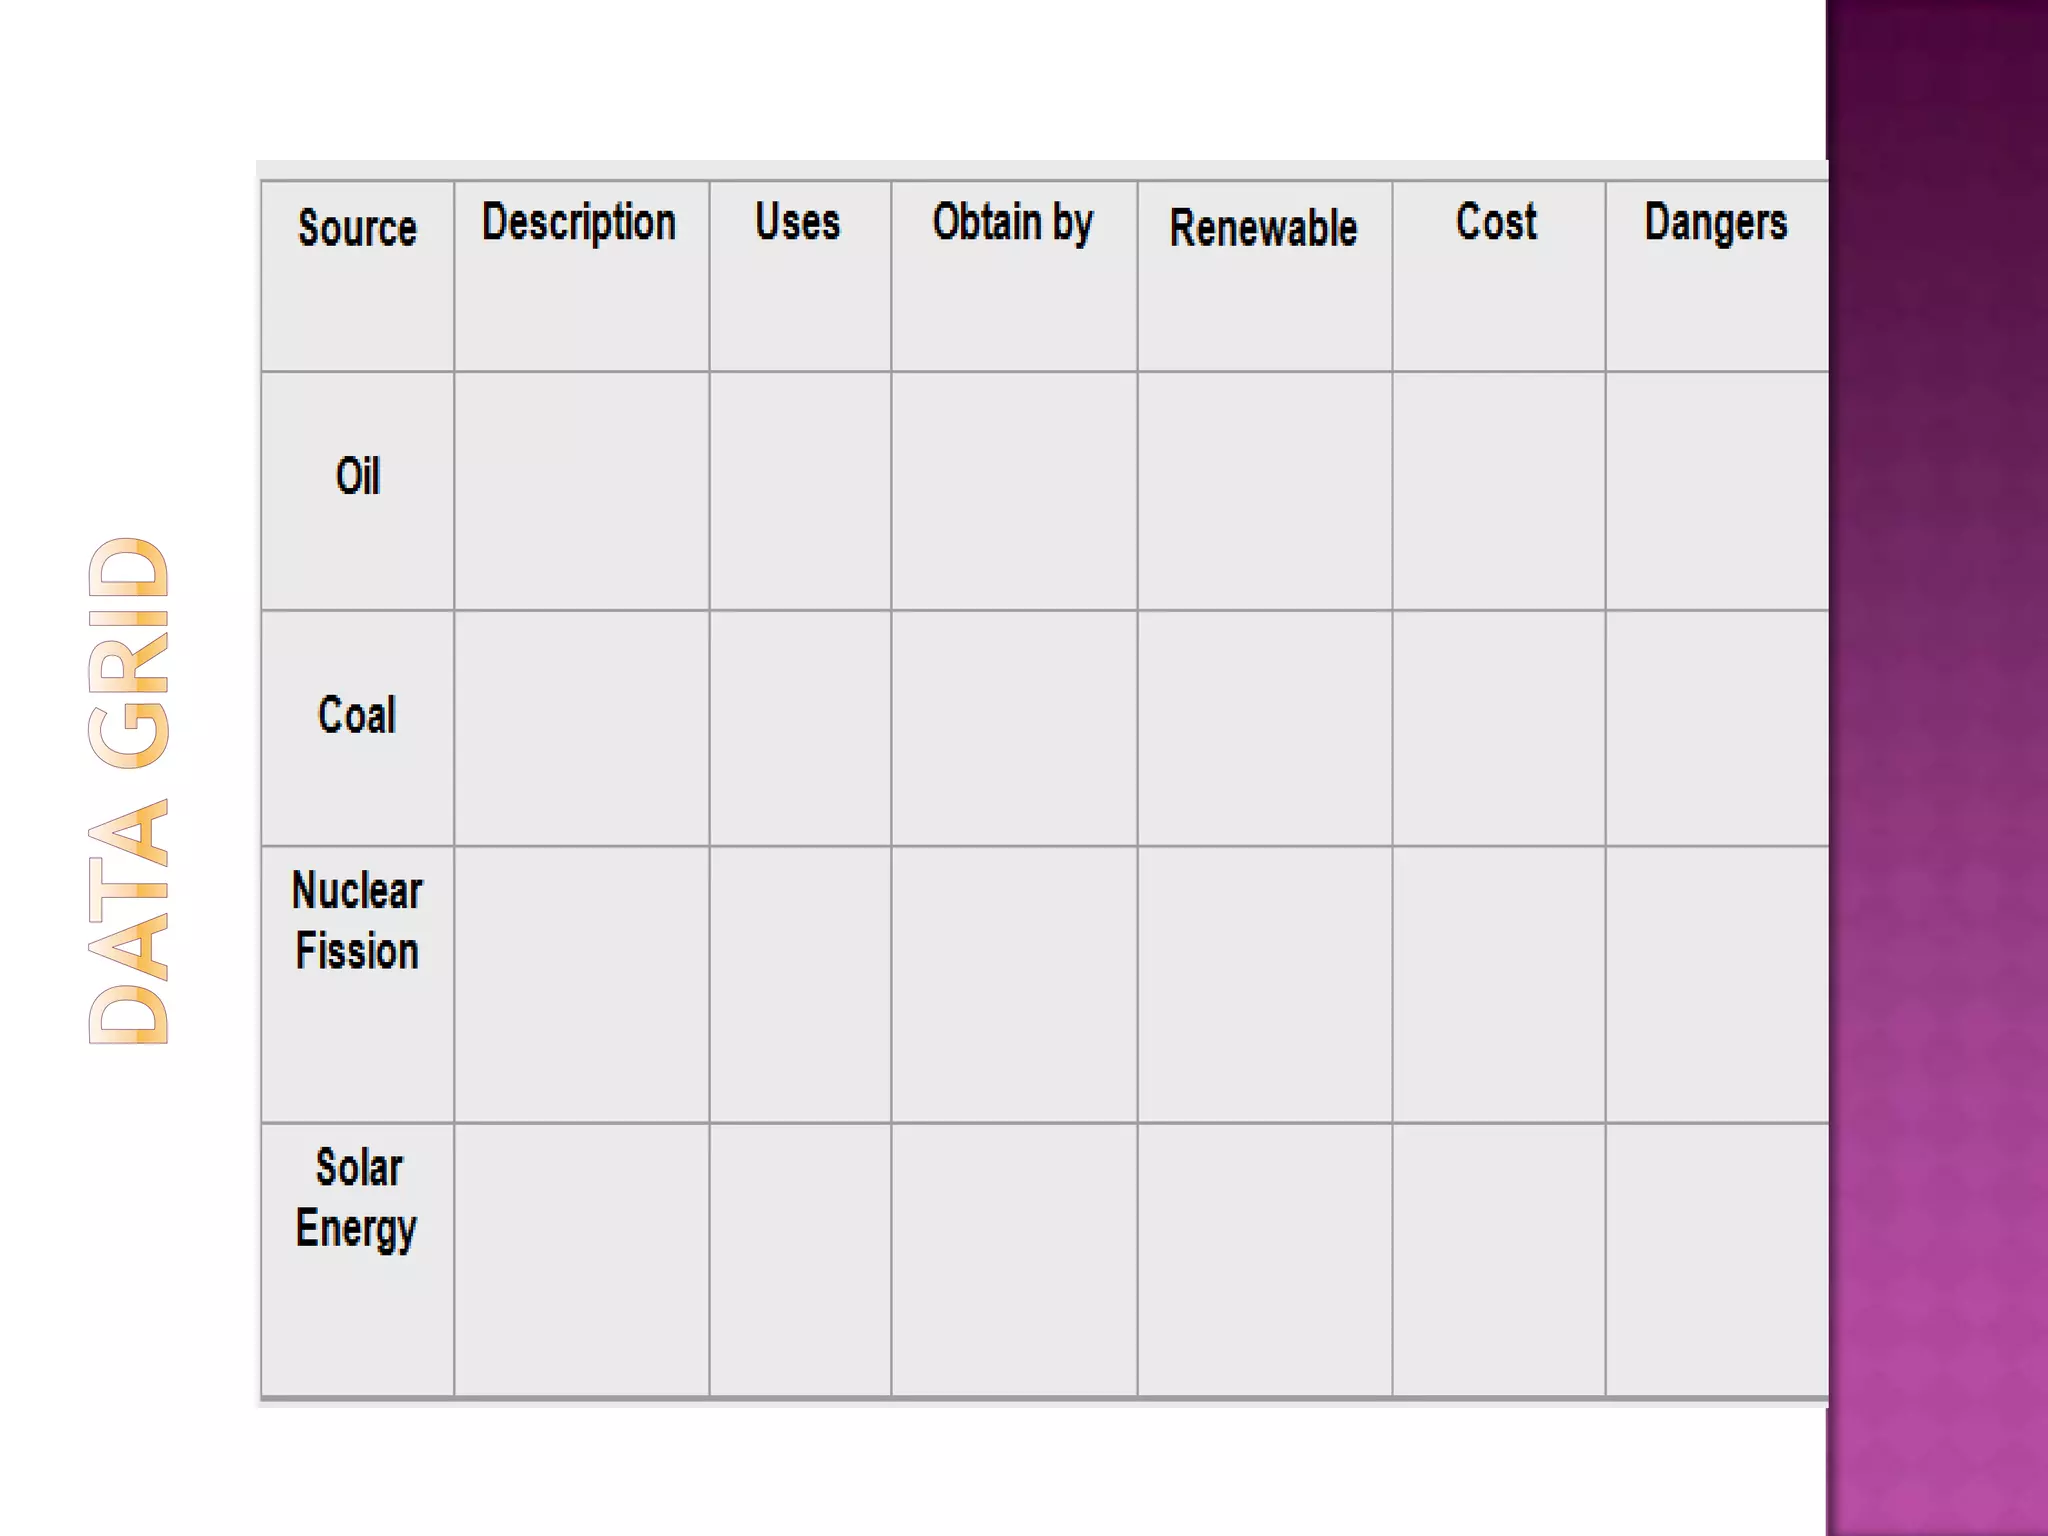
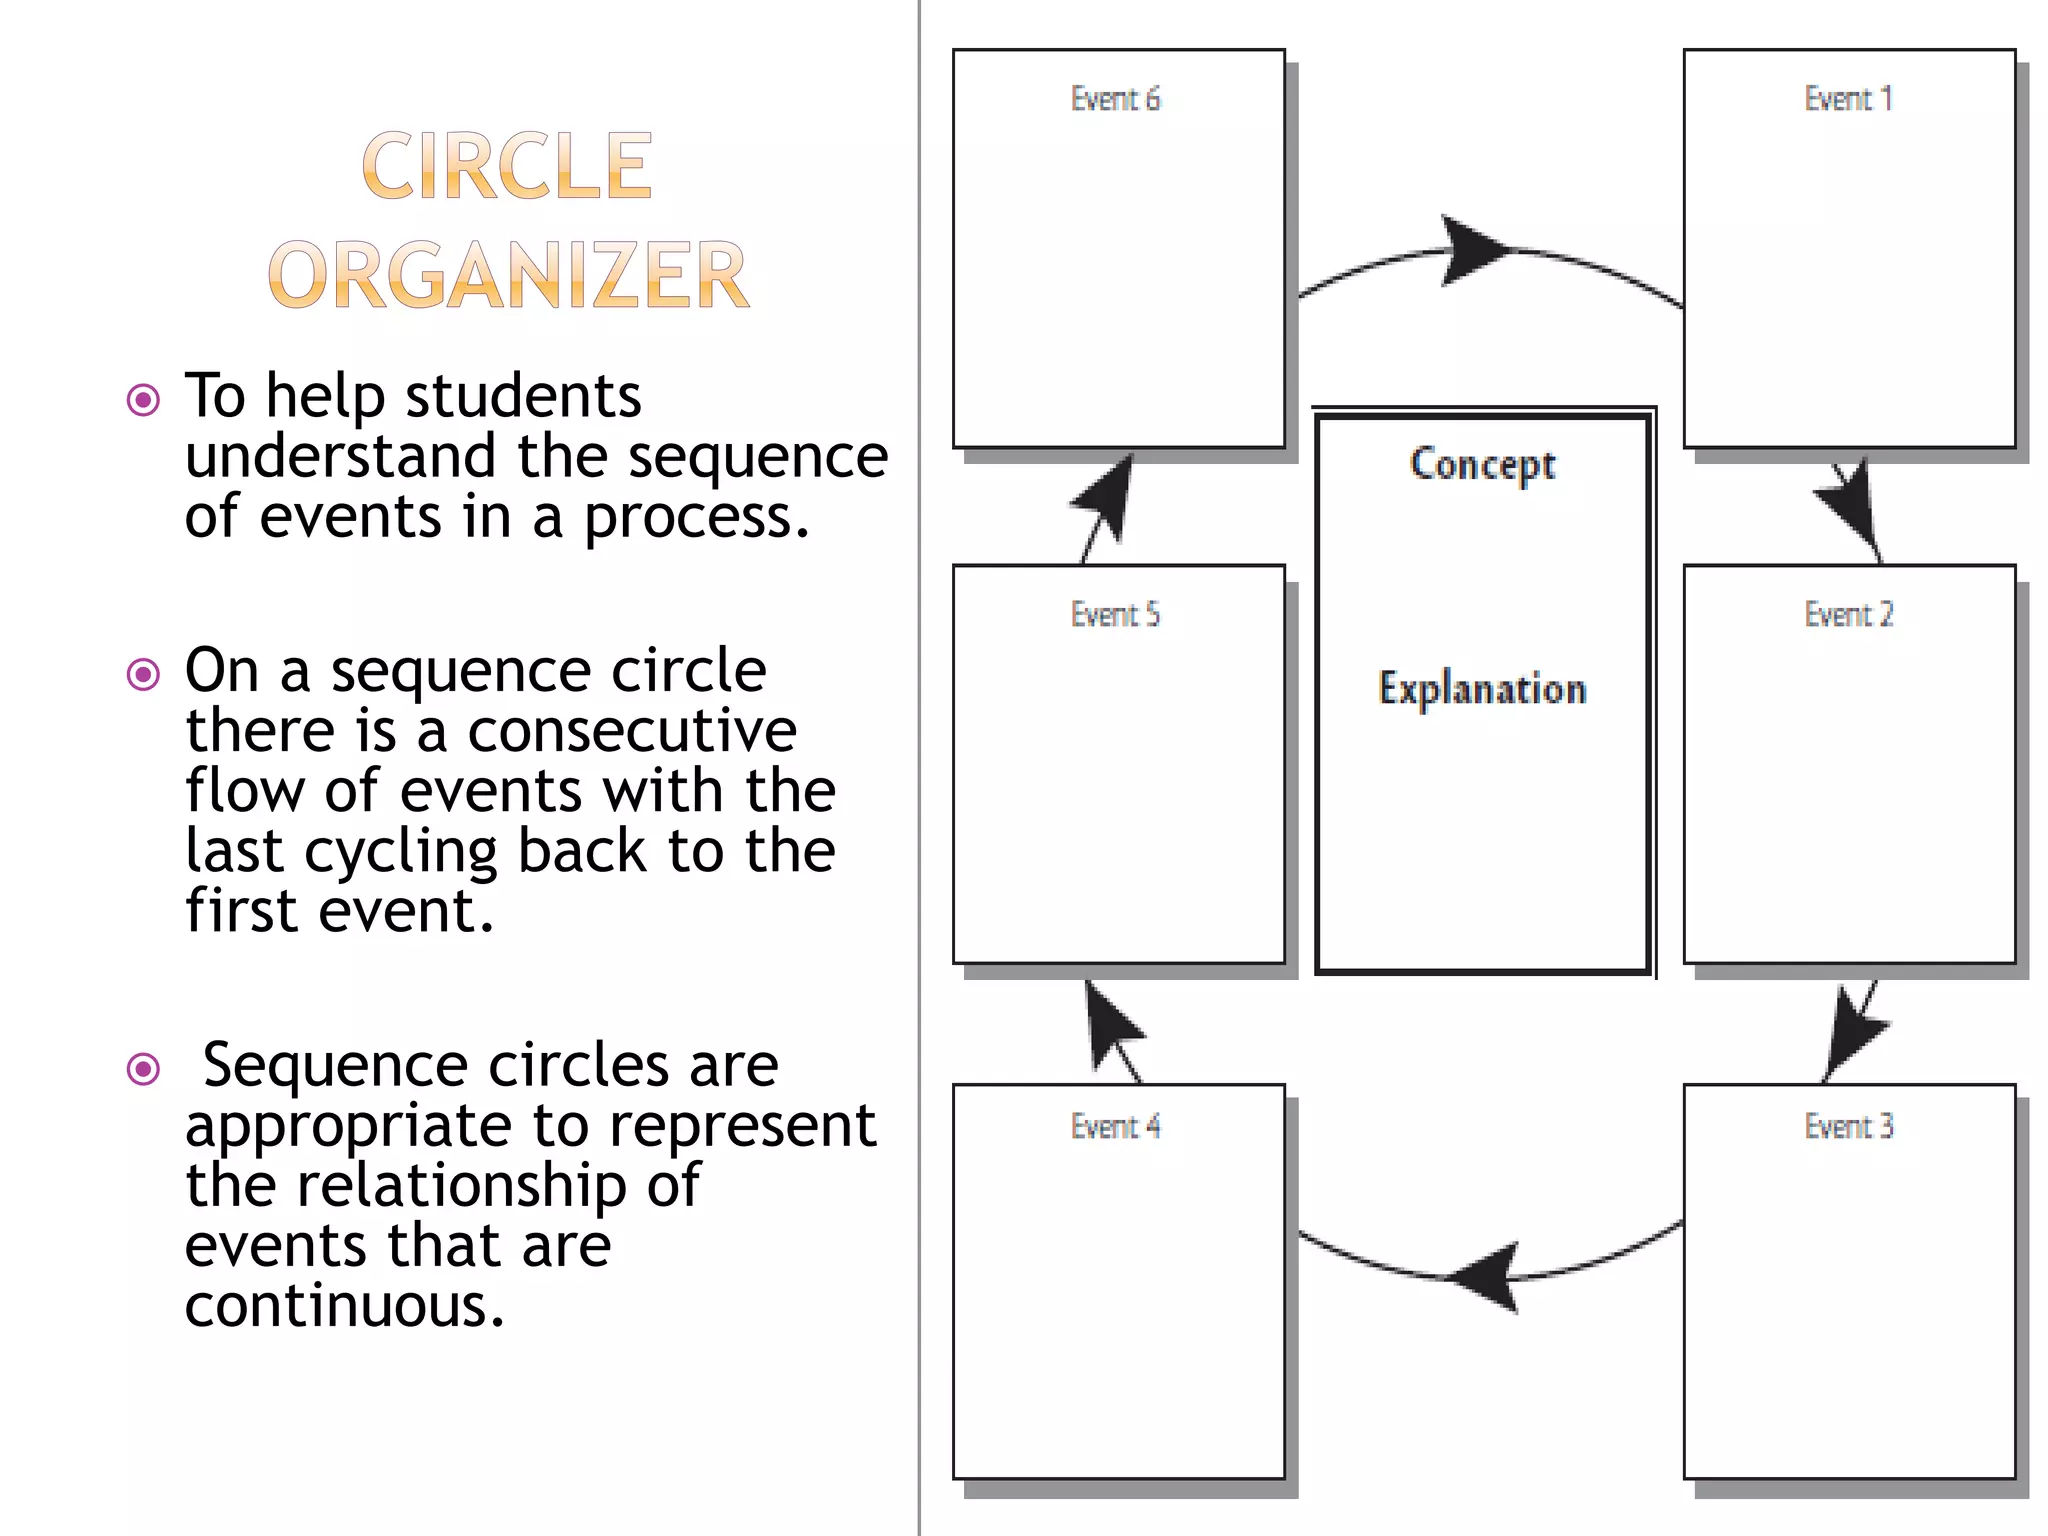
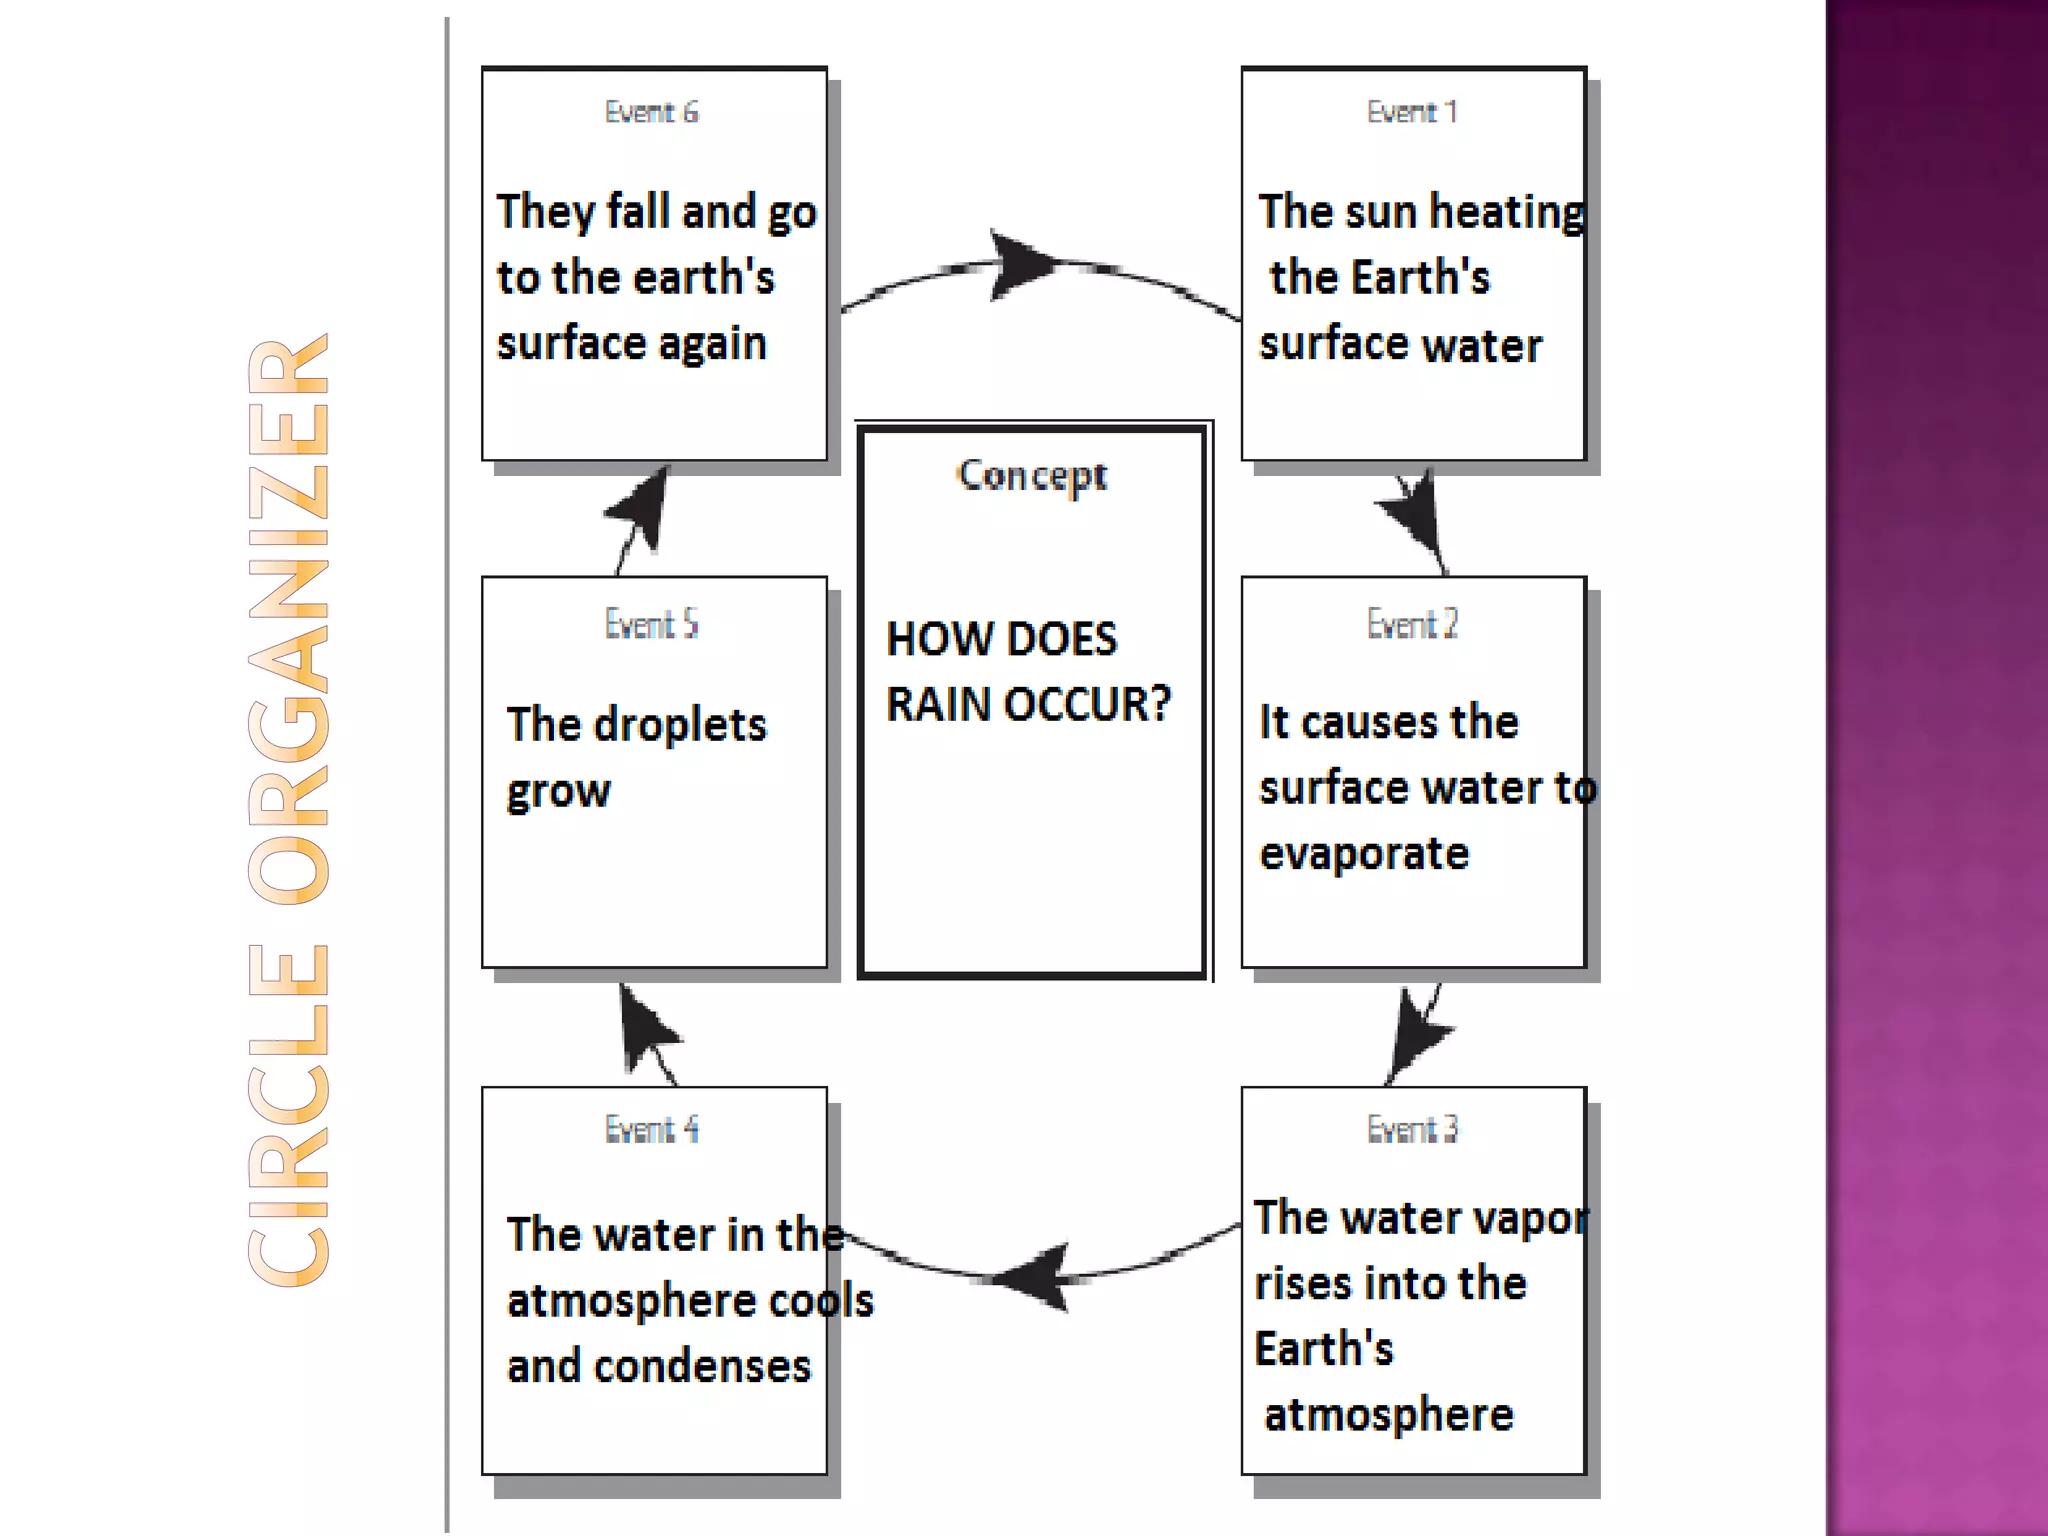
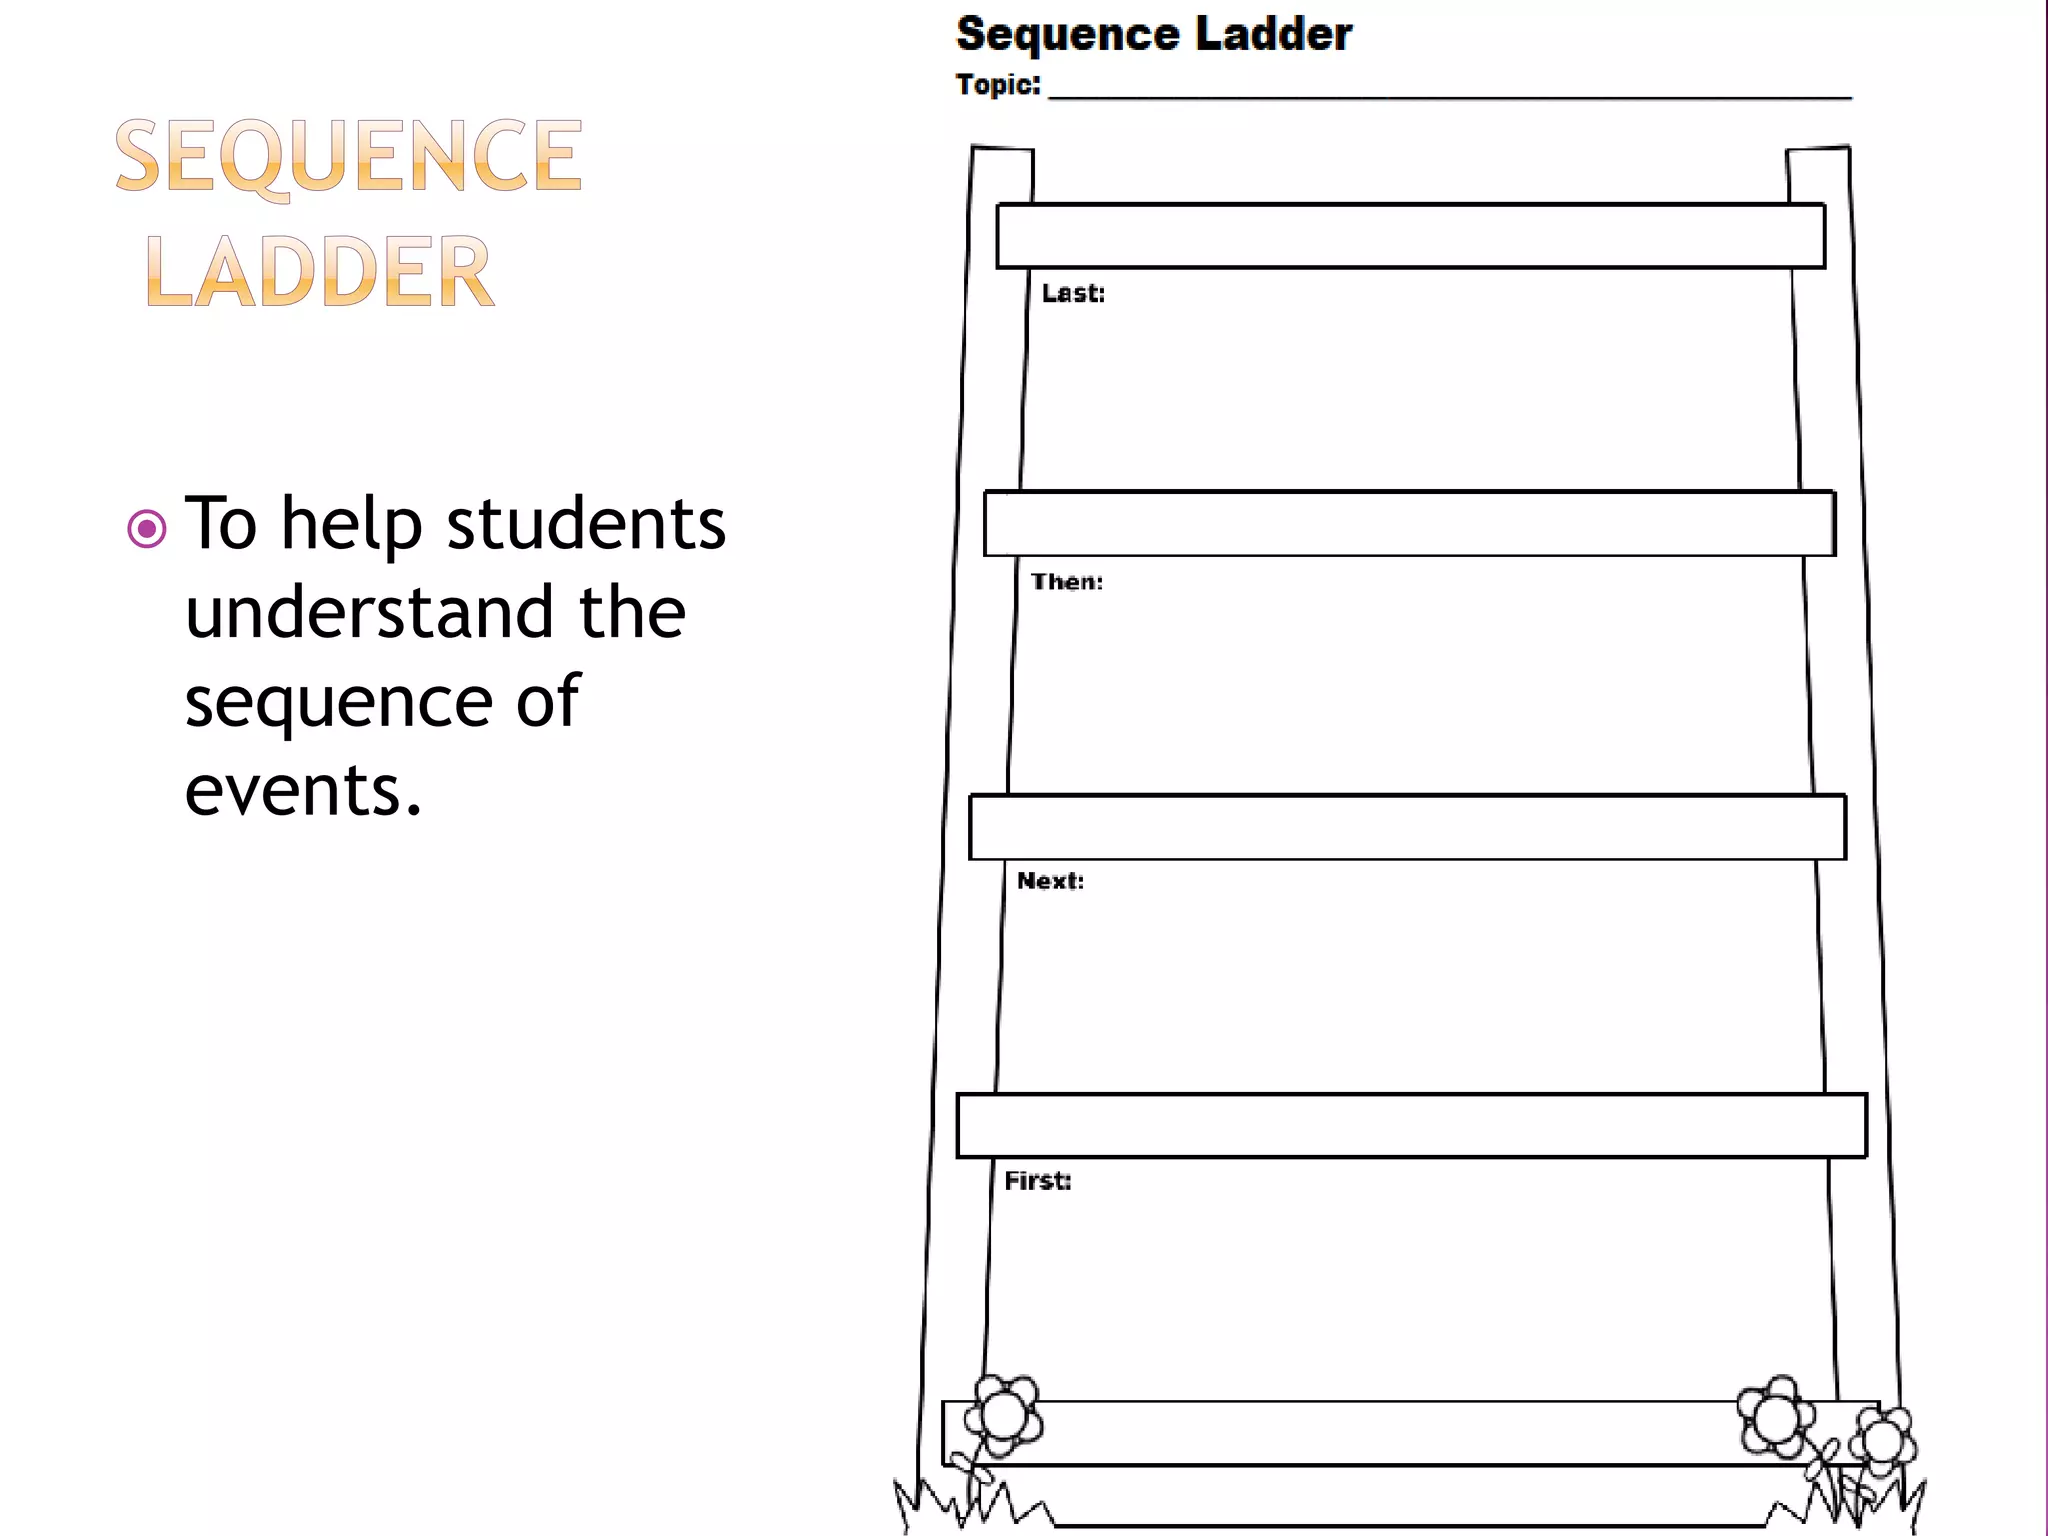
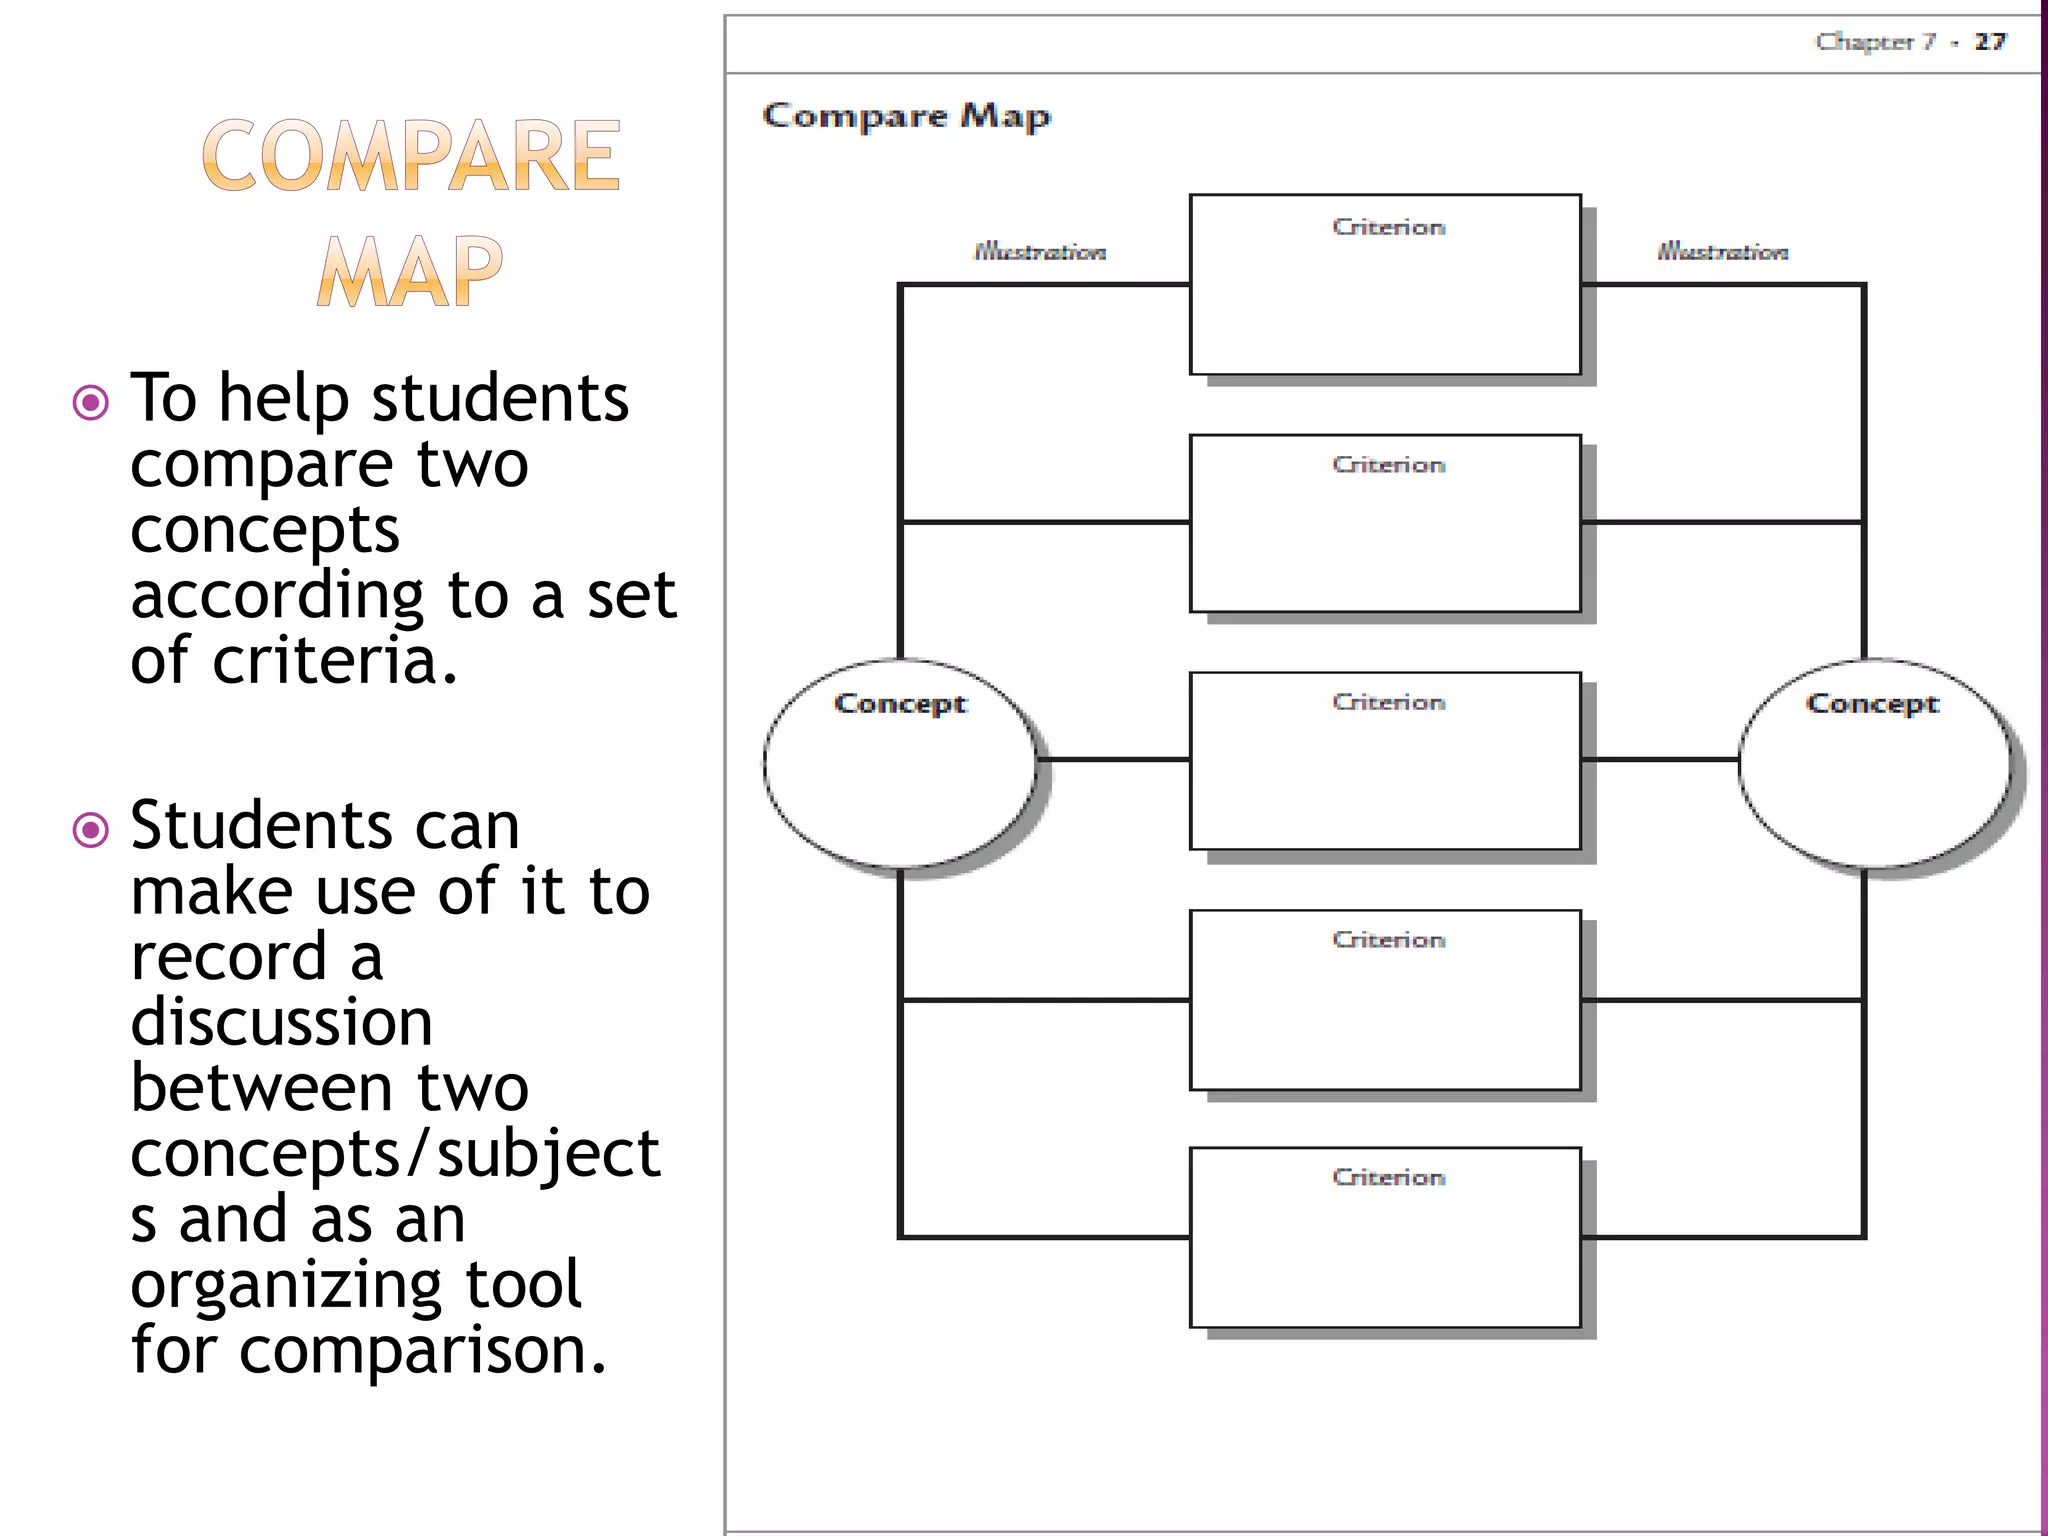
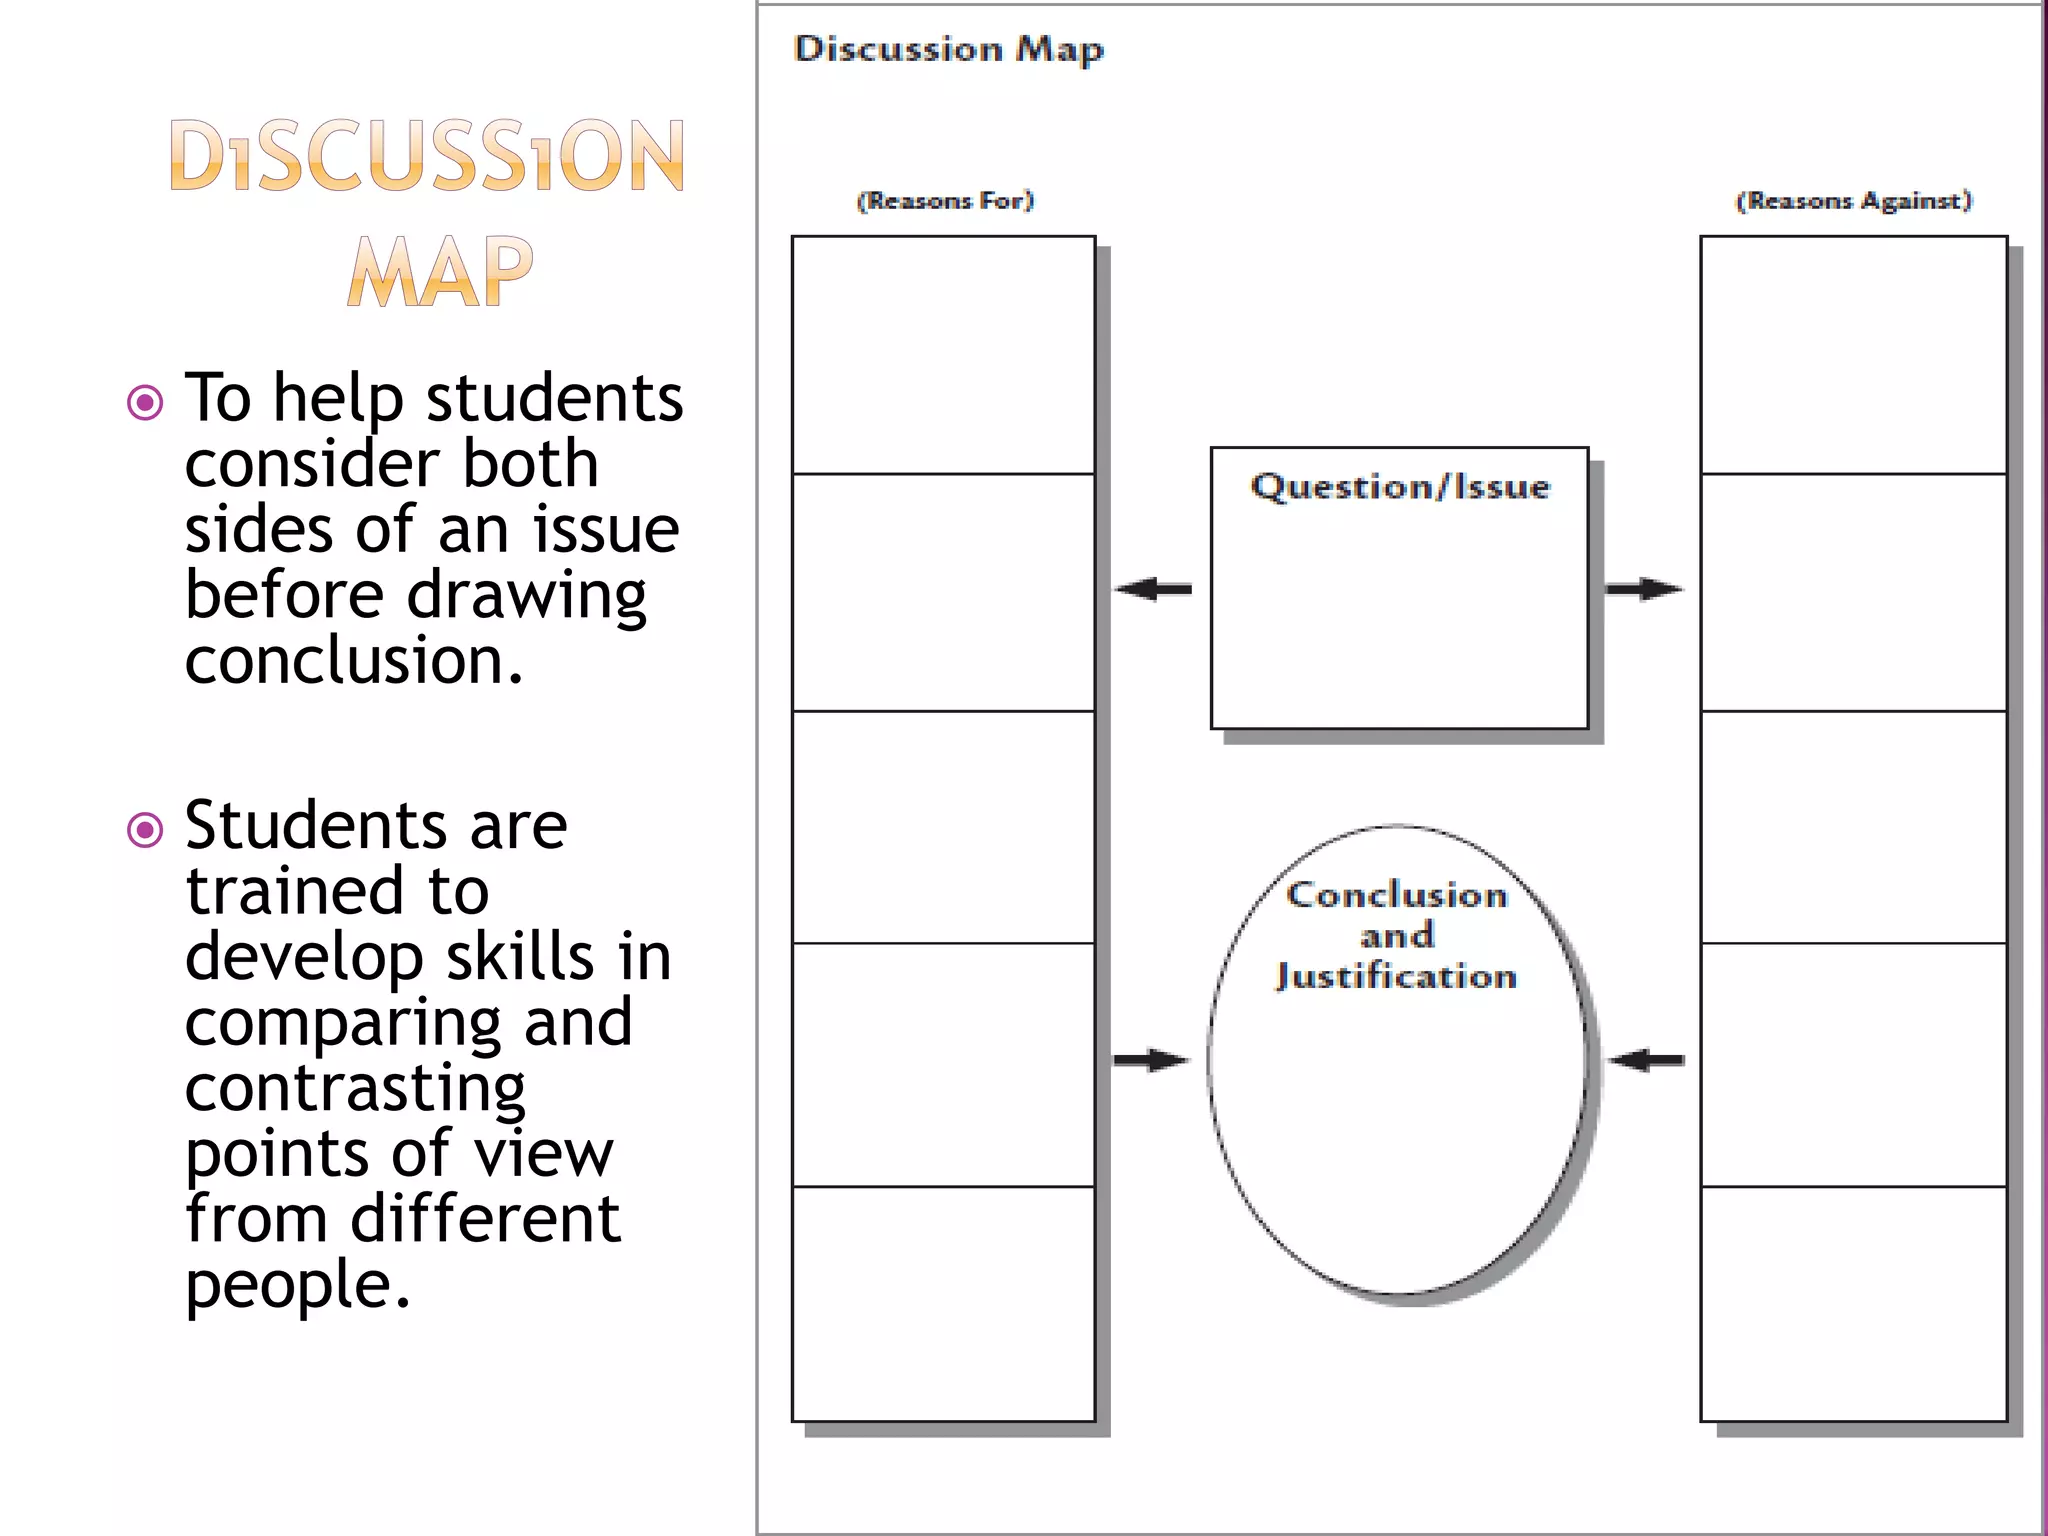
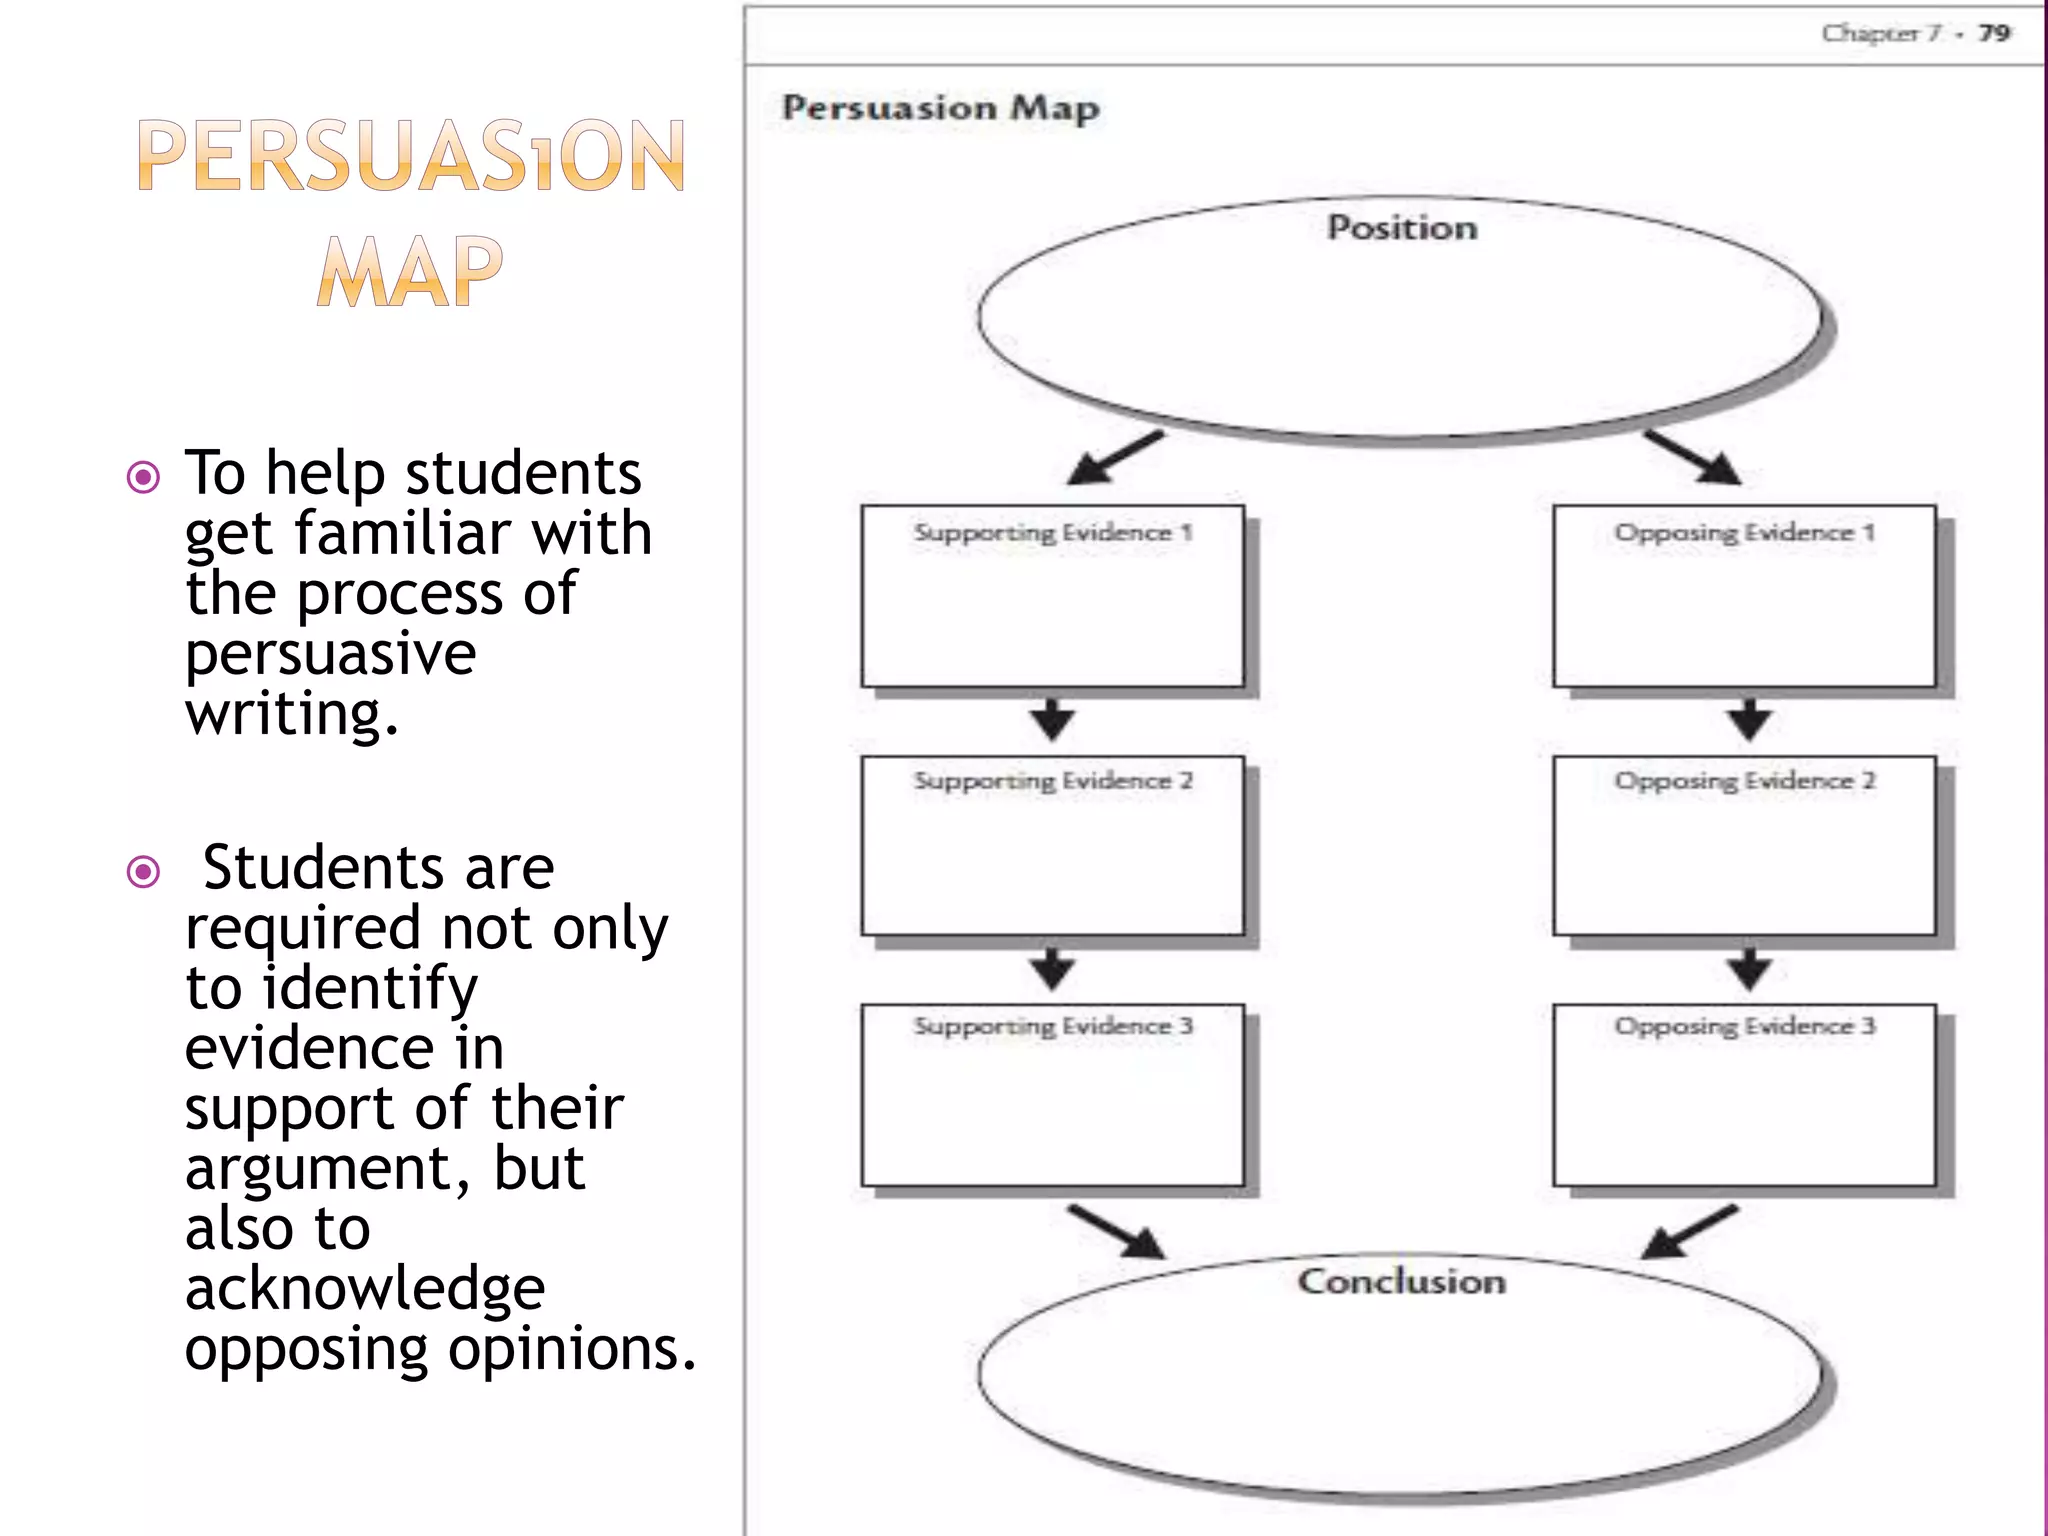
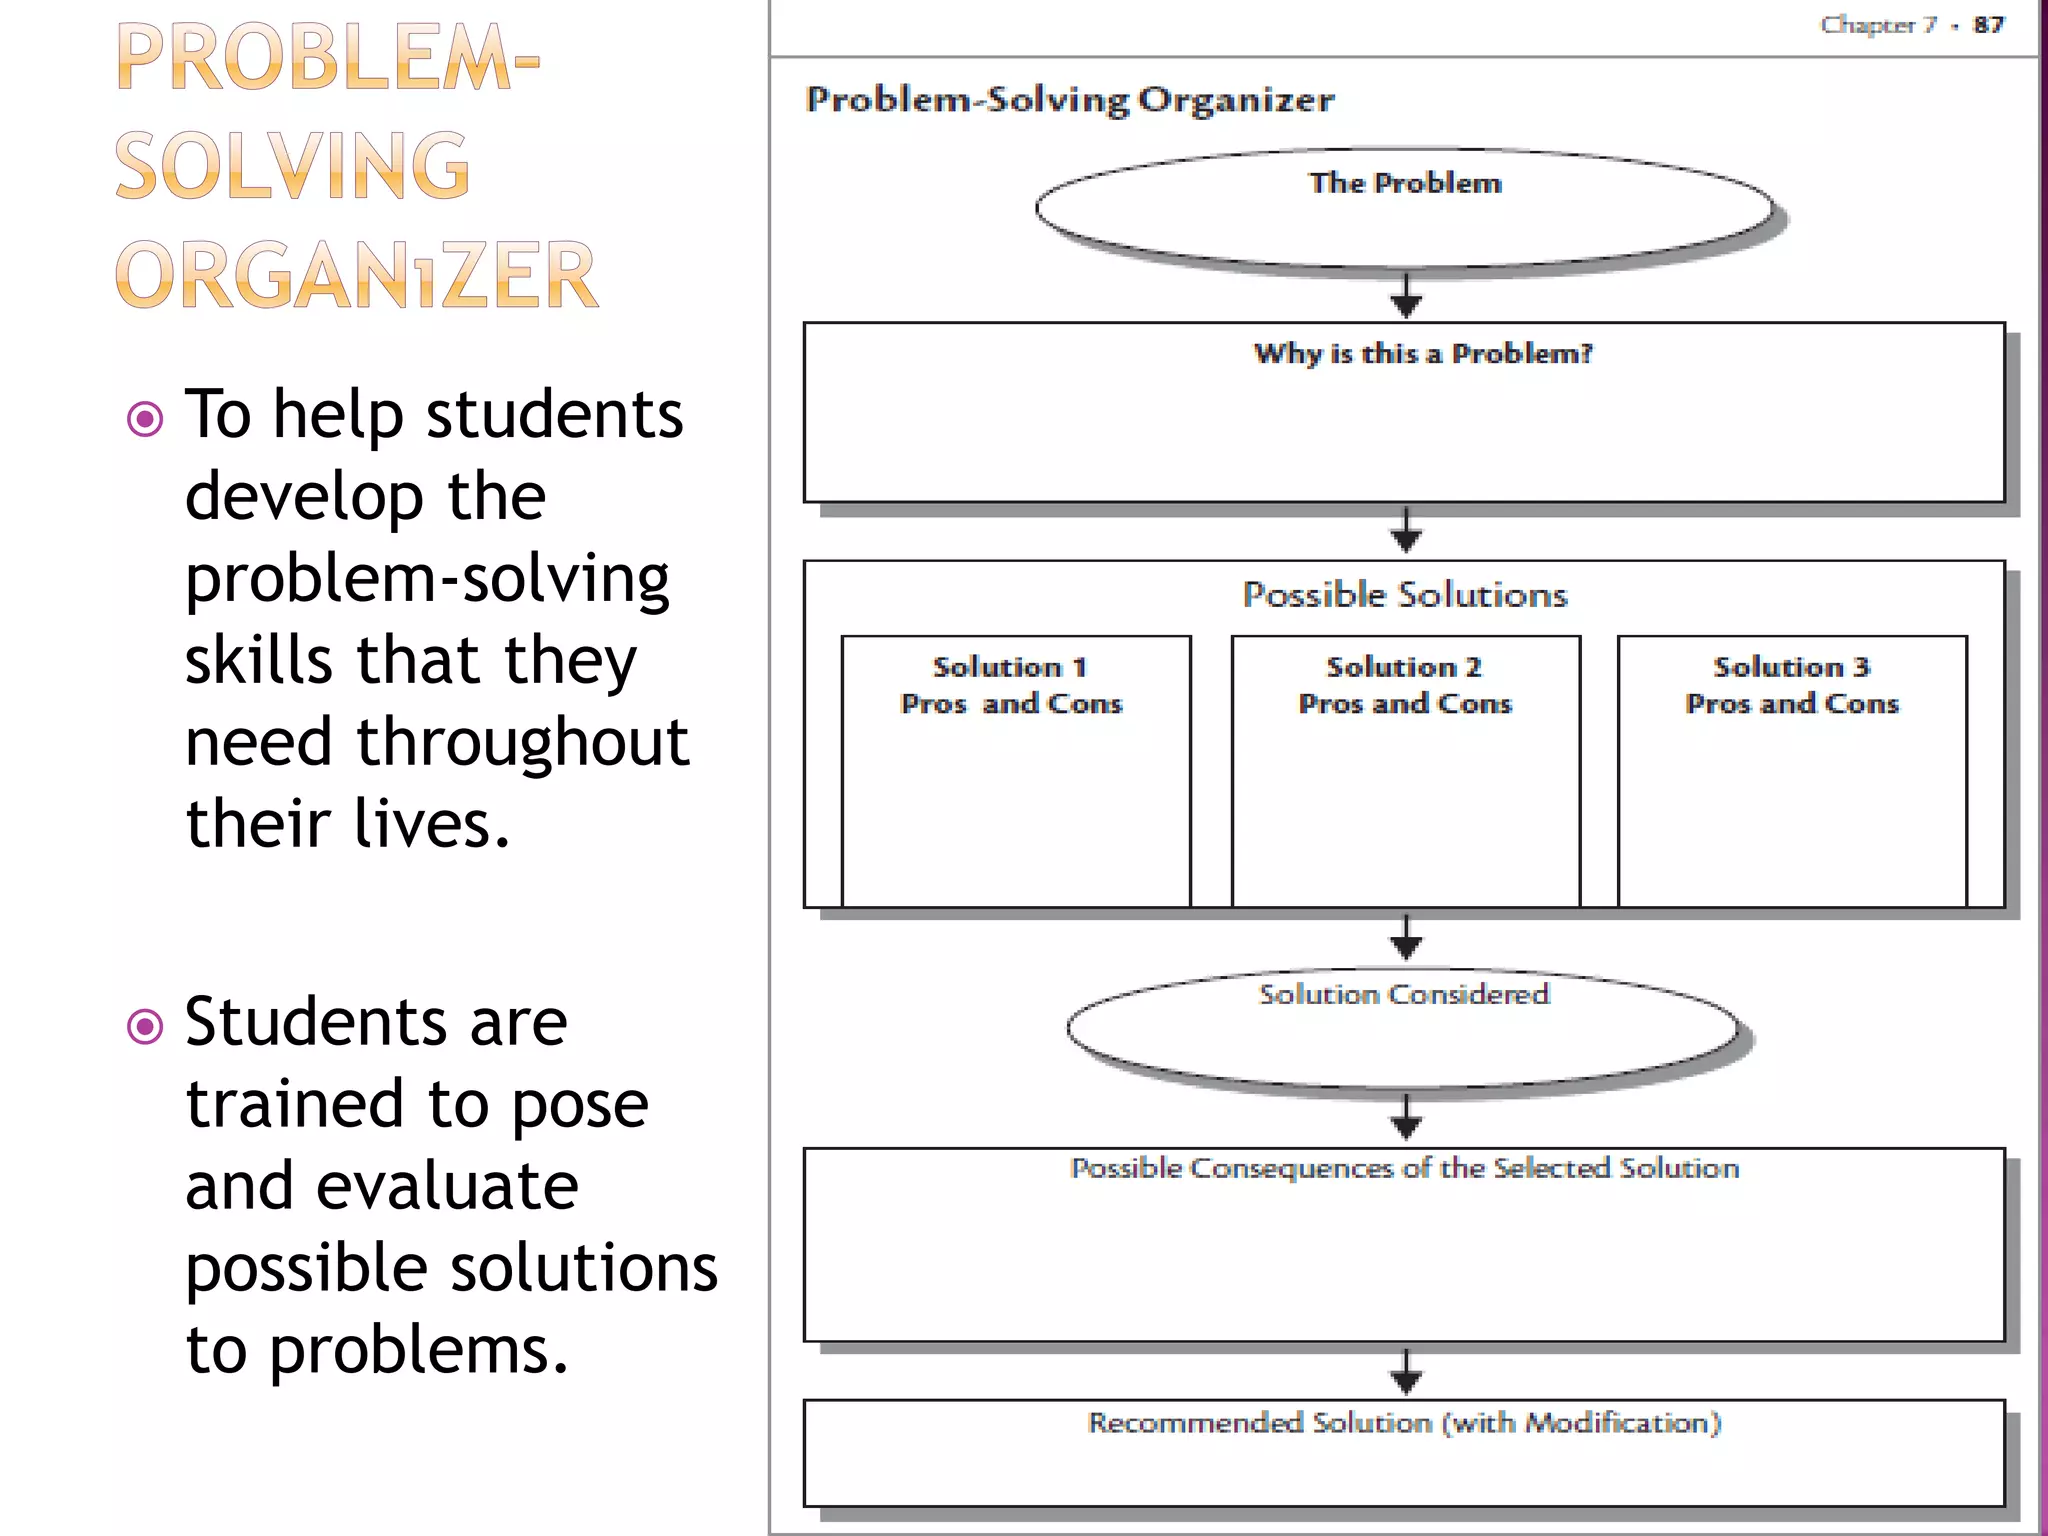
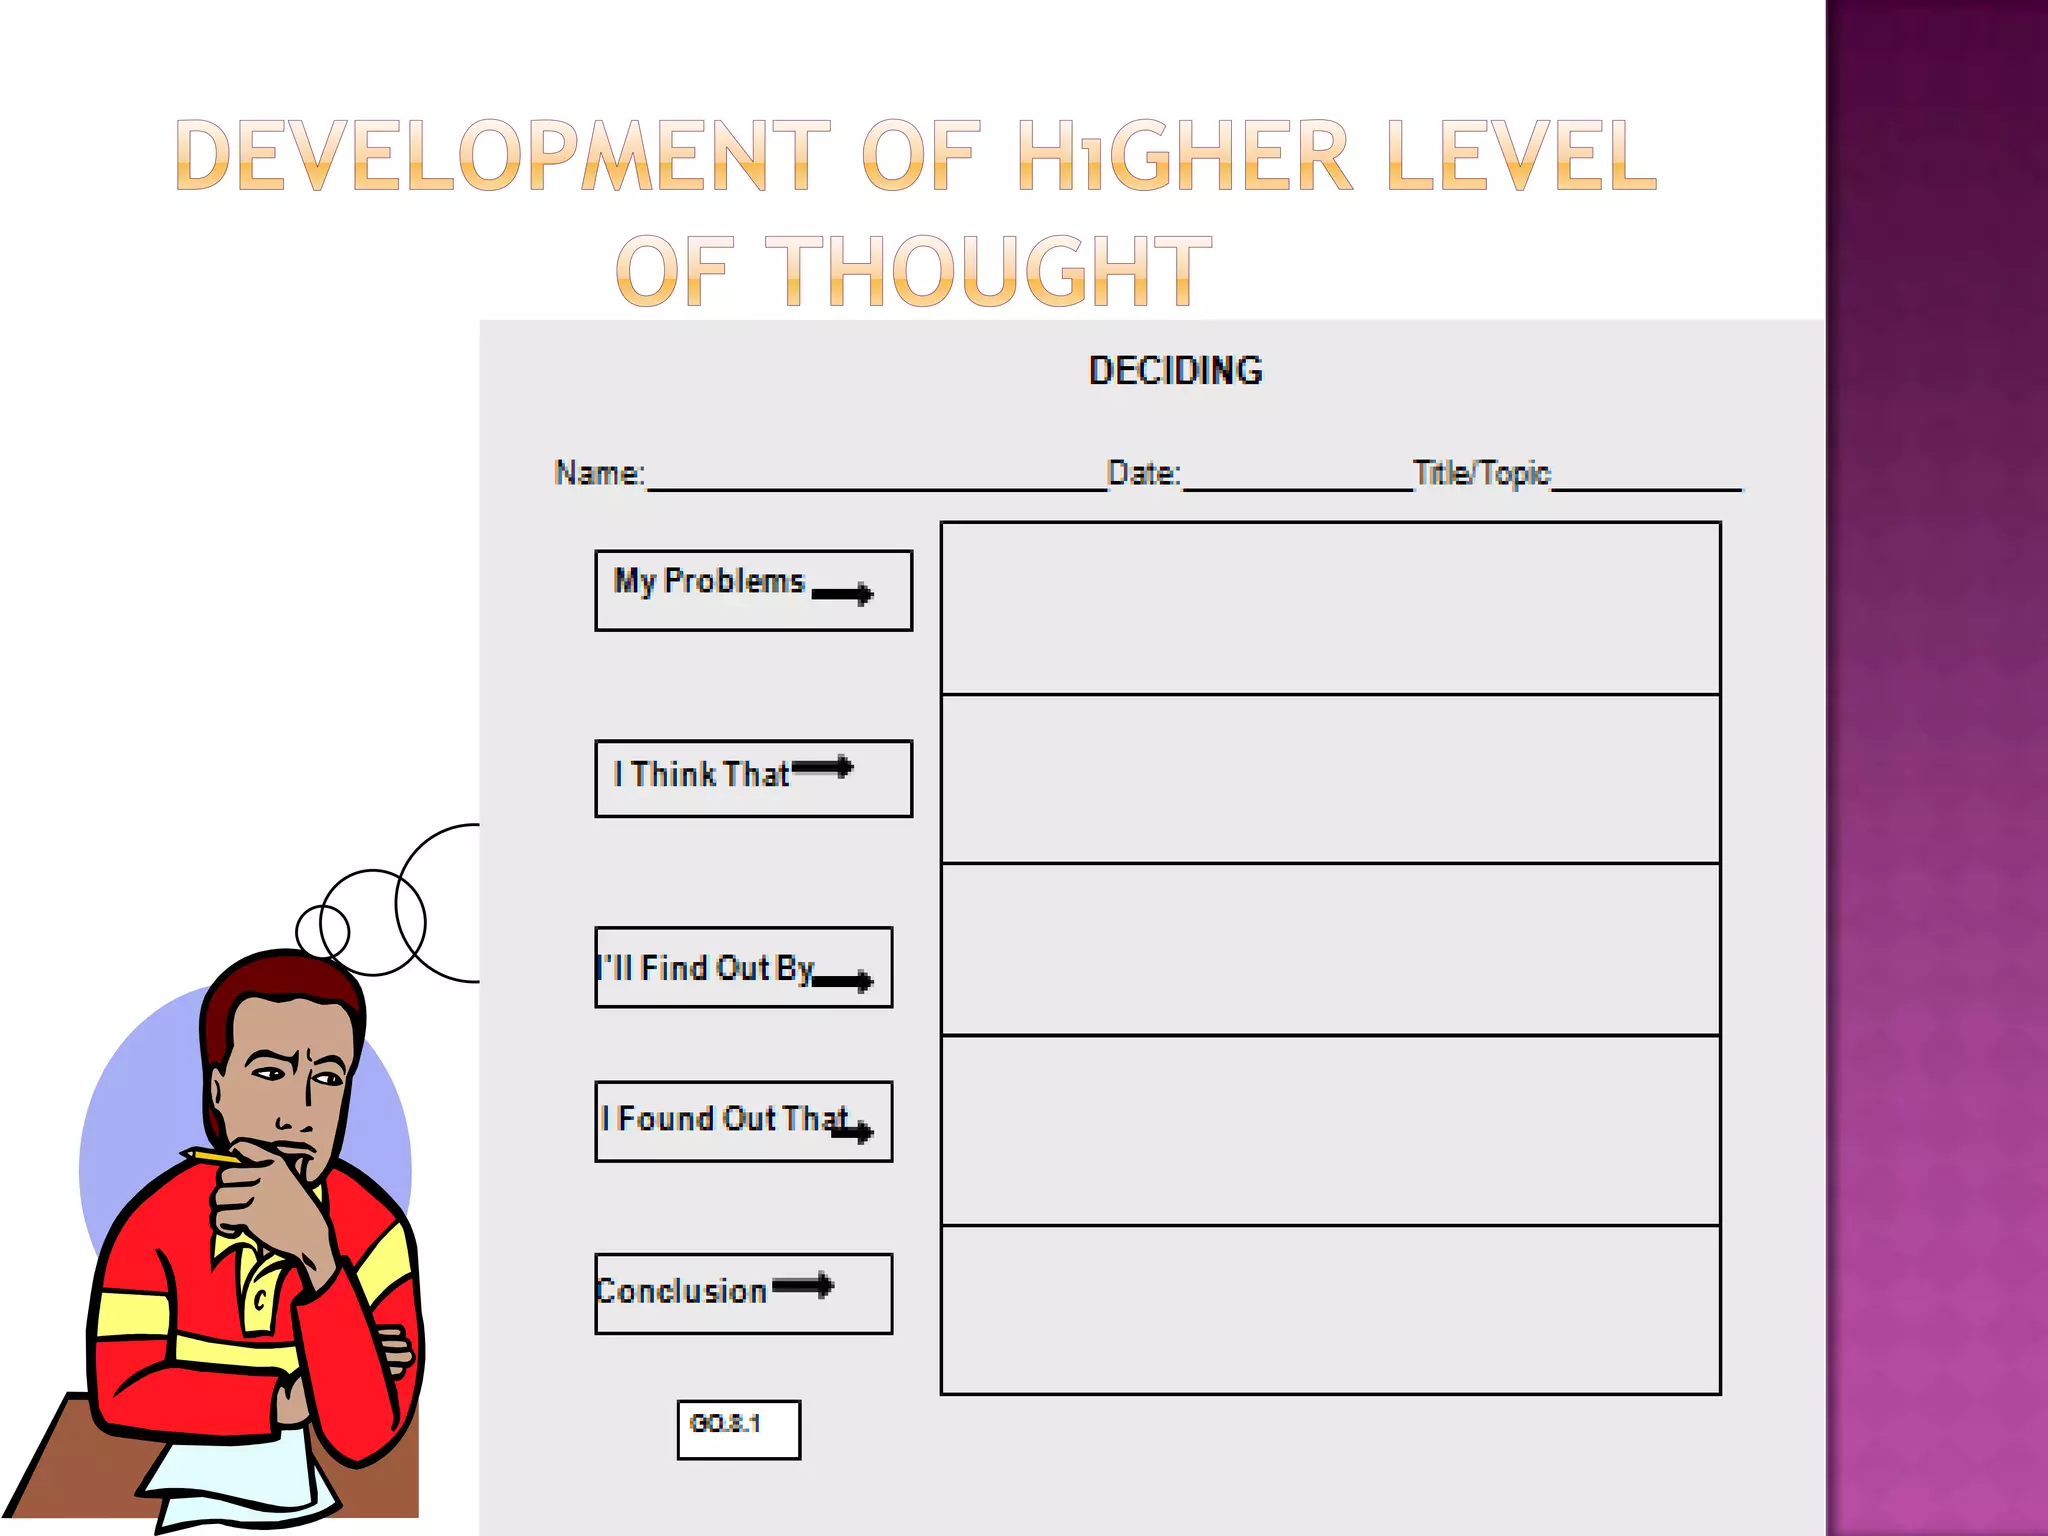
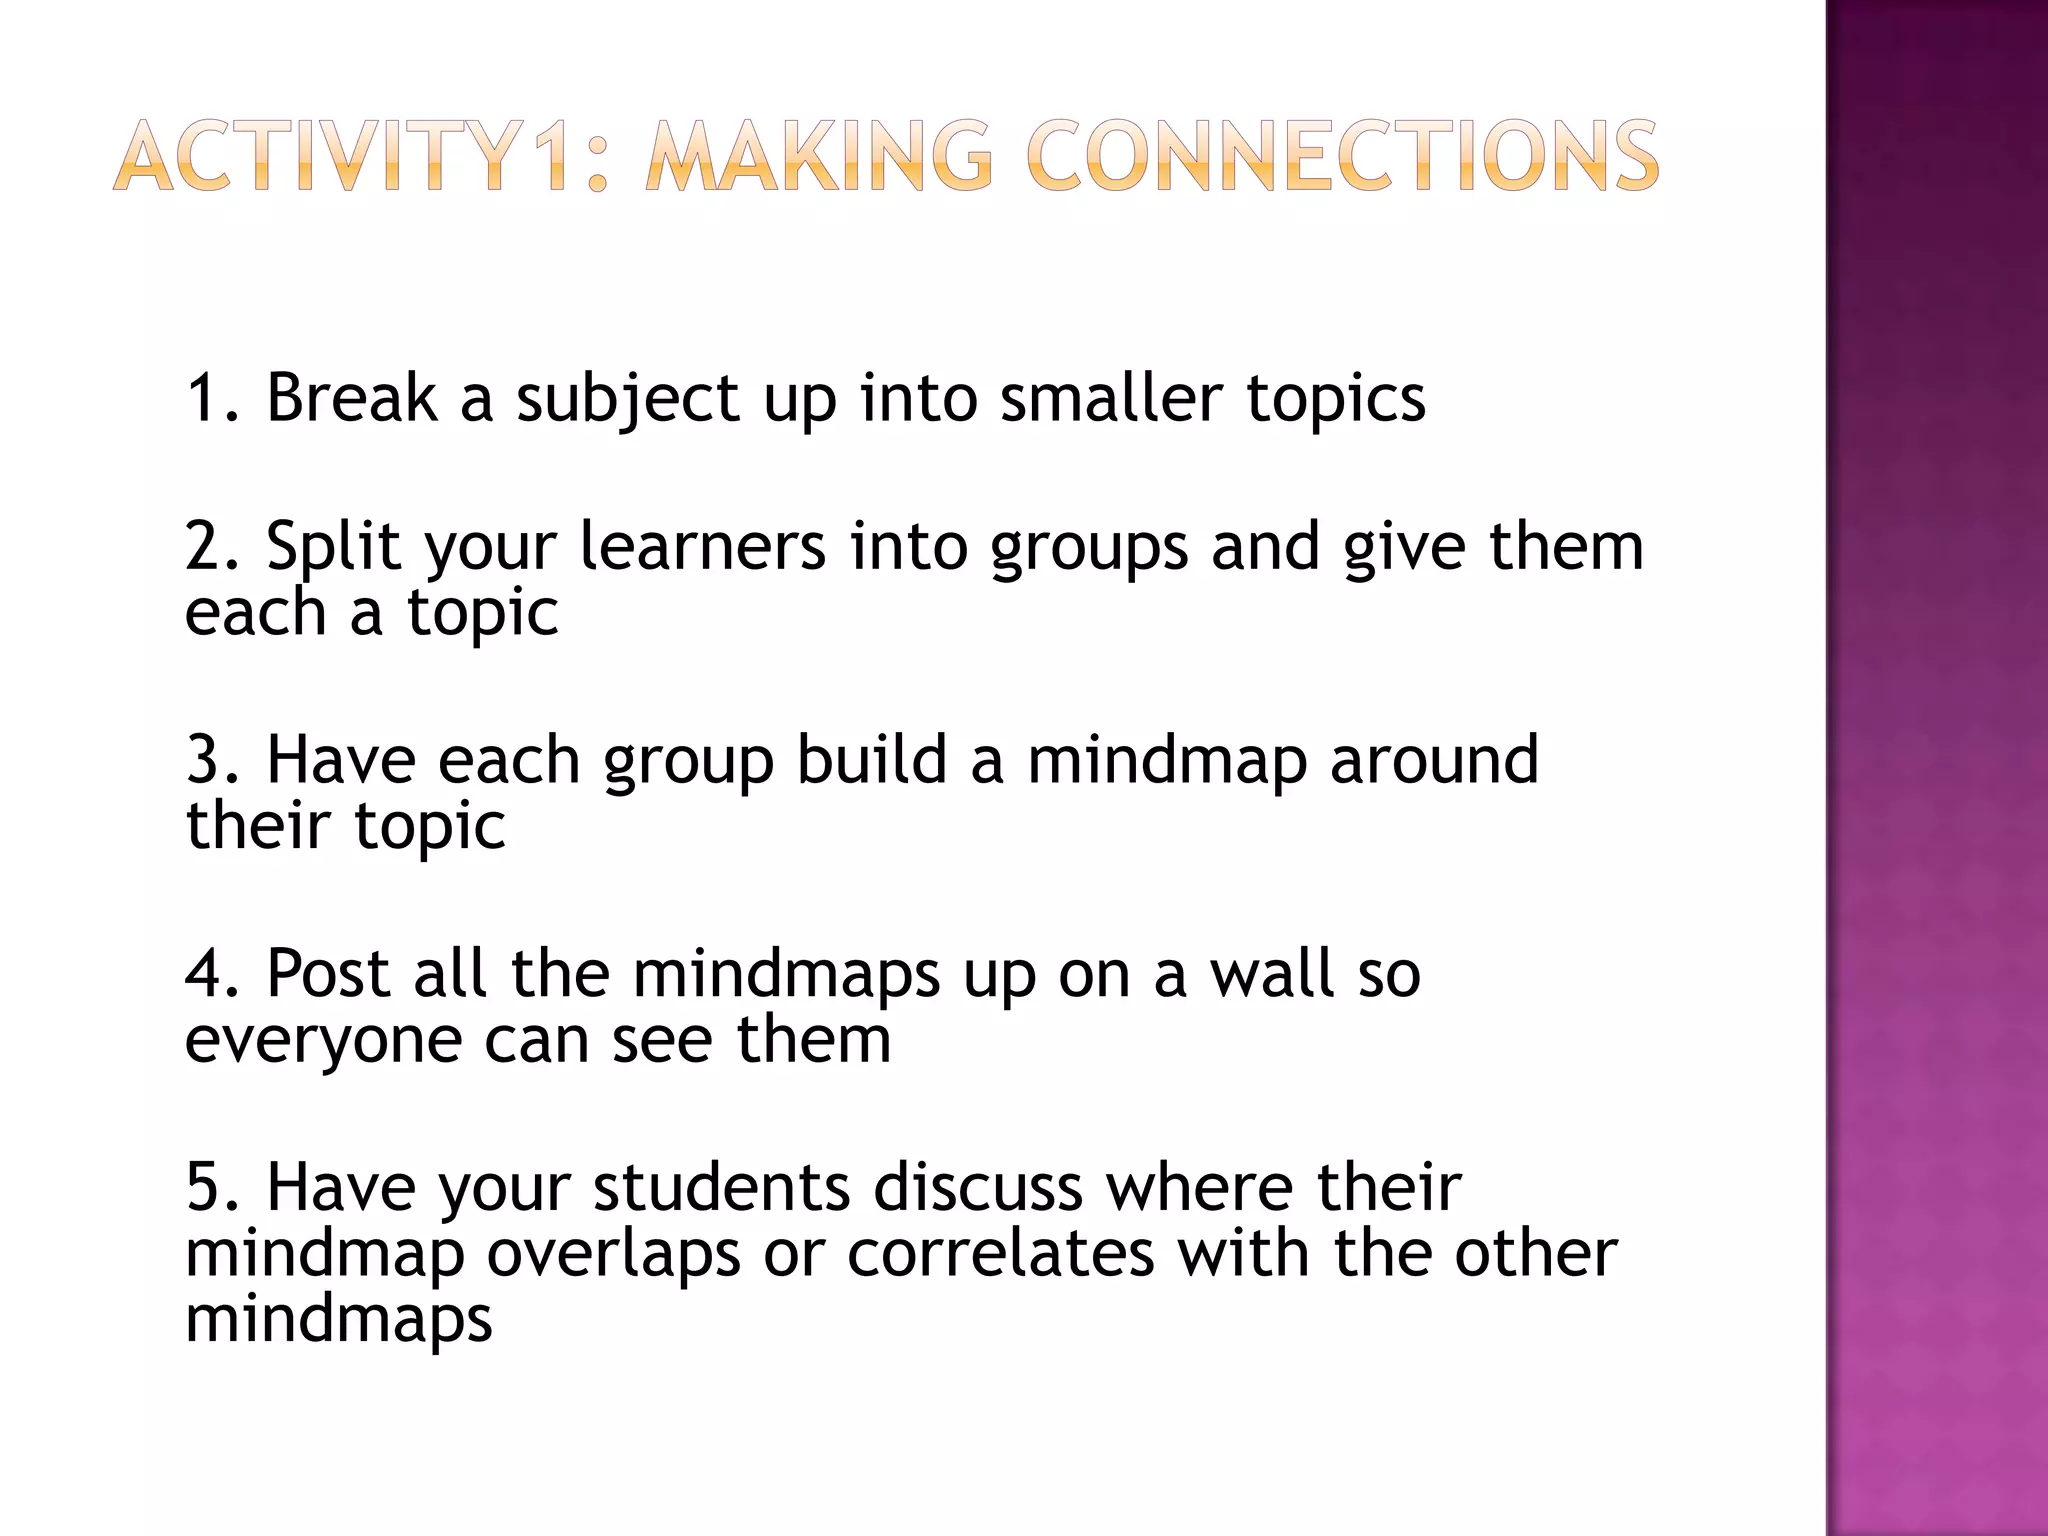
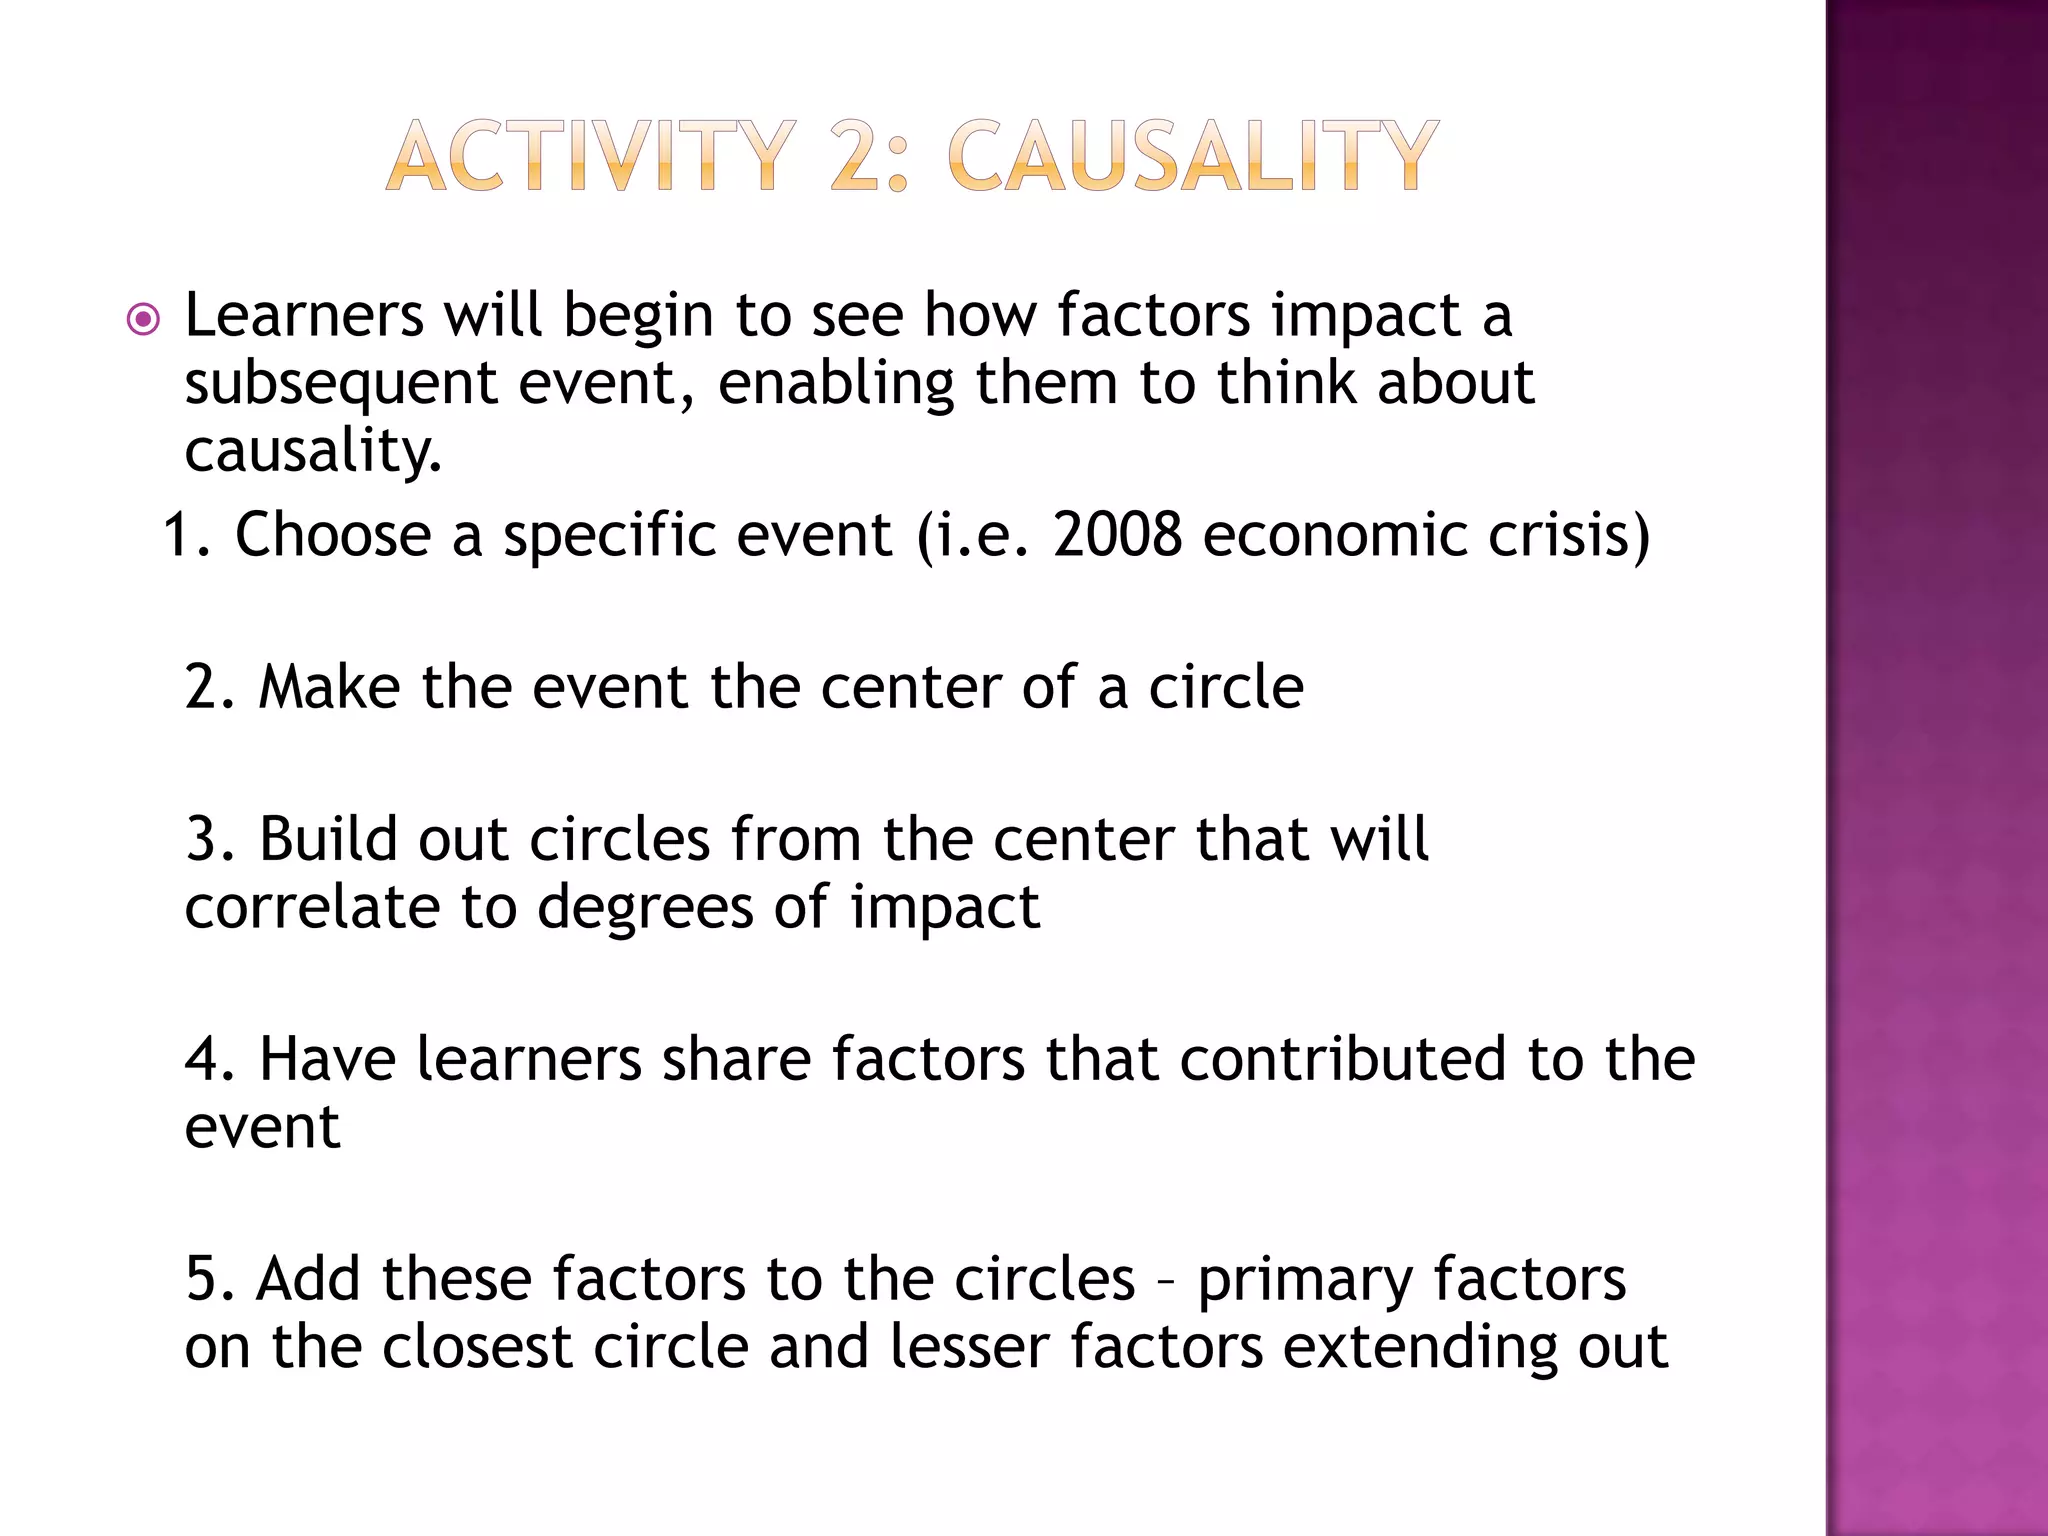
The document discusses how graphic organizers can be used to improve critical thinking skills. It provides examples of different types of graphic organizers like cyclical organizers, conceptual organizers, and sequential organizers. Graphic organizers help students make connections between information, break information into manageable chunks, identify prior knowledge, and improve research and problem-solving abilities. Specific organizers like Venn diagrams, concept maps, and cause-and-effect diagrams are explained as tools to help students compare/contrast, organize categories, and understand processes and relationships between concepts. The document emphasizes how graphic organizers promote higher-level thinking and language development when students summarize and discuss information.
2. “The words or the language, as they are
written or spoken, do not seem to play any
role in my mechanism of thought.”
A. Einstein
3. According to the University of Maryland,
critical thinking is "skillful and responsible
thinking in which you study the problem from
all angles, and then exercise your best
judgment to draw conclusions.“
With
the help of visual aids that show all the
connections.
4.
5. Visual representation of knowledge that
structures information by arranging
important aspects of a concept or topic into
a pattern using labels.
Basic categories are;
Cyclical organizers,
Conceptual organizers,
Sequential organizers,
Hierarchical organizers.
6.
7. To make
connections
among pieces of
information
Thinking
Skills and
Graphic
Organizers
To provide a
means to To break
observe and information into
assess the
students’ manageable
thought chunks
processes.
8.
9.
10. To make students
identify their prior
knowledge and let
them set their
own targets and
means of learning.
Students are required
to write down what
they have learned to
show the new
knowledge they have
obtained.
11. To help students
improve their
research and
problem-solving
skills.
Students are
trained to plan
their research and
investigation of a
topic and thus
promote their
ability to learn and
think
independently.
12.
13.
14. To help students
see superordinate
and subordinate
categories of a
concept or topic.
It clarifies
relationships
between and
among
concepts/topics in
different levels.
15.
16. HIERARCHY
DIAGRAM
1
2
4
3
Raise Thinking
What is the strongest power for each
section?
17. To help students
explore concepts with
more than one meaning,
definitions, examples
and categories.
It is an excellent tool
to develop students’
skill in creating
associations and
conceptual links.
18.
19. To help students
uncover
similarities and
differences among
several items.
It is designed to
facilitate the
development of
students’
comparing and
contrasting skills.
20.
21. Tohelp students
develop skill in
comparing and
contrasting similar
and/or different
information.
A Venn diagram
may consist of two
or more circles.
22.
23.
24. To promote
students’ critical
and analytical
thinking about key
concepts and their
characteristics.
Students are
expected to list the
major
characteristics of a
concept and
illustrate with
examples.
25.
26. To help students organize
information into different
categories.
It allows students compare
and contrast information
according to various criteria.
Students are thus trained to
see patterns of information
and are able to generate
hypotheses.
27.
28. To help students
understand the sequence
of events in a process.
On a sequence circle
there is a consecutive
flow of events with the
last cycling back to the
first event.
Sequence circles are
appropriate to represent
the relationship of
events that are
continuous.
31. To help students
compare two
concepts
according to a set
of criteria.
Students can
make use of it to
record a
discussion
between two
concepts/subject
s and as an
organizing tool
for comparison.
32. To help students
consider both
sides of an issue
before drawing
conclusion.
Students are
trained to
develop skills in
comparing and
contrasting
points of view
from different
people.
33. To help students
get familiar with
the process of
persuasive
writing.
Students are
required not only
to identify
evidence in
support of their
argument, but
also to
acknowledge
opposing opinions.
34. To help students
develop the
problem-solving
skills that they
need throughout
their lives.
Students are
trained to pose
and evaluate
possible solutions
to problems.
35.
36. Higher-level thinking prompts more use of
language.
Studentshave more exposure to the language
of thought.
New content vocabulary is clearly presented
on the organizer.
Studentsmust incorporate their own words
when summarizing the information presented
on an organizer.
37. 1. Break a subject up into smaller topics
2. Split your learners into groups and give them
each a topic
3. Have each group build a mindmap around
their topic
4. Post all the mindmaps up on a wall so
everyone can see them
5. Have your students discuss where their
mindmap overlaps or correlates with the other
mindmaps
38. Learners will begin to see how factors impact a
subsequent event, enabling them to think about
causality.
1. Choose a specific event (i.e. 2008 economic crisis)
2. Make the event the center of a circle
3. Build out circles from the center that will
correlate to degrees of impact
4. Have learners share factors that contributed to the
event
5. Add these factors to the circles – primary factors
on the closest circle and lesser factors extending out
39. Bromley, K., DeVitis, L. I. and Modlo, M.
(1999). 50 Graphic Organizers for Reading,
Writing & More. New York: Scholastic
Professional Books.
The Use of Graphic Organizers to
Enhance Thinking Skills in Learning of
Economics