Downloaded 590 times
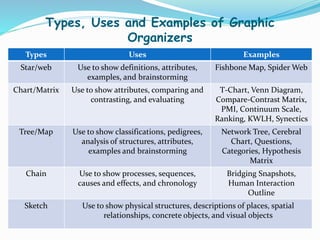
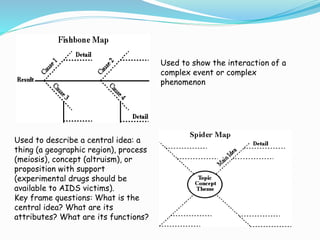
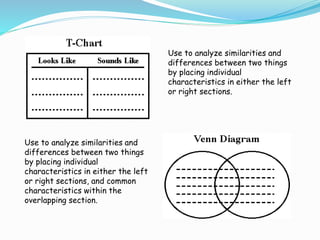
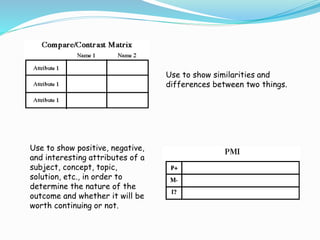
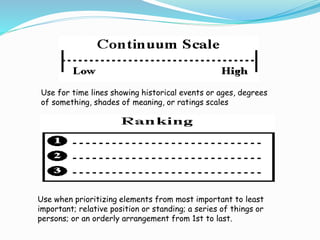
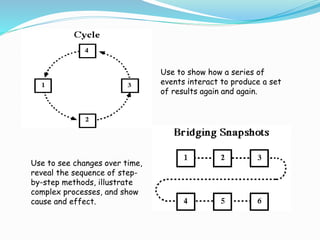
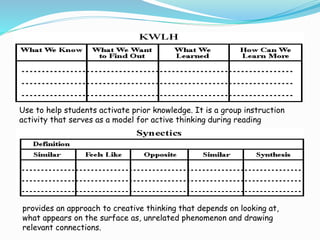
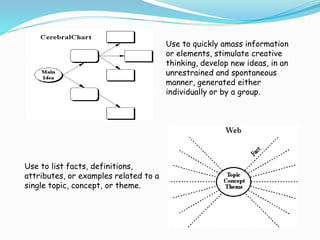
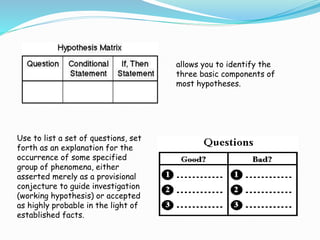
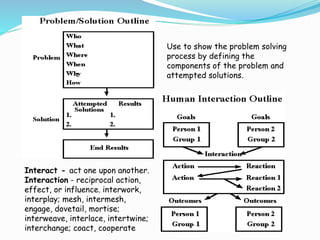

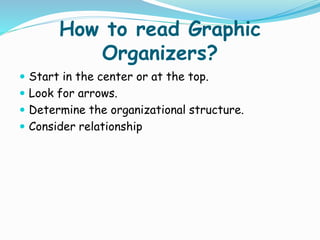


Graphic organizers are visual tools that help students organize and structure information. They use visual symbols to represent concepts and relationships. There are different types of graphic organizers for different purposes, such as tree maps to show classifications, Venn diagrams to compare concepts, and flow charts to illustrate processes. Effective teachers use graphic organizers to help students sequence information, organize their thoughts logically, develop analysis skills, and determine relationships like cause and effect. Graphic organizers should be introduced with examples and modeling to help students learn to read and use them.


