Downloaded 283 times

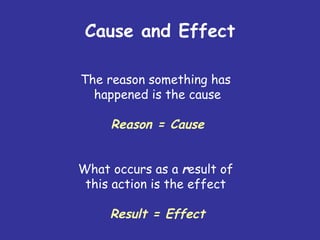
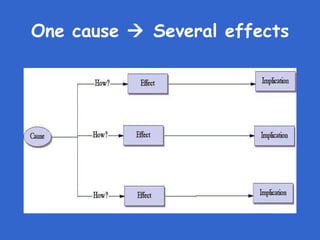
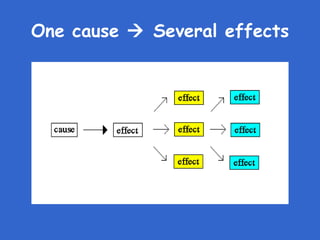
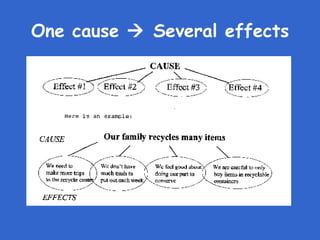
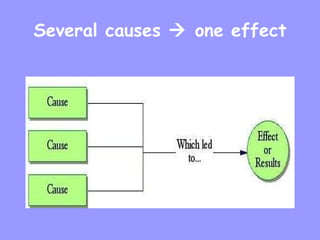
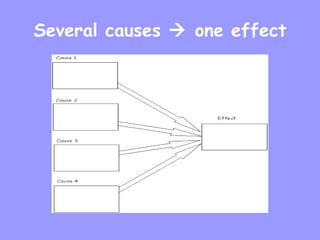

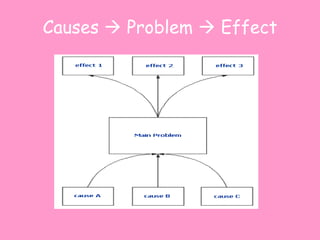
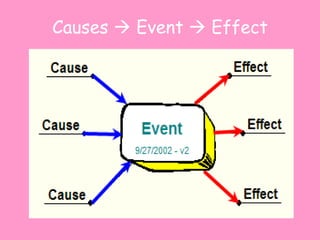
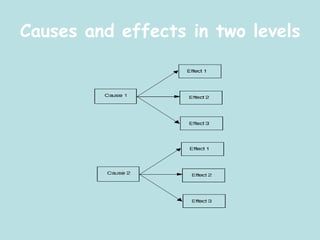
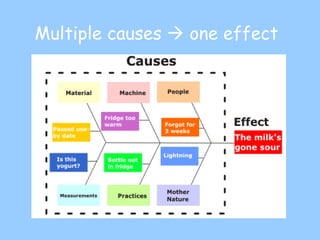

The document discusses the use of graphic organizers to illustrate cause and effect relationships in texts, helping to clearly visualize these patterns. It explains how different causes can lead to multiple effects and vice versa, showcasing the complexity of these relationships. Fishbone diagrams are highlighted as effective tools for organizing and categorizing information related to causes and effects.


![QCL- 14-v3 _[cause and effect diag]_[banasthali vidyapith]_[monikakumari]](https://cdn.slidesharecdn.com/ss_thumbnails/qcl-14-v3causeandeffectdiagbanasthaliunivmonikakumari-150119083542-conversion-gate02-thumbnail.jpg?width=640&height=640&fit=bounds)


