Downloaded 172 times

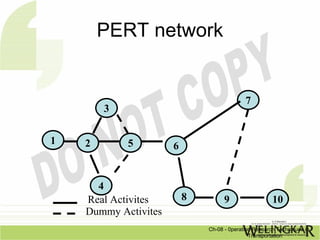
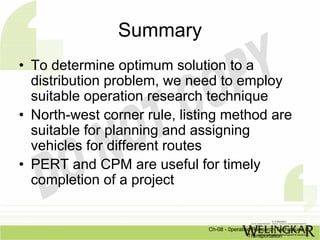
The document discusses various operation research techniques in transportation, focusing on methods like the North West Corner Rule and the Listing Method for optimizing distribution problems. Additionally, it covers project management techniques such as PERT and CPM to ensure timely completion of tasks by scheduling and resource allocation. The document emphasizes the importance of employing suitable models for effective planning and problem-solving in logistics and project management.


![Production & Operation Management Chapter25[1]](https://cdn.slidesharecdn.com/ss_thumbnails/chapter251-140613051641-phpapp02-thumbnail.jpg?width=640&height=640&fit=bounds)