- The document discusses receivables management. Receivables refer to amounts owed by customers from credit sales.
- The objectives of receivables management include optimizing investment in receivables, balancing credit sales and investment, maximizing firm value, and achieving a trade-off between risk and return.
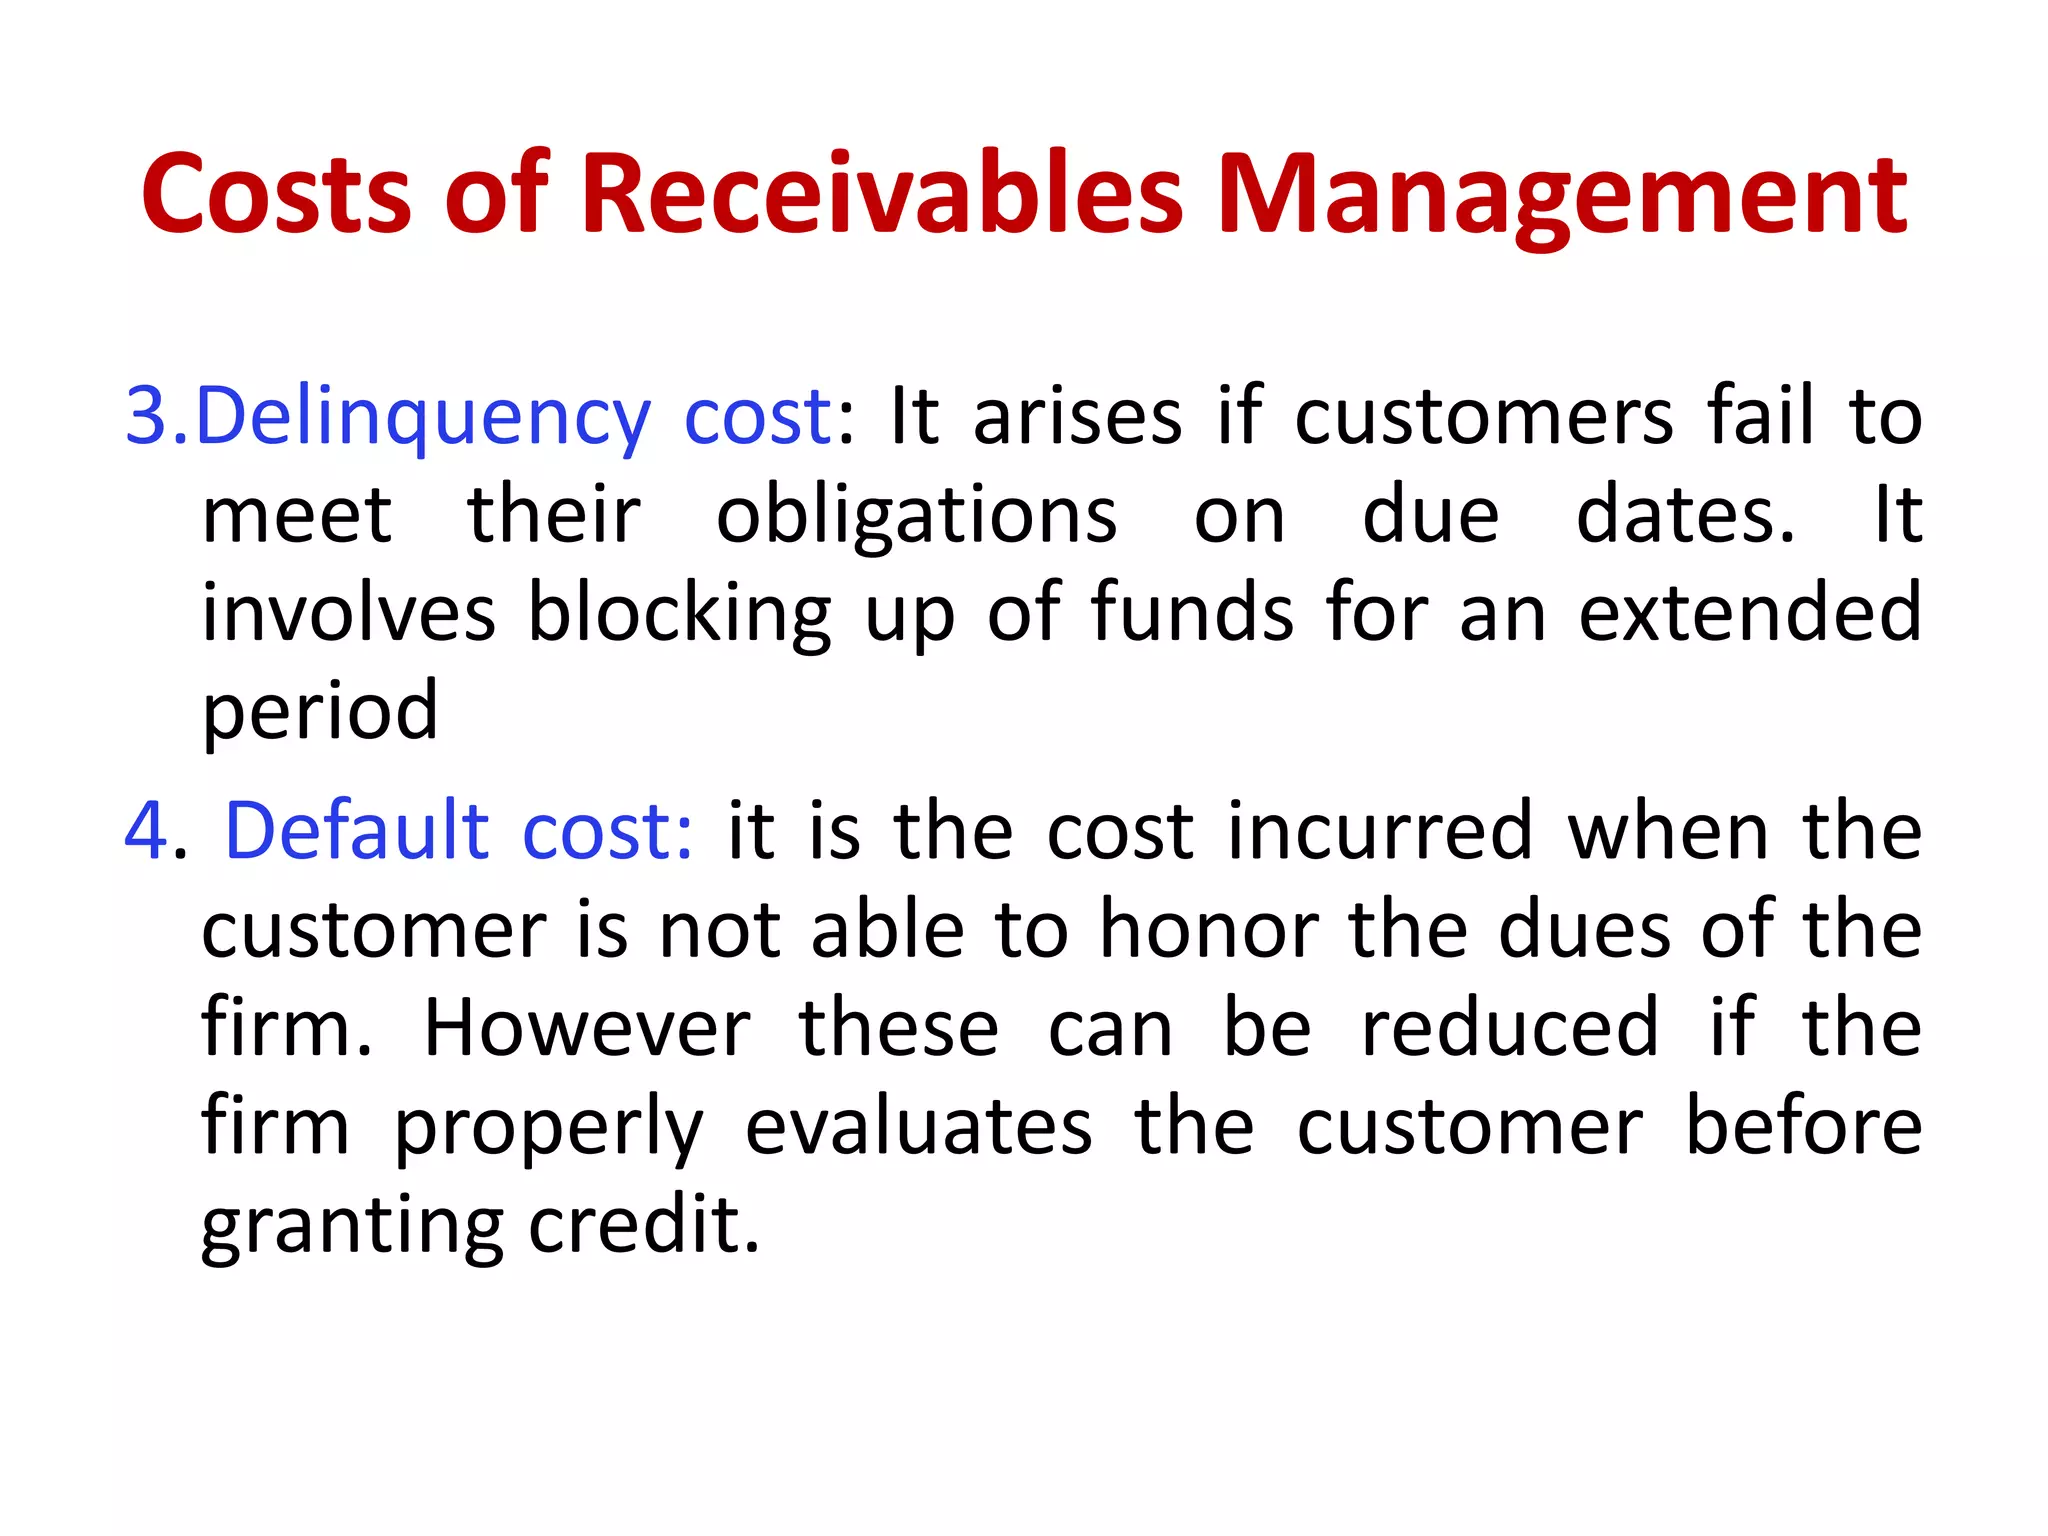
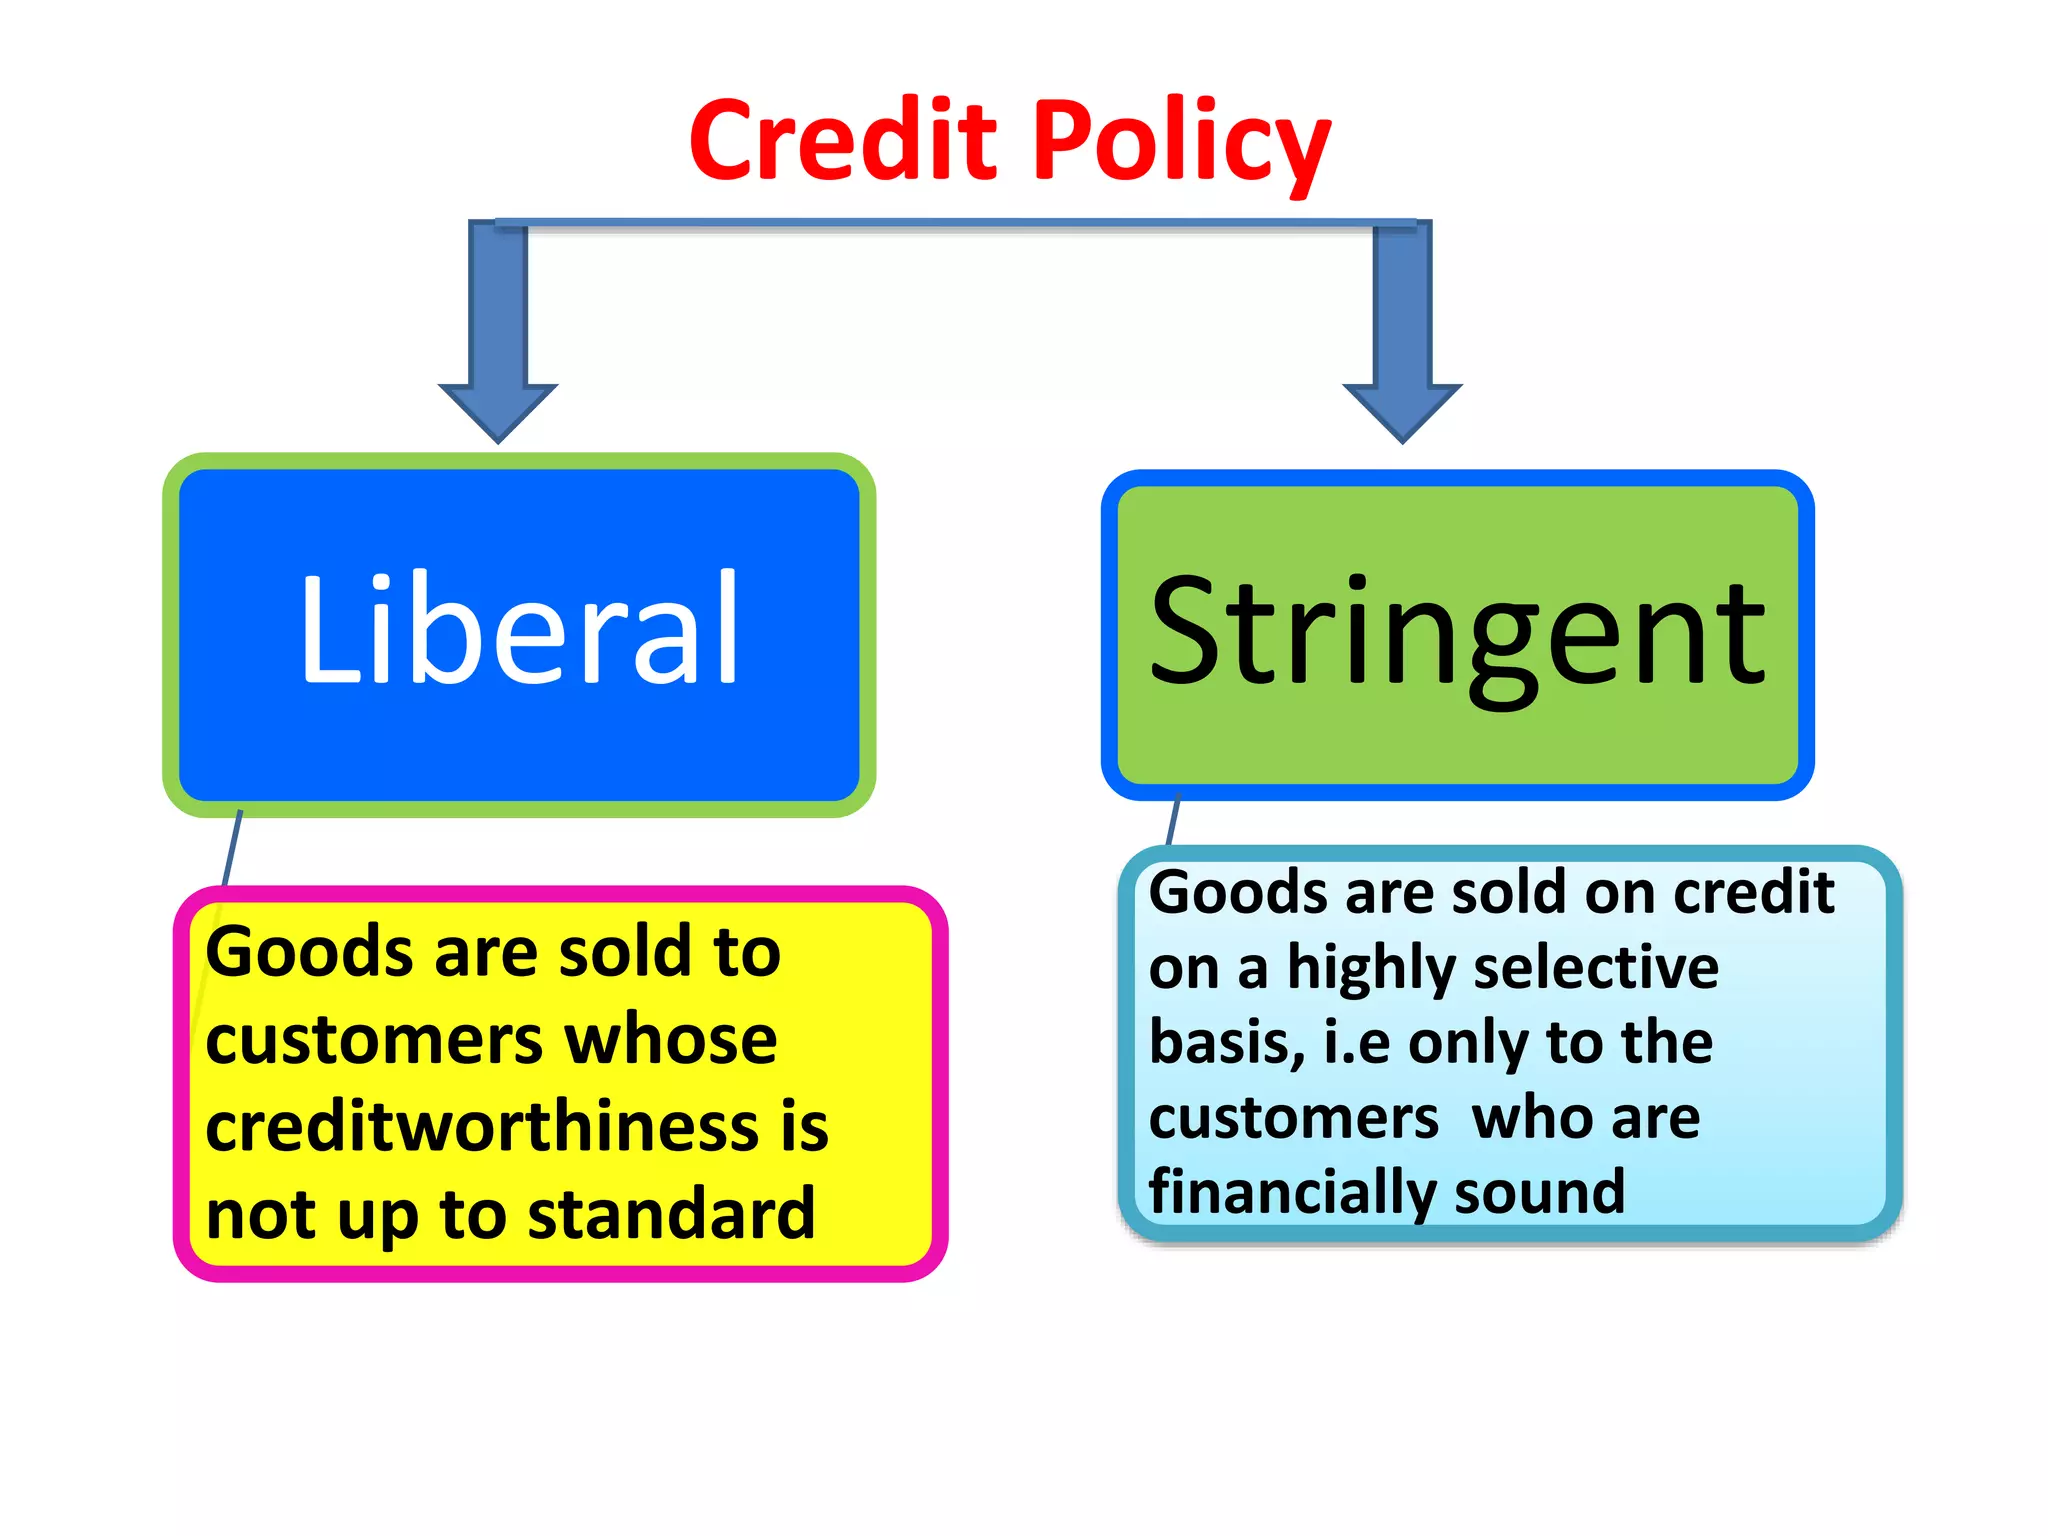
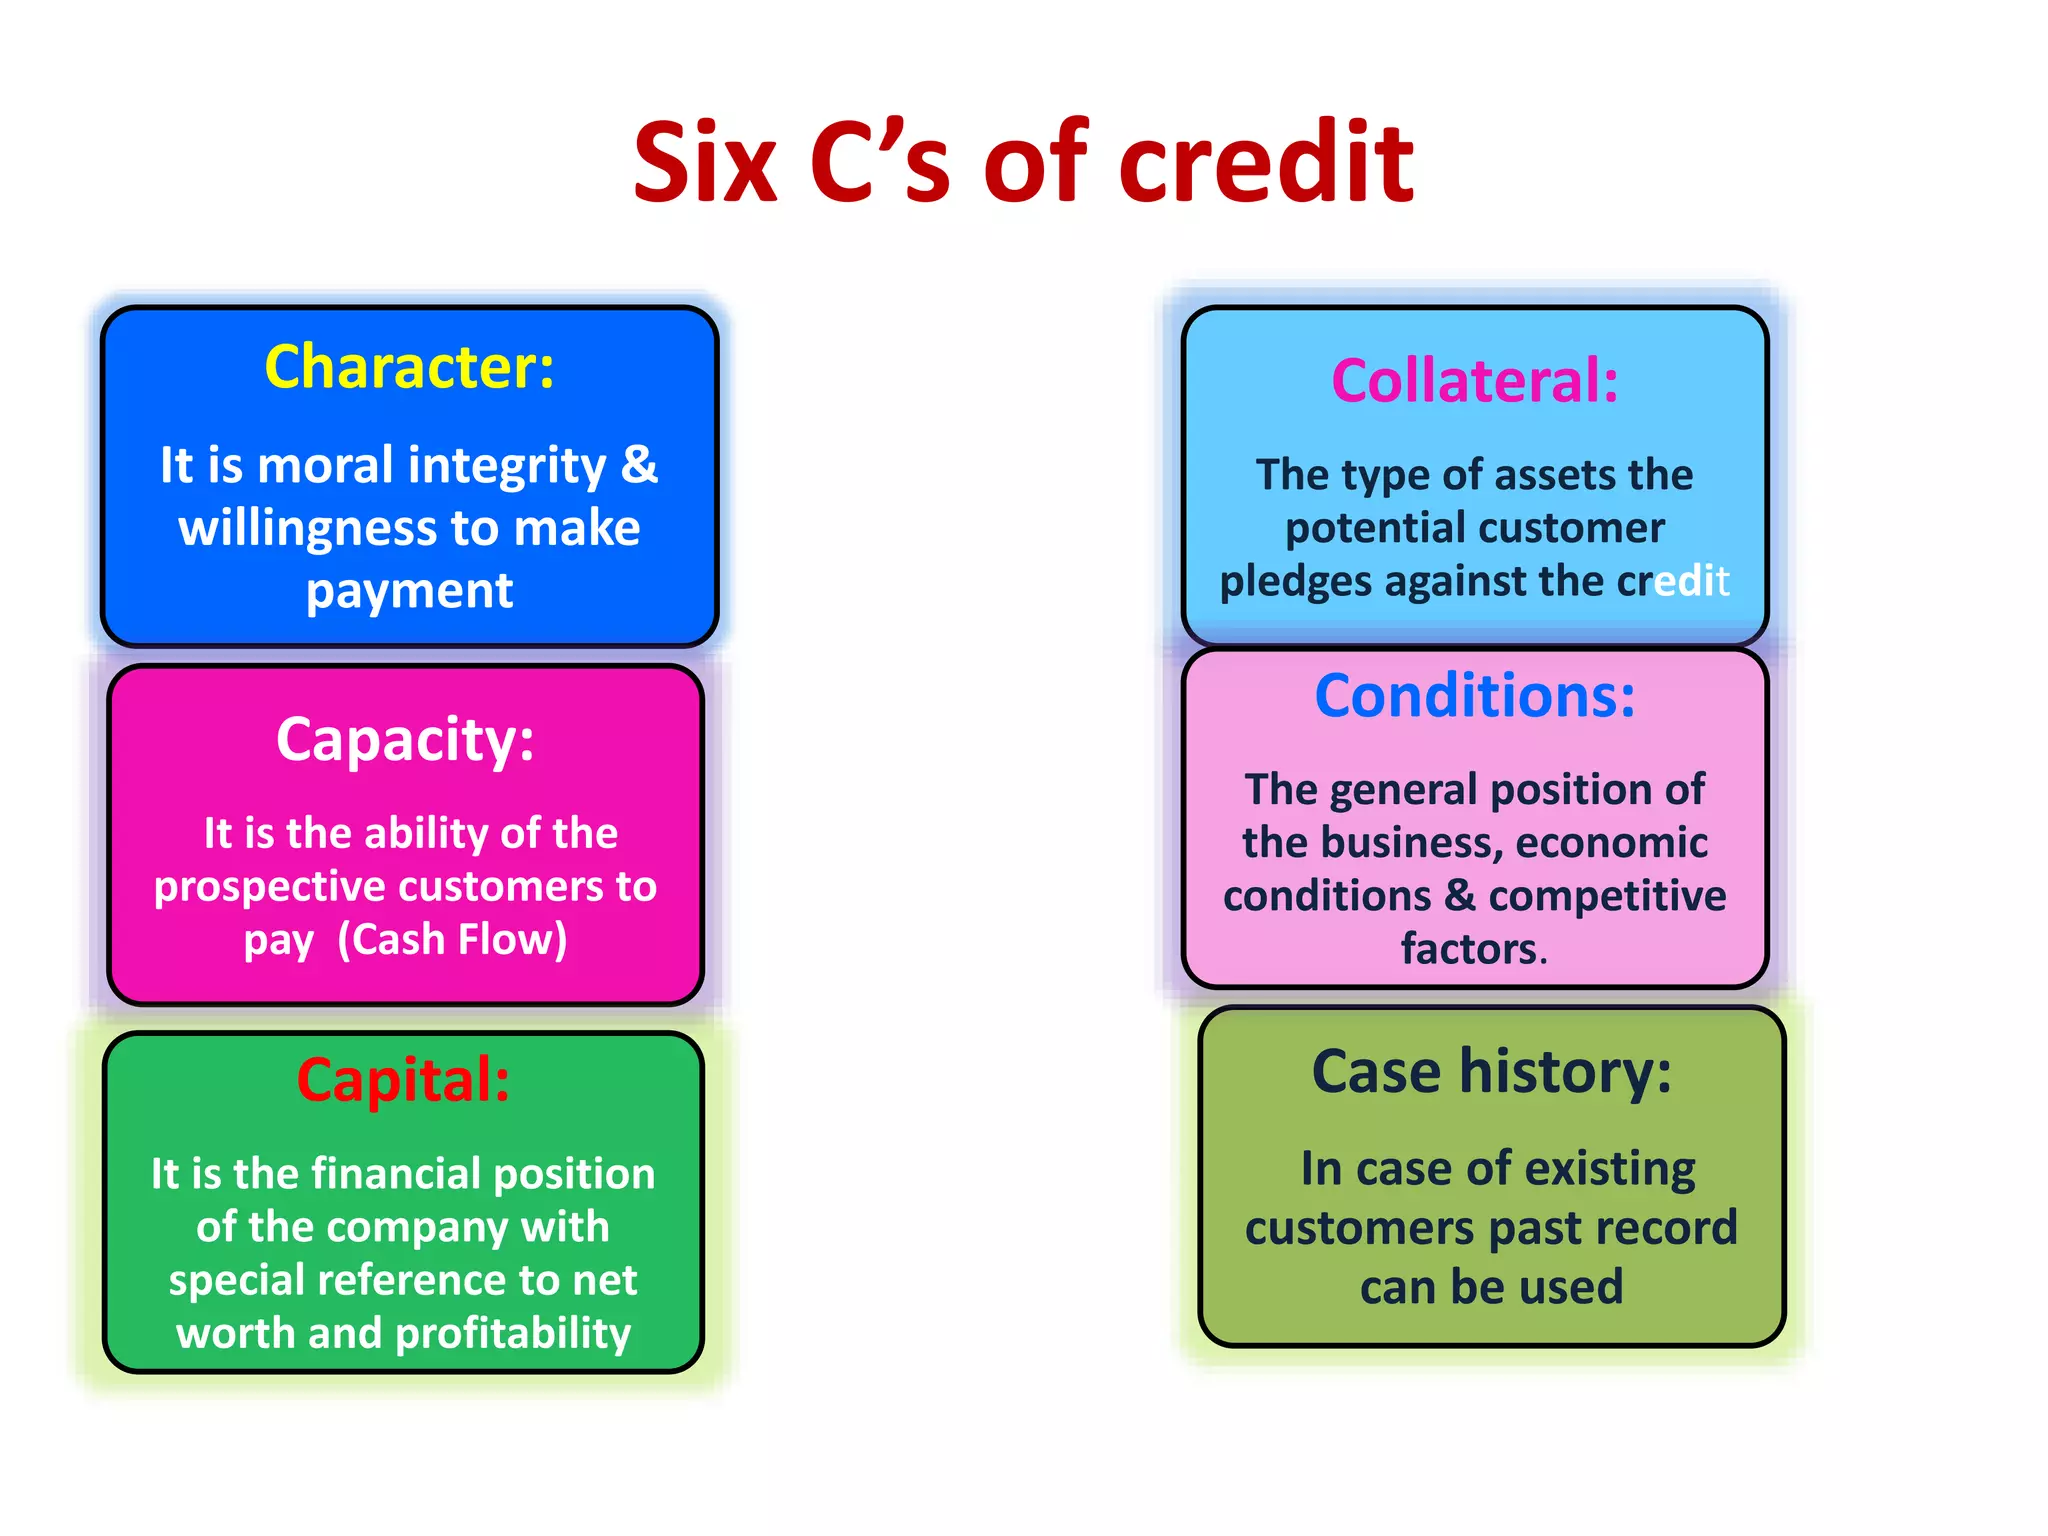
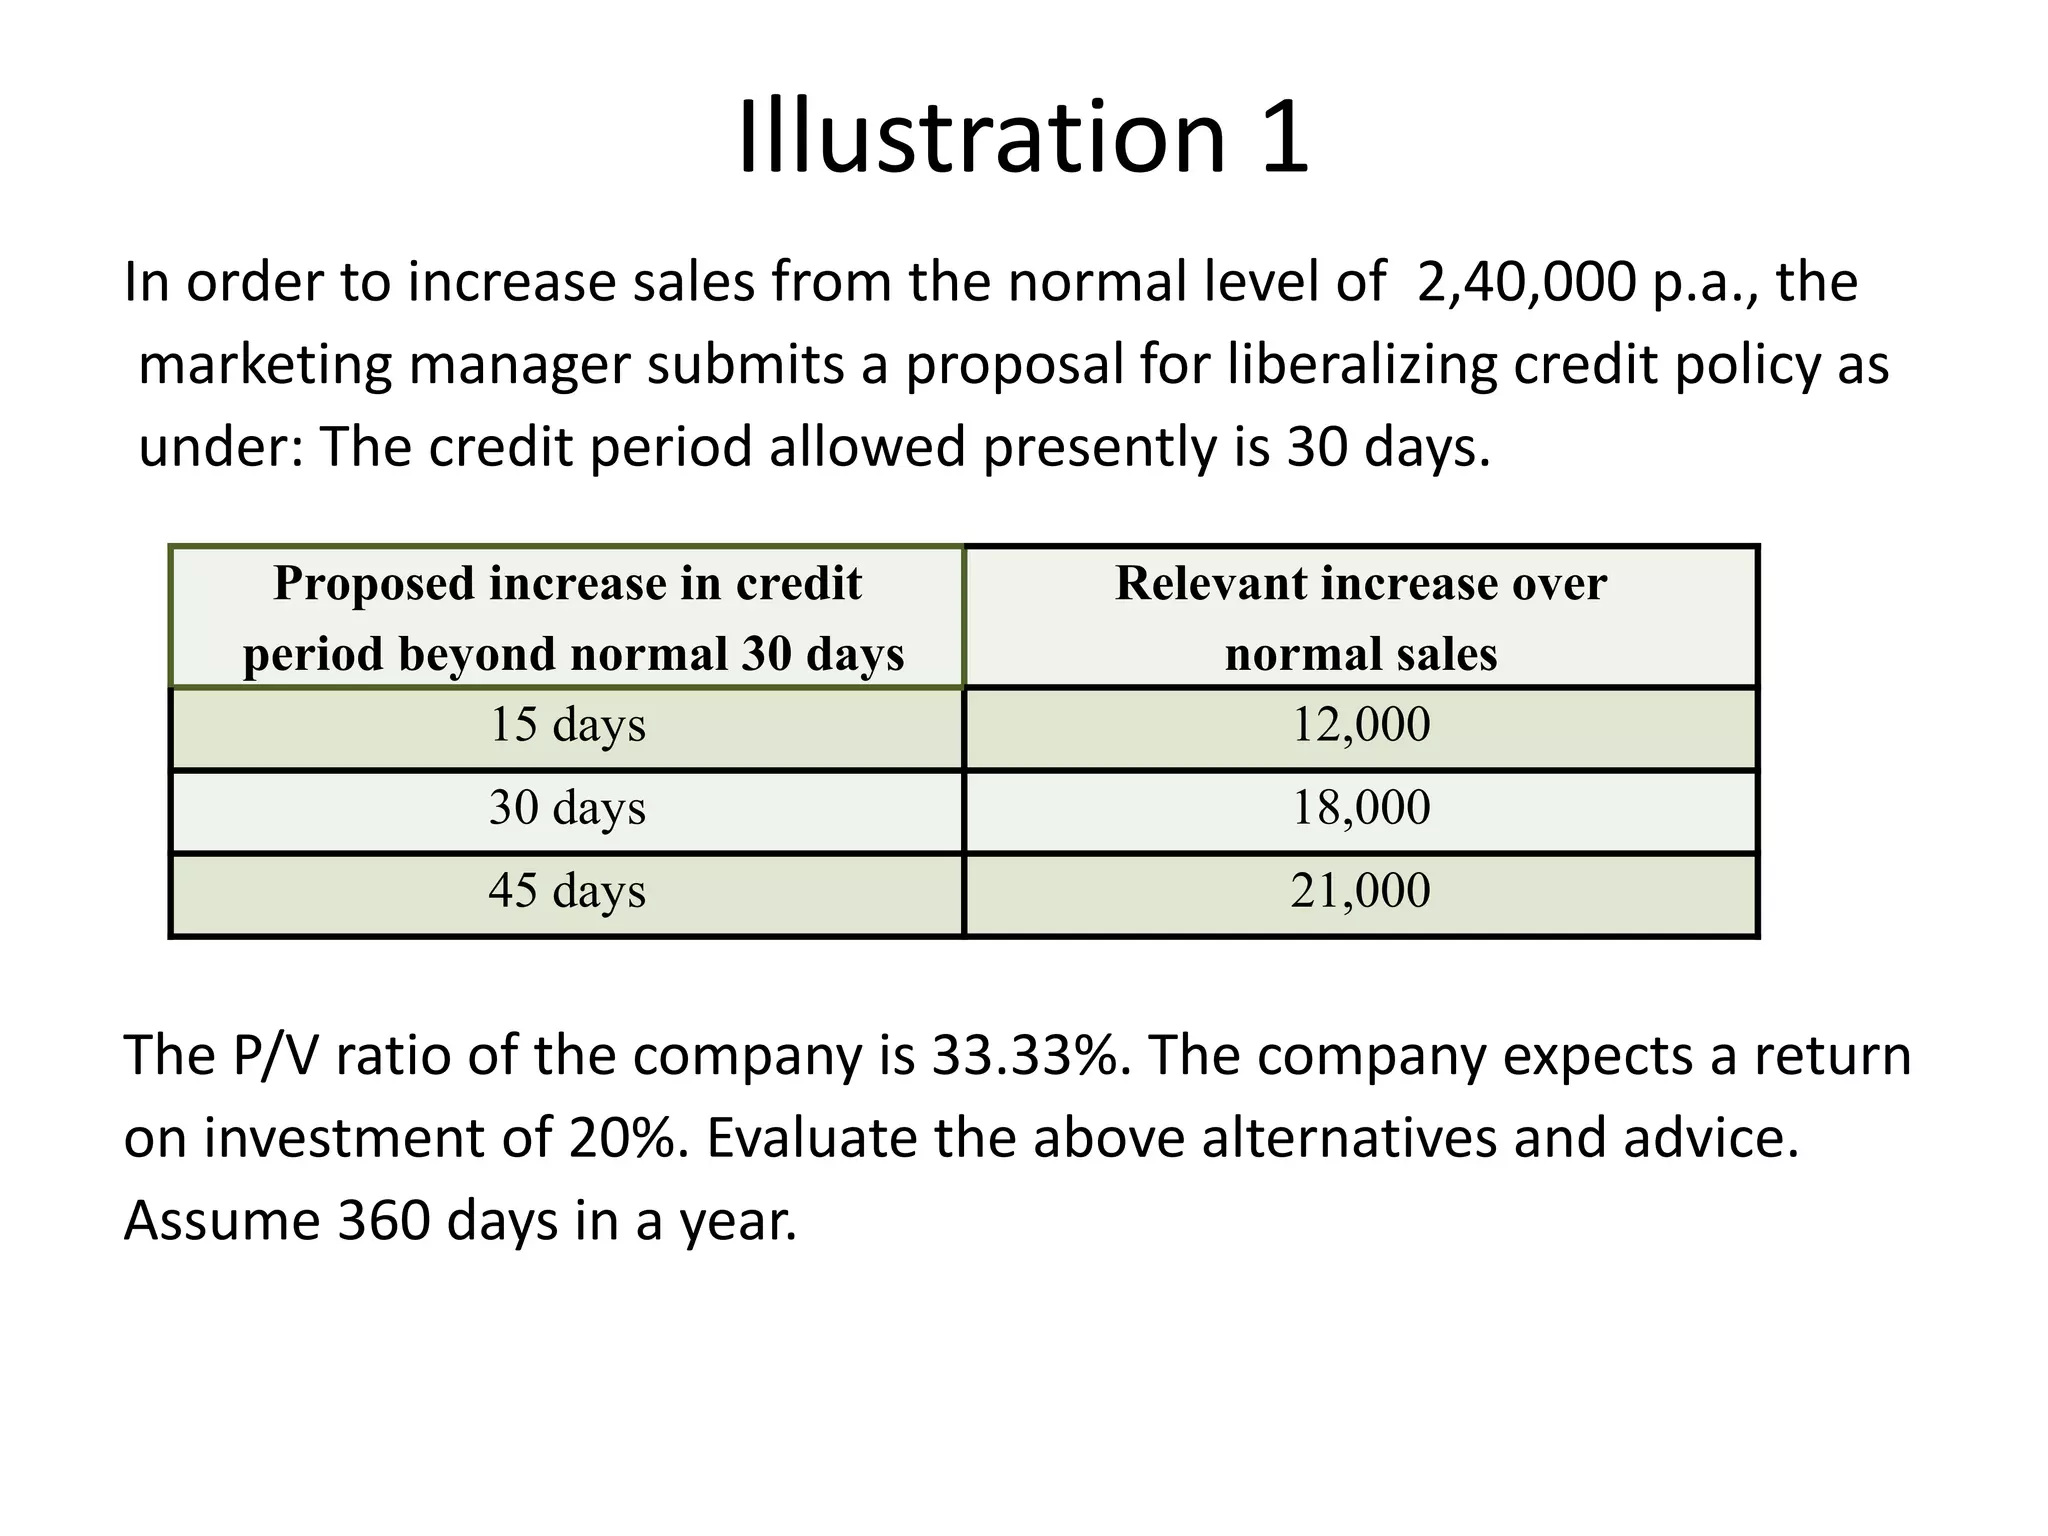
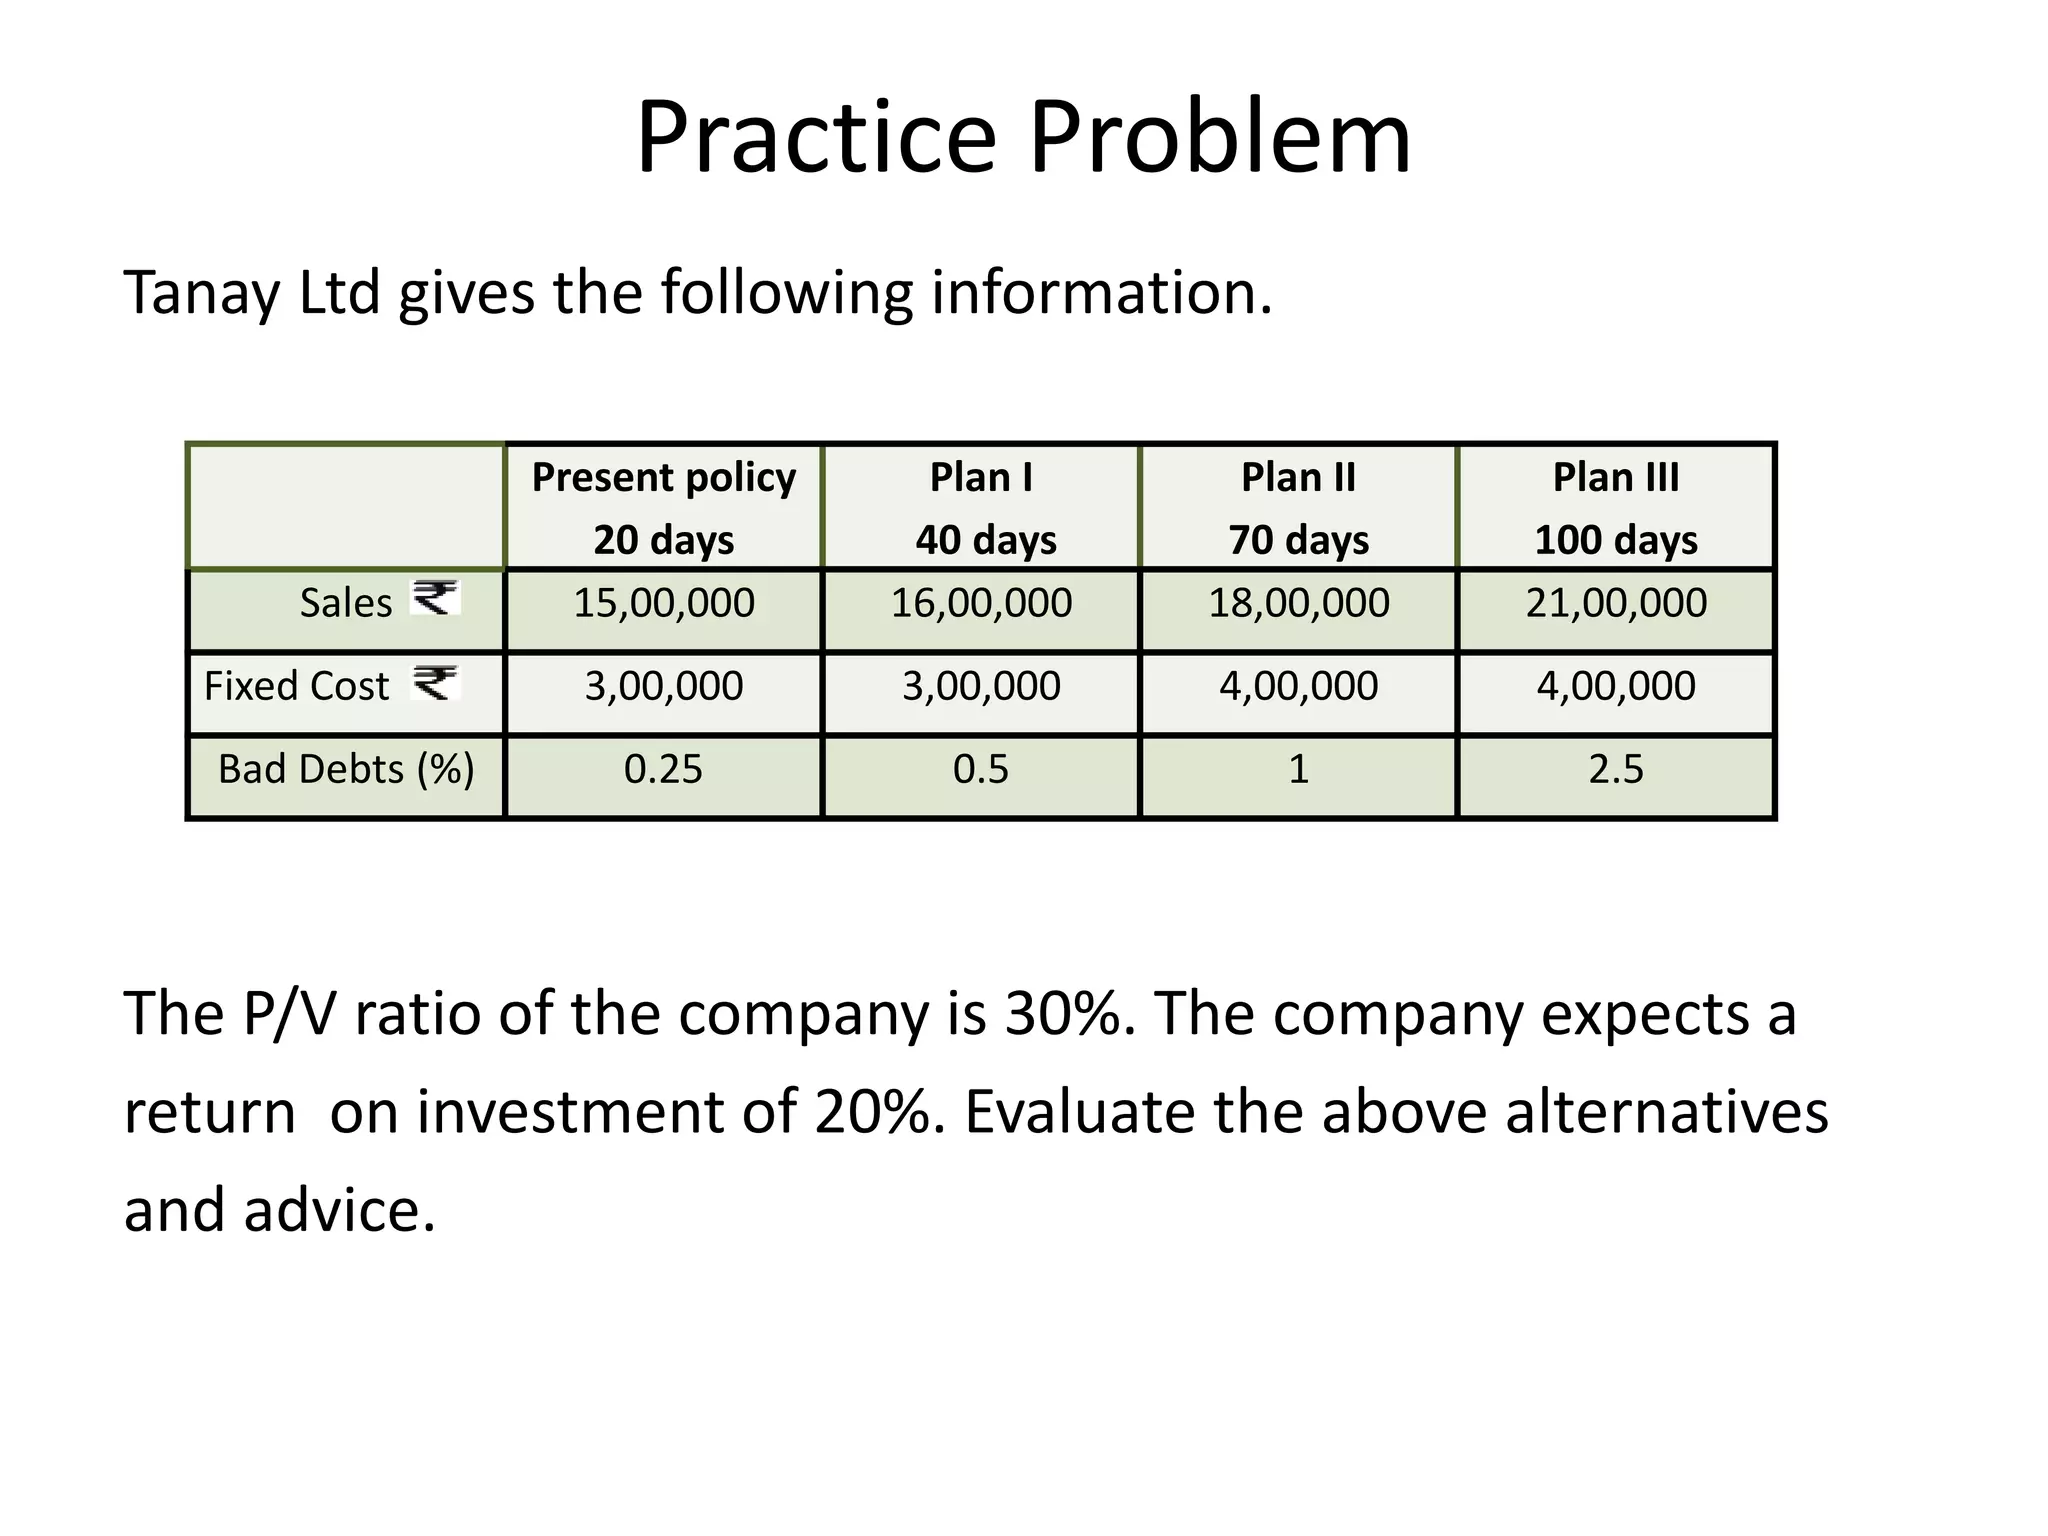
- Costs associated with receivables include opportunity costs, collection costs, delinquency costs, and default costs. Firms must choose an optimal credit policy that balances liberal policies which increase sales versus stringent policies which reduce risks.


![Unit ii marketing-investment_(marketing_finance)[1]](https://cdn.slidesharecdn.com/ss_thumbnails/unitii-marketinginvestmentmarketingfinance1-131127220034-phpapp02-thumbnail.jpg?width=640&height=640&fit=bounds)


