1) Hypothesis testing involves making an educated guess about a population parameter and designing a study to analyze sample data to determine if the population characteristic is likely or unlikely.
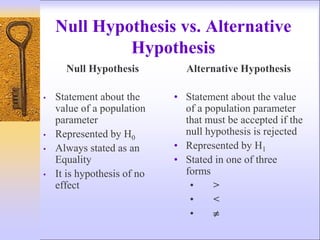
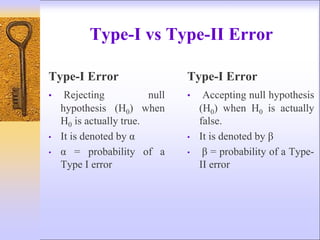
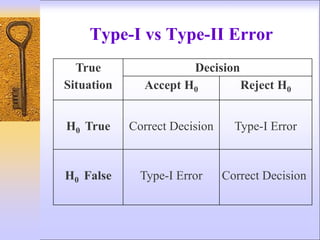
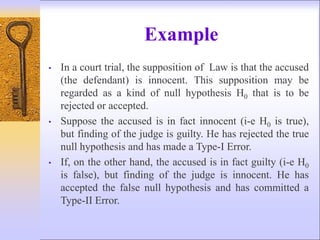
2) The null hypothesis states what is assumed to be true about the population parameter, while the alternative hypothesis is what would be accepted if the null is rejected. Type I and Type II errors occur when the wrong conclusion is reached.
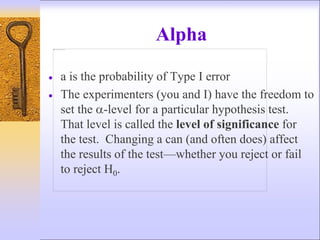
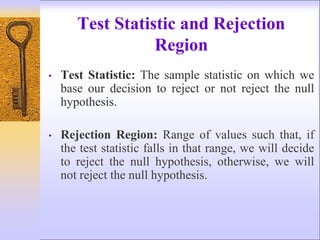
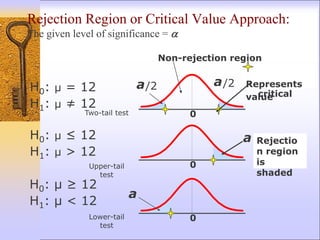
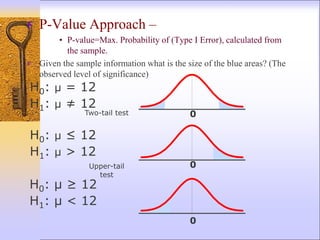
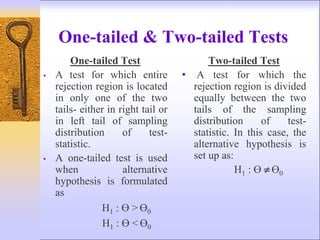
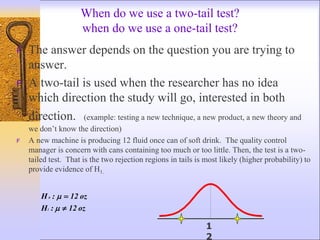
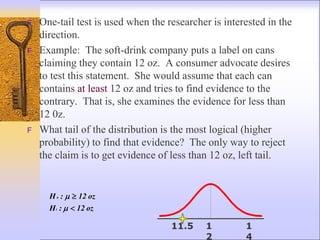
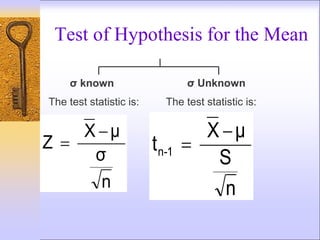
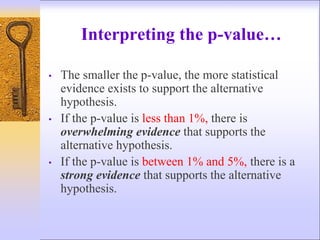
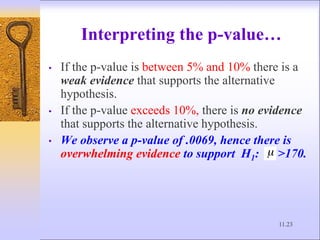
3) Key aspects of hypothesis testing include defining the test statistic, rejection region, significance level, and whether a one-tailed or two-tailed test is appropriate based on the alternative hypothesis.


![제 23회 보아즈(BOAZ) 빅데이터 컨퍼런스 - [MBOAX] : ABSA를 활용한 소비자 반응 분석 기반 운영 효율화 대시보드 설계](https://cdn.slidesharecdn.com/ss_thumbnails/3-1boaz23rdconferencemboax-260203102709-9d519923-thumbnail.jpg?width=640&height=640&fit=bounds)


