Downloaded 968 times


![Prediction Accuracy: MAE
(MAE) Mean Absolute Error:
Example: 5-star scale [1, 5], an MAE of 0.7 means that the algorithm, on average,
was off by 0.7 stars.
This is useful for understanding the results in a particular context, but makes it
difficult to compare results across data sets as they have differing rating ranges
(NMAE) Normalized mean absolute error: Divides the ranges of possible ratings
and thus a common metric range of [0,1]](https://image.slidesharecdn.com/search-160125144406/75/Collaborative-Filtering-Recommendation-System-22-2048.jpg)


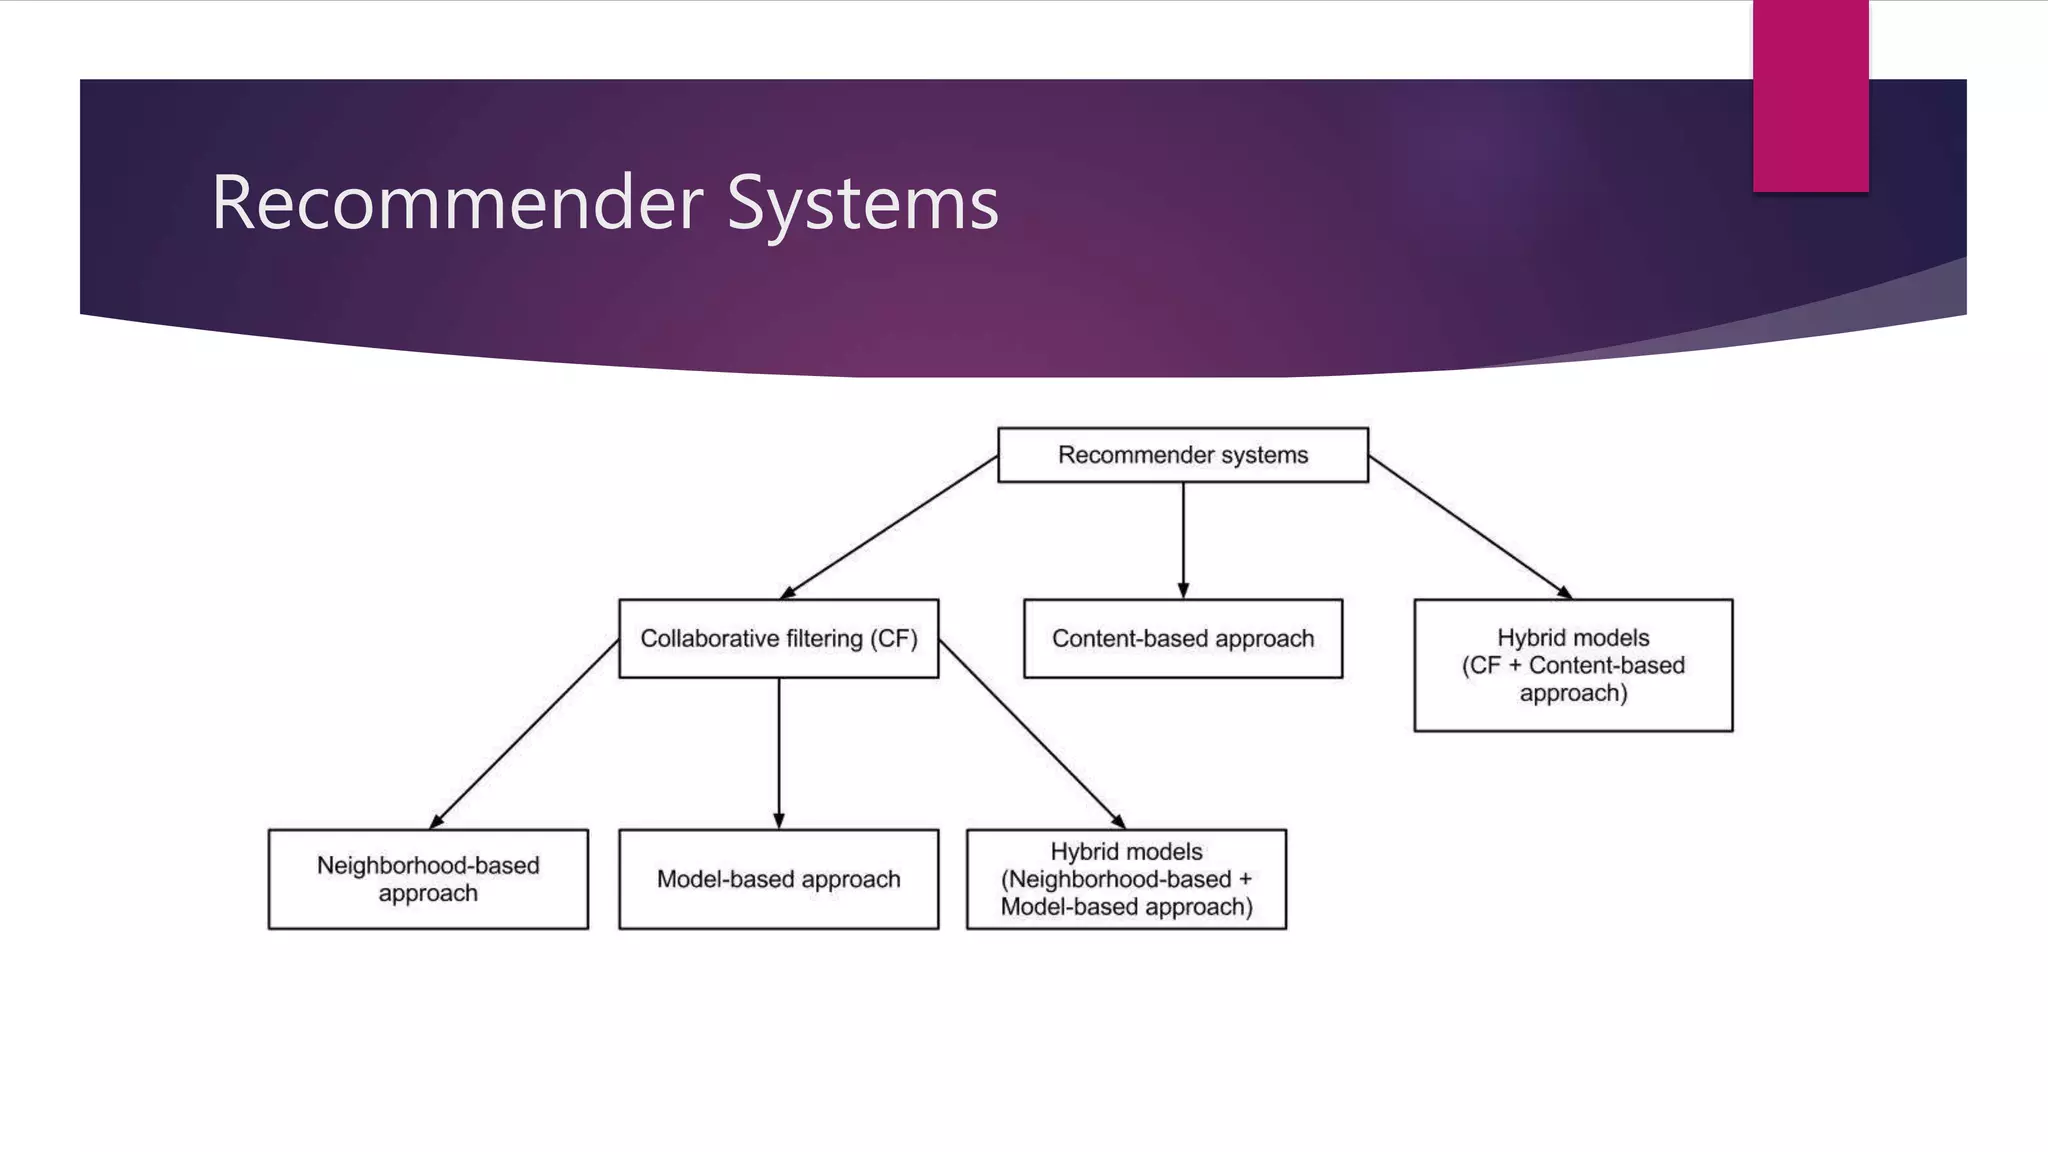
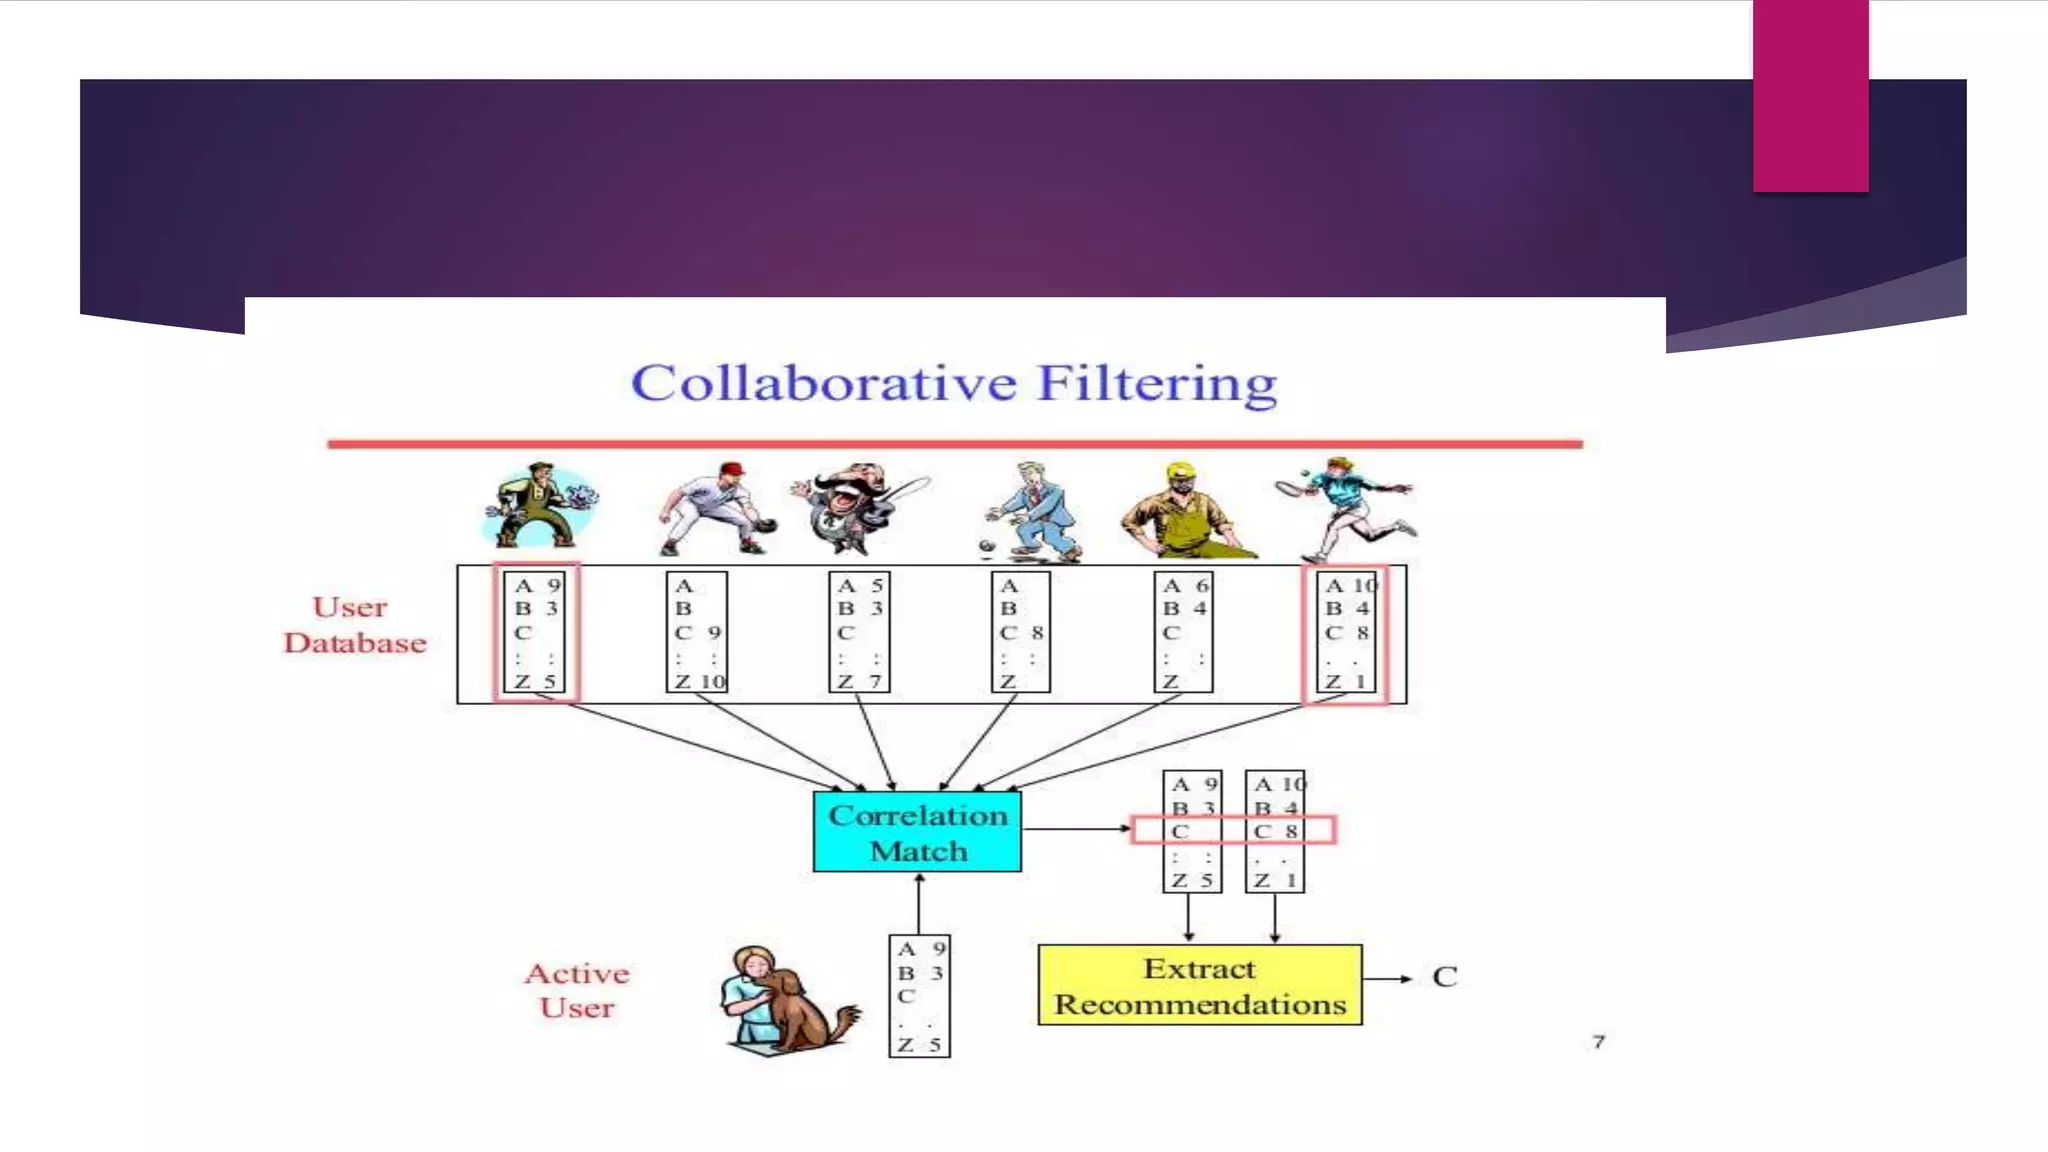
Collaborative filtering is a technique used in recommender systems to predict a user's preferences based on other similar users' preferences. It involves collecting ratings data from users, calculating similarities between users or items, and making recommendations. Common approaches include user-user collaborative filtering, item-item collaborative filtering, and probabilistic matrix factorization. Recommender systems are evaluated both offline using metrics like MAE and RMSE, and through online user testing.
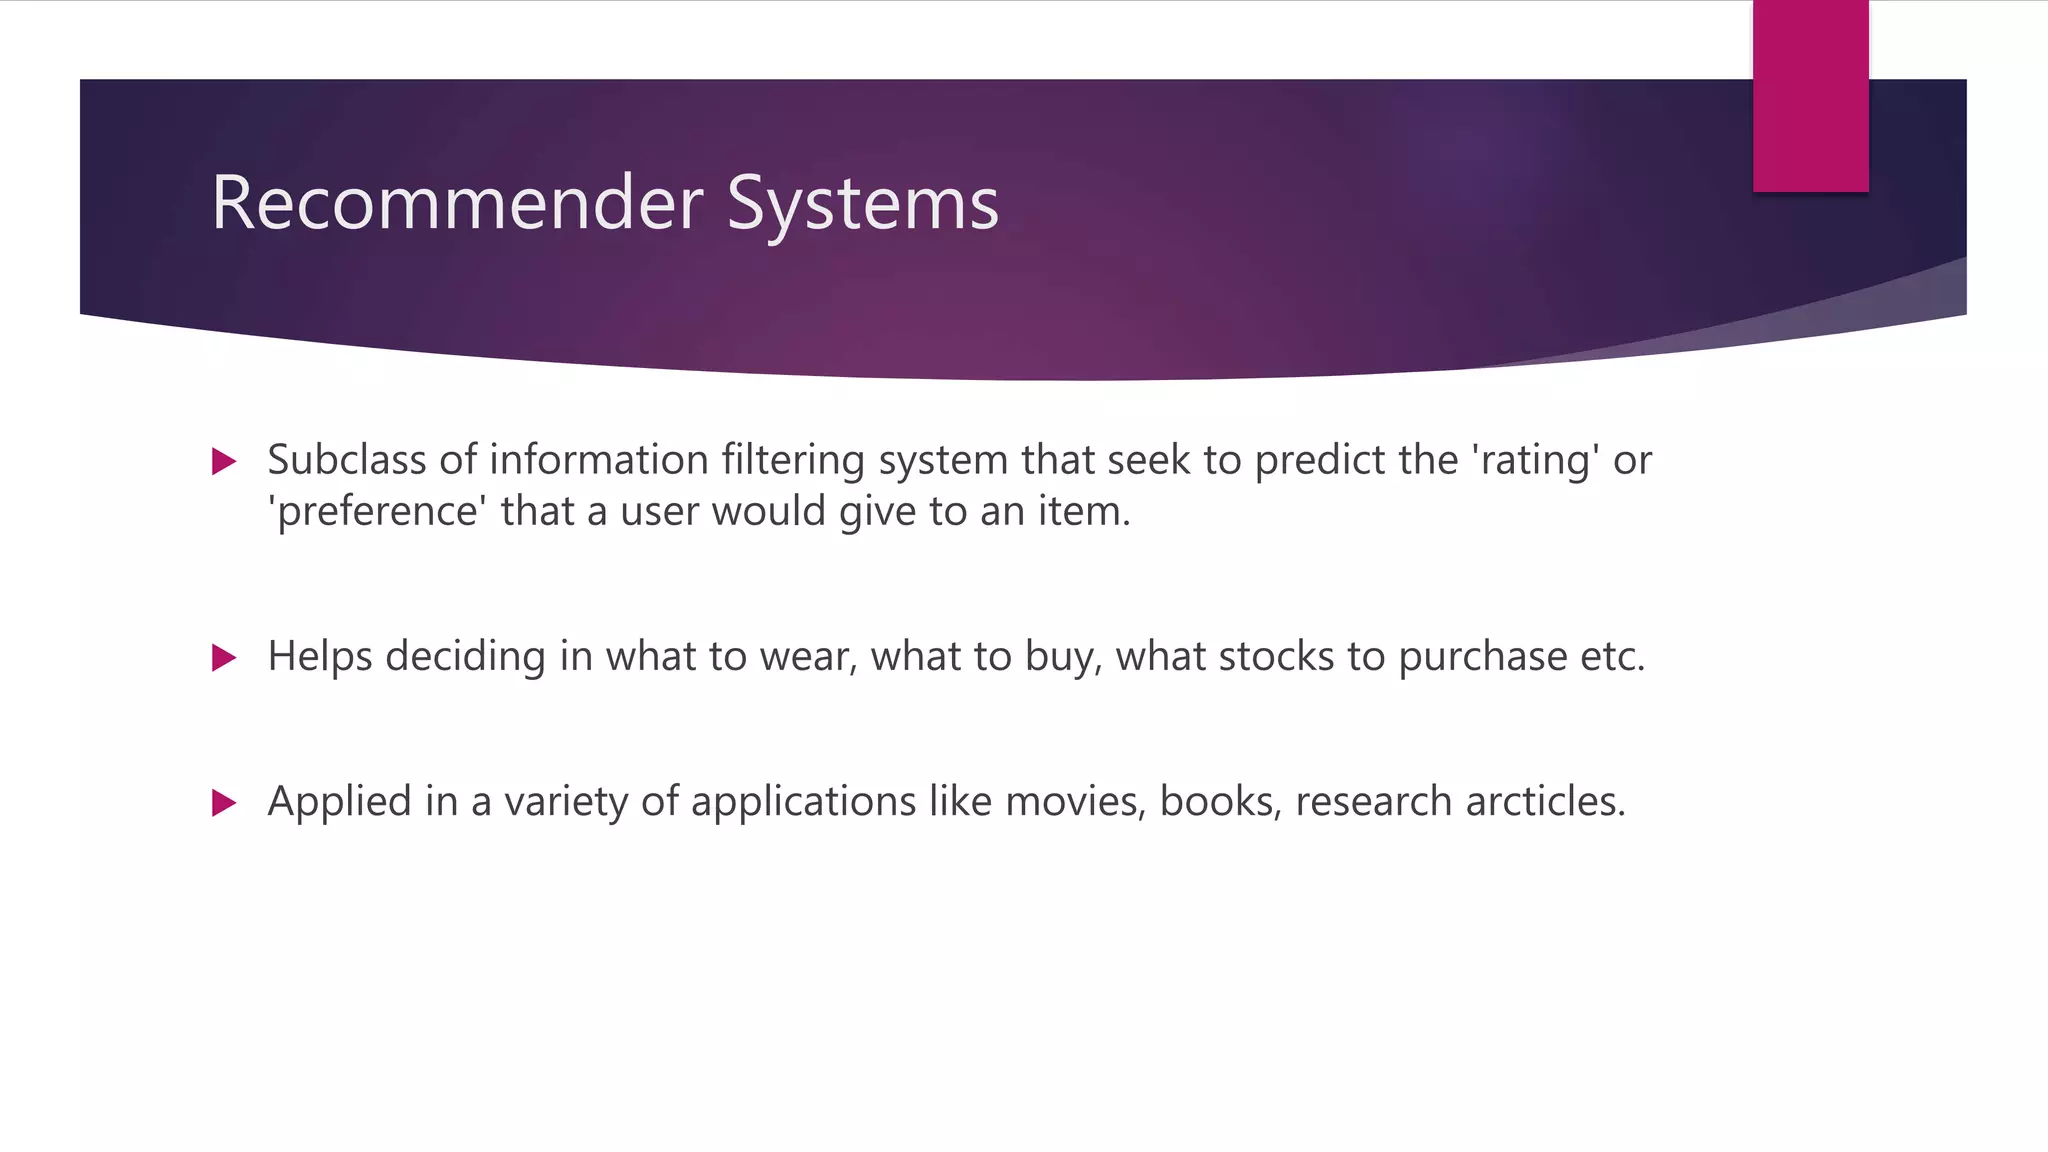
Introduction to recommender systems focusing on collaborative filtering and its applications.
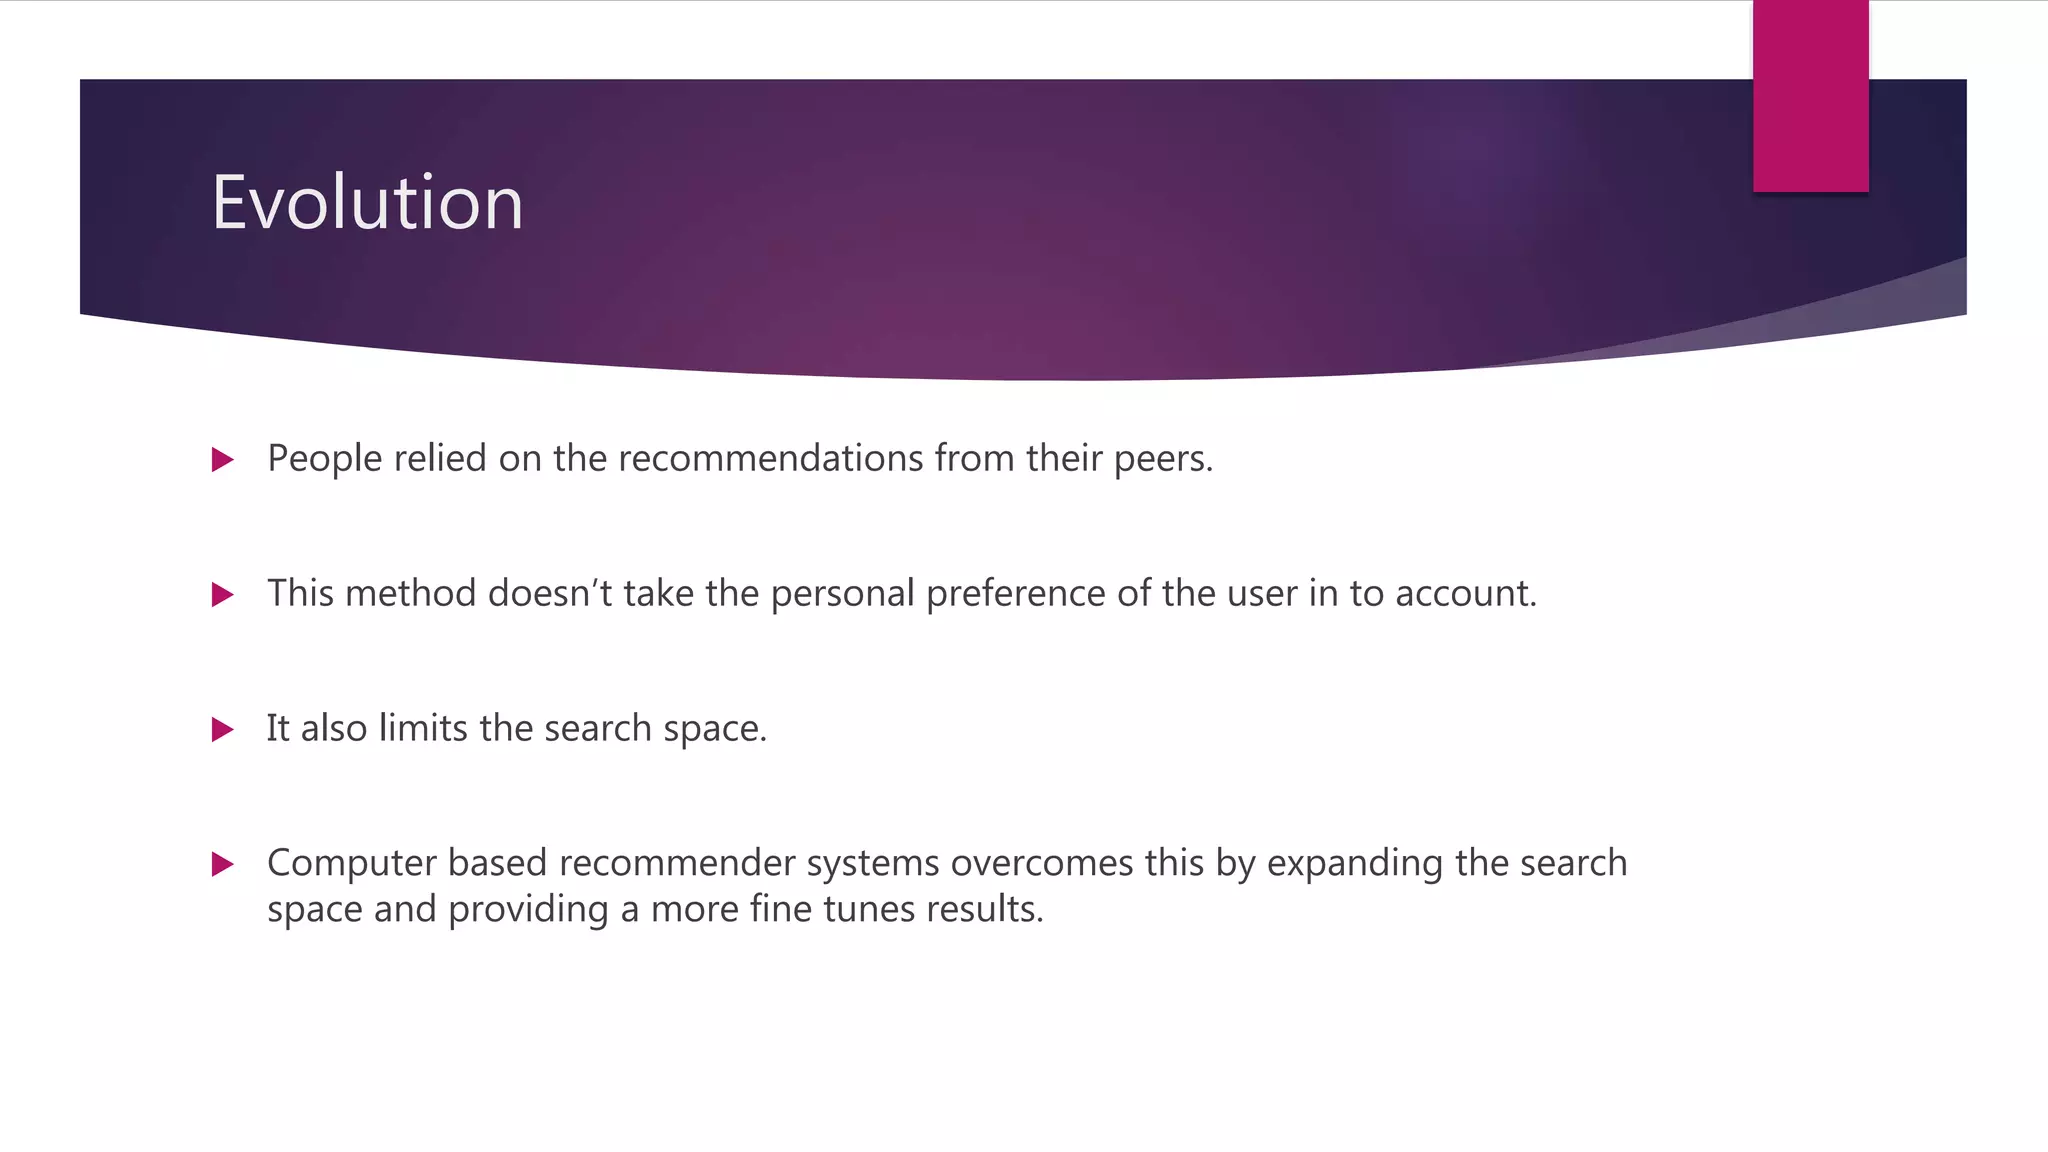
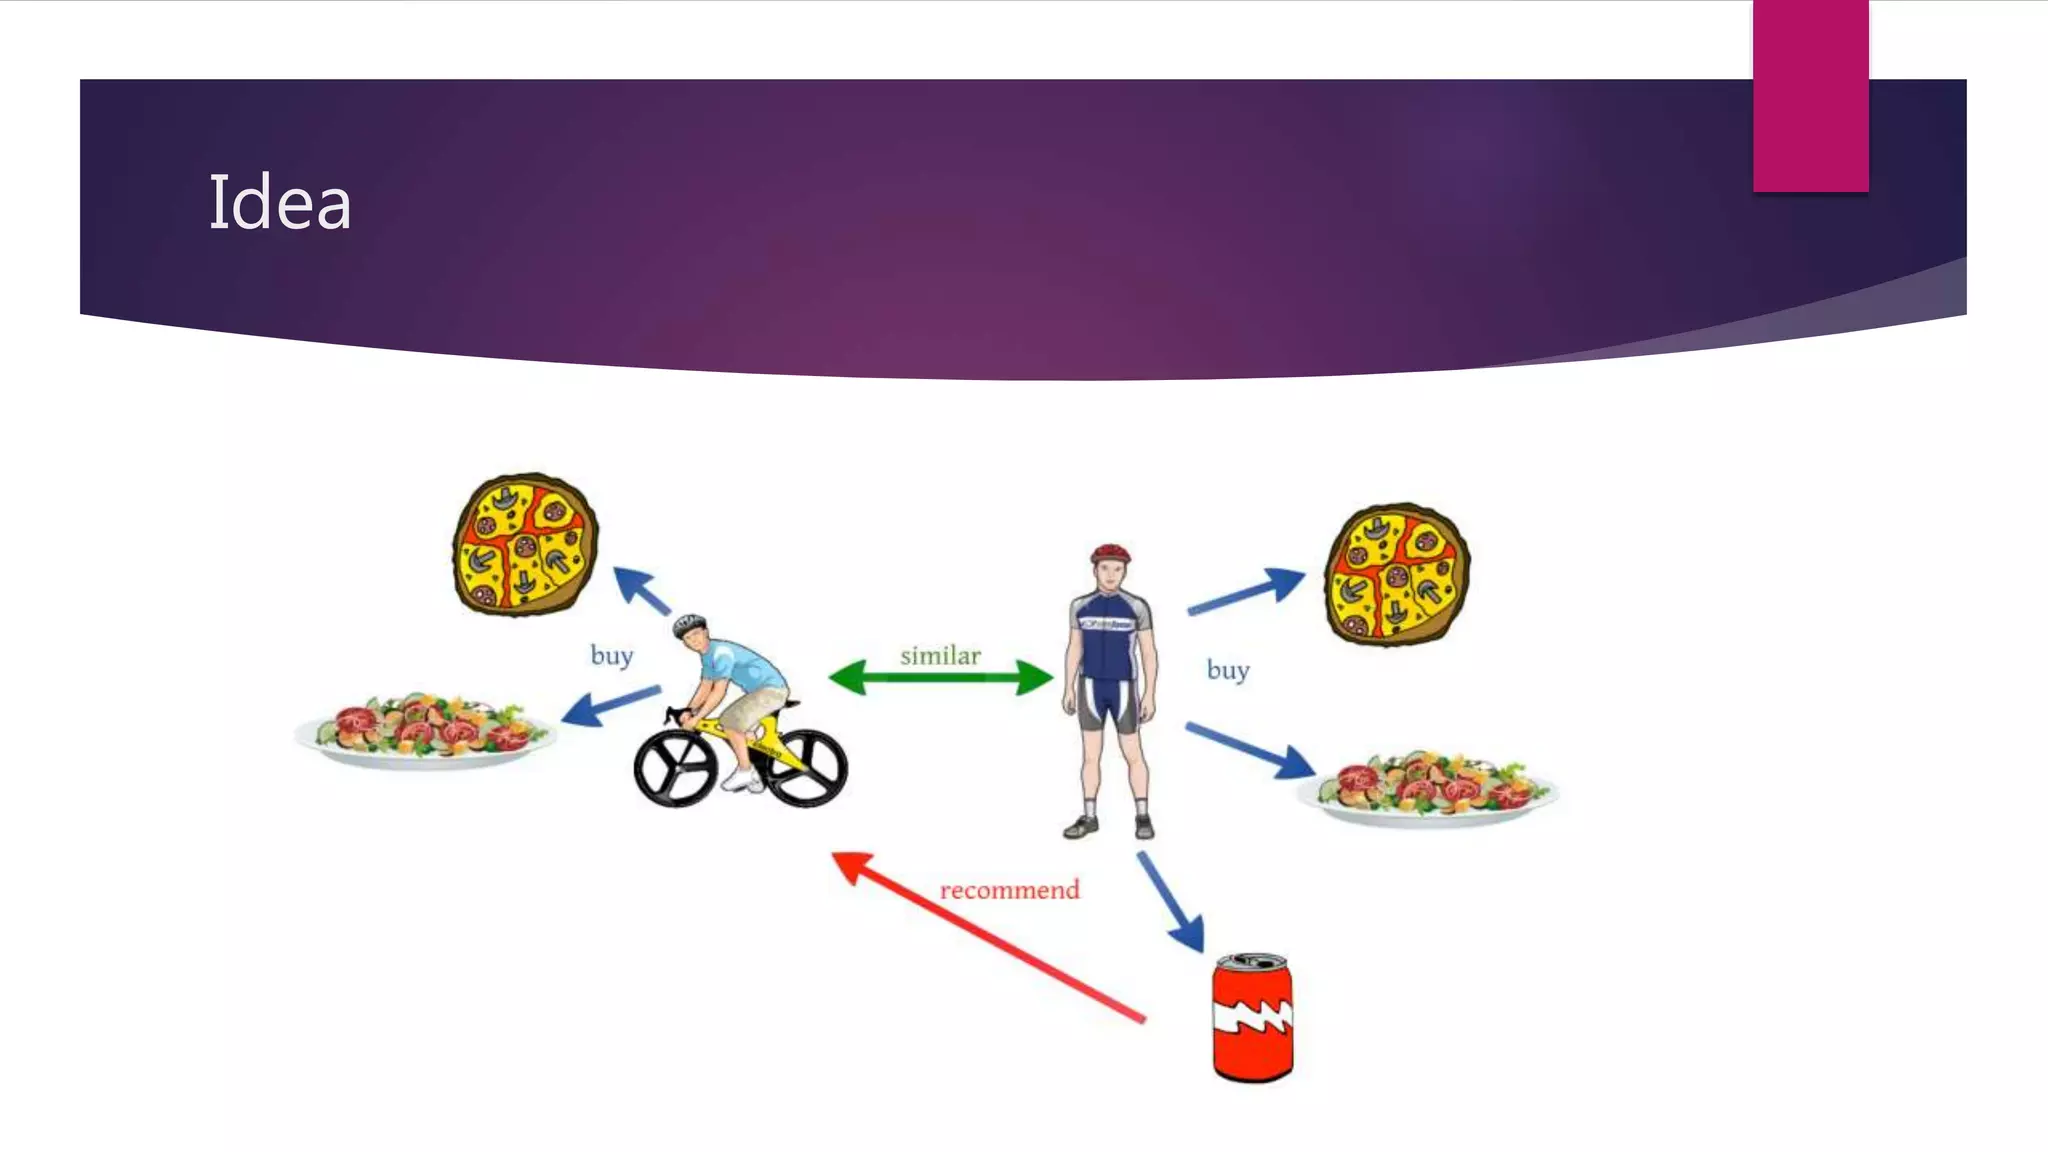
Discussion on the evolution of recommendations from peer input to automated systems using collaborative filtering.
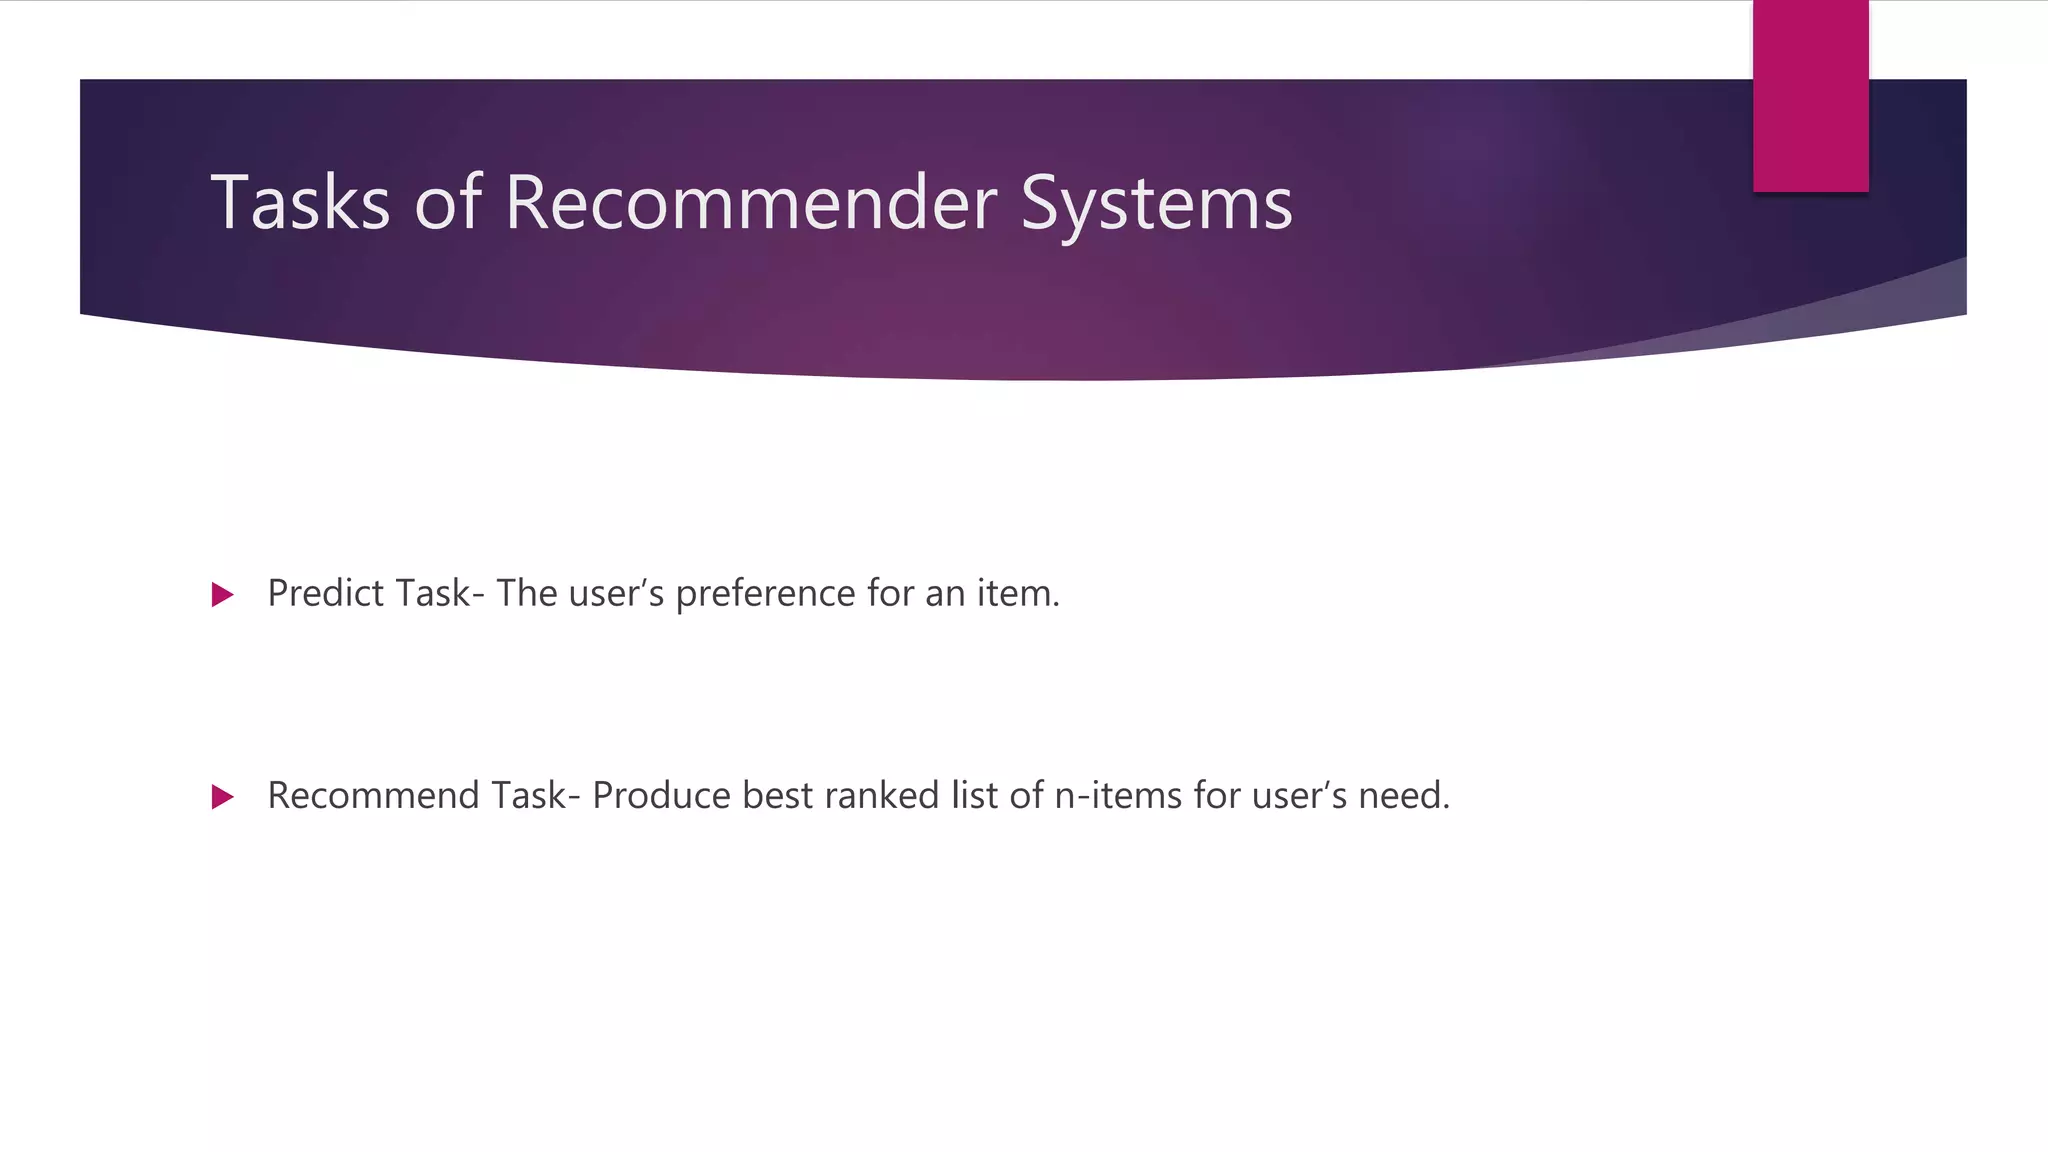
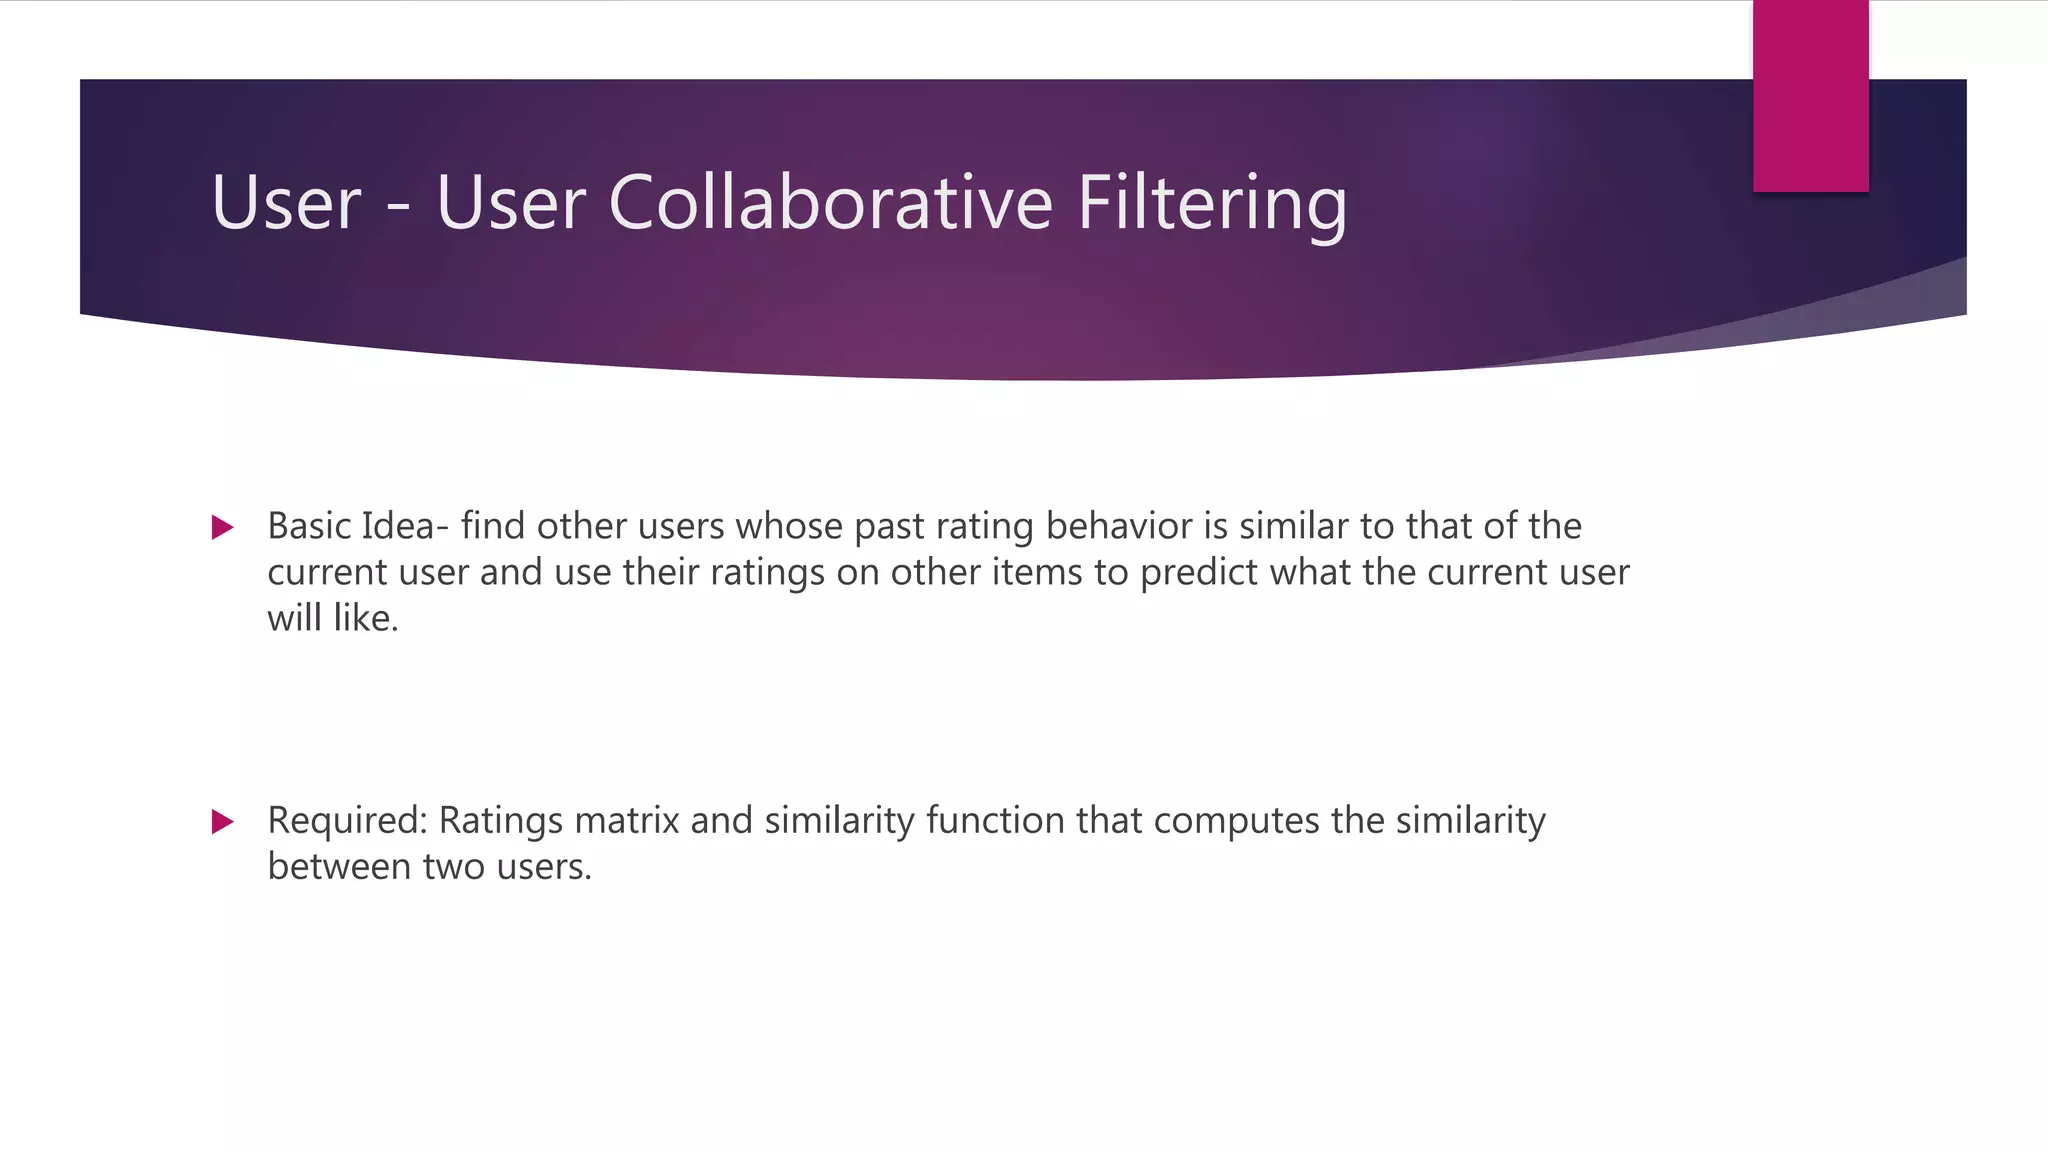
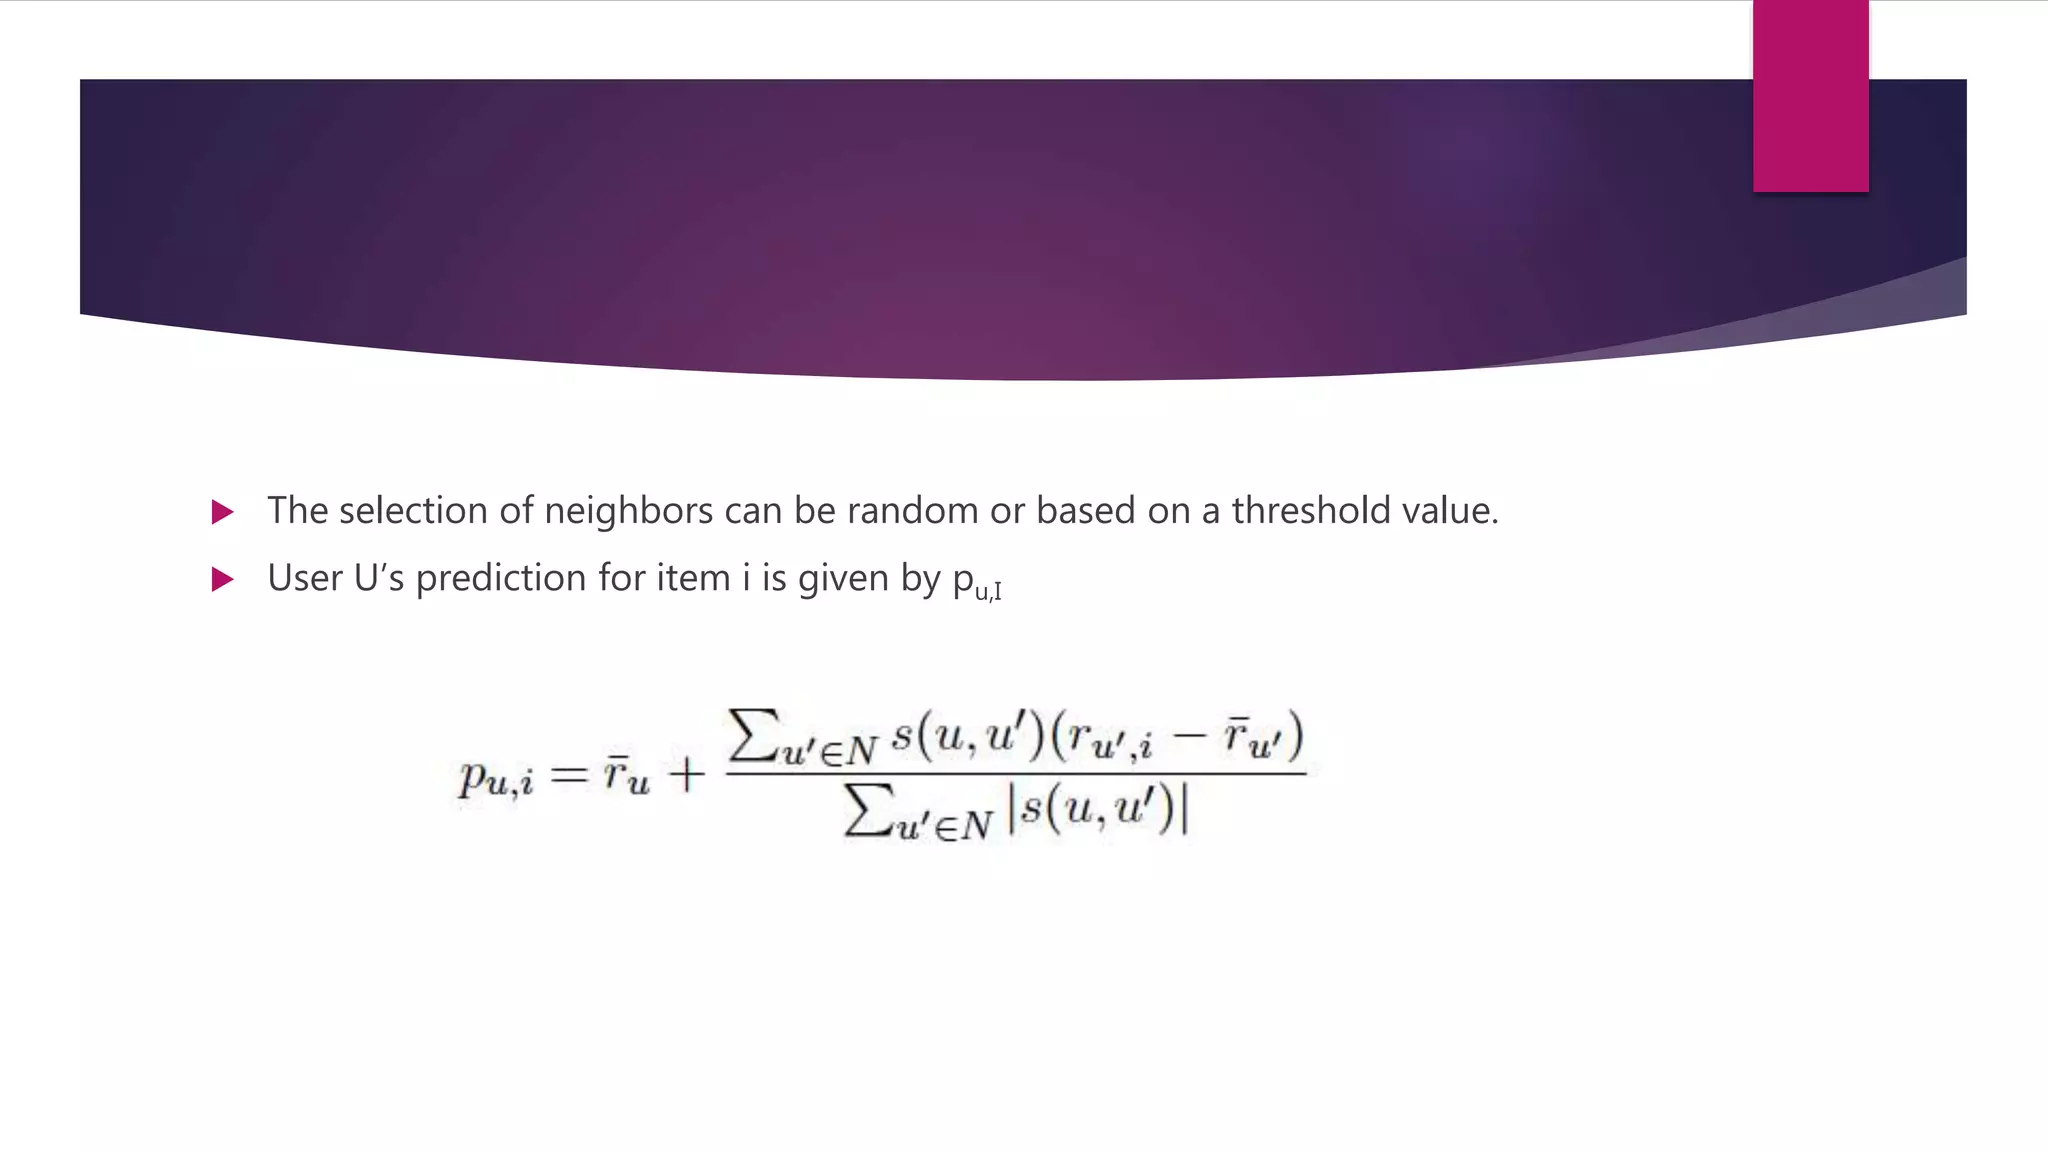
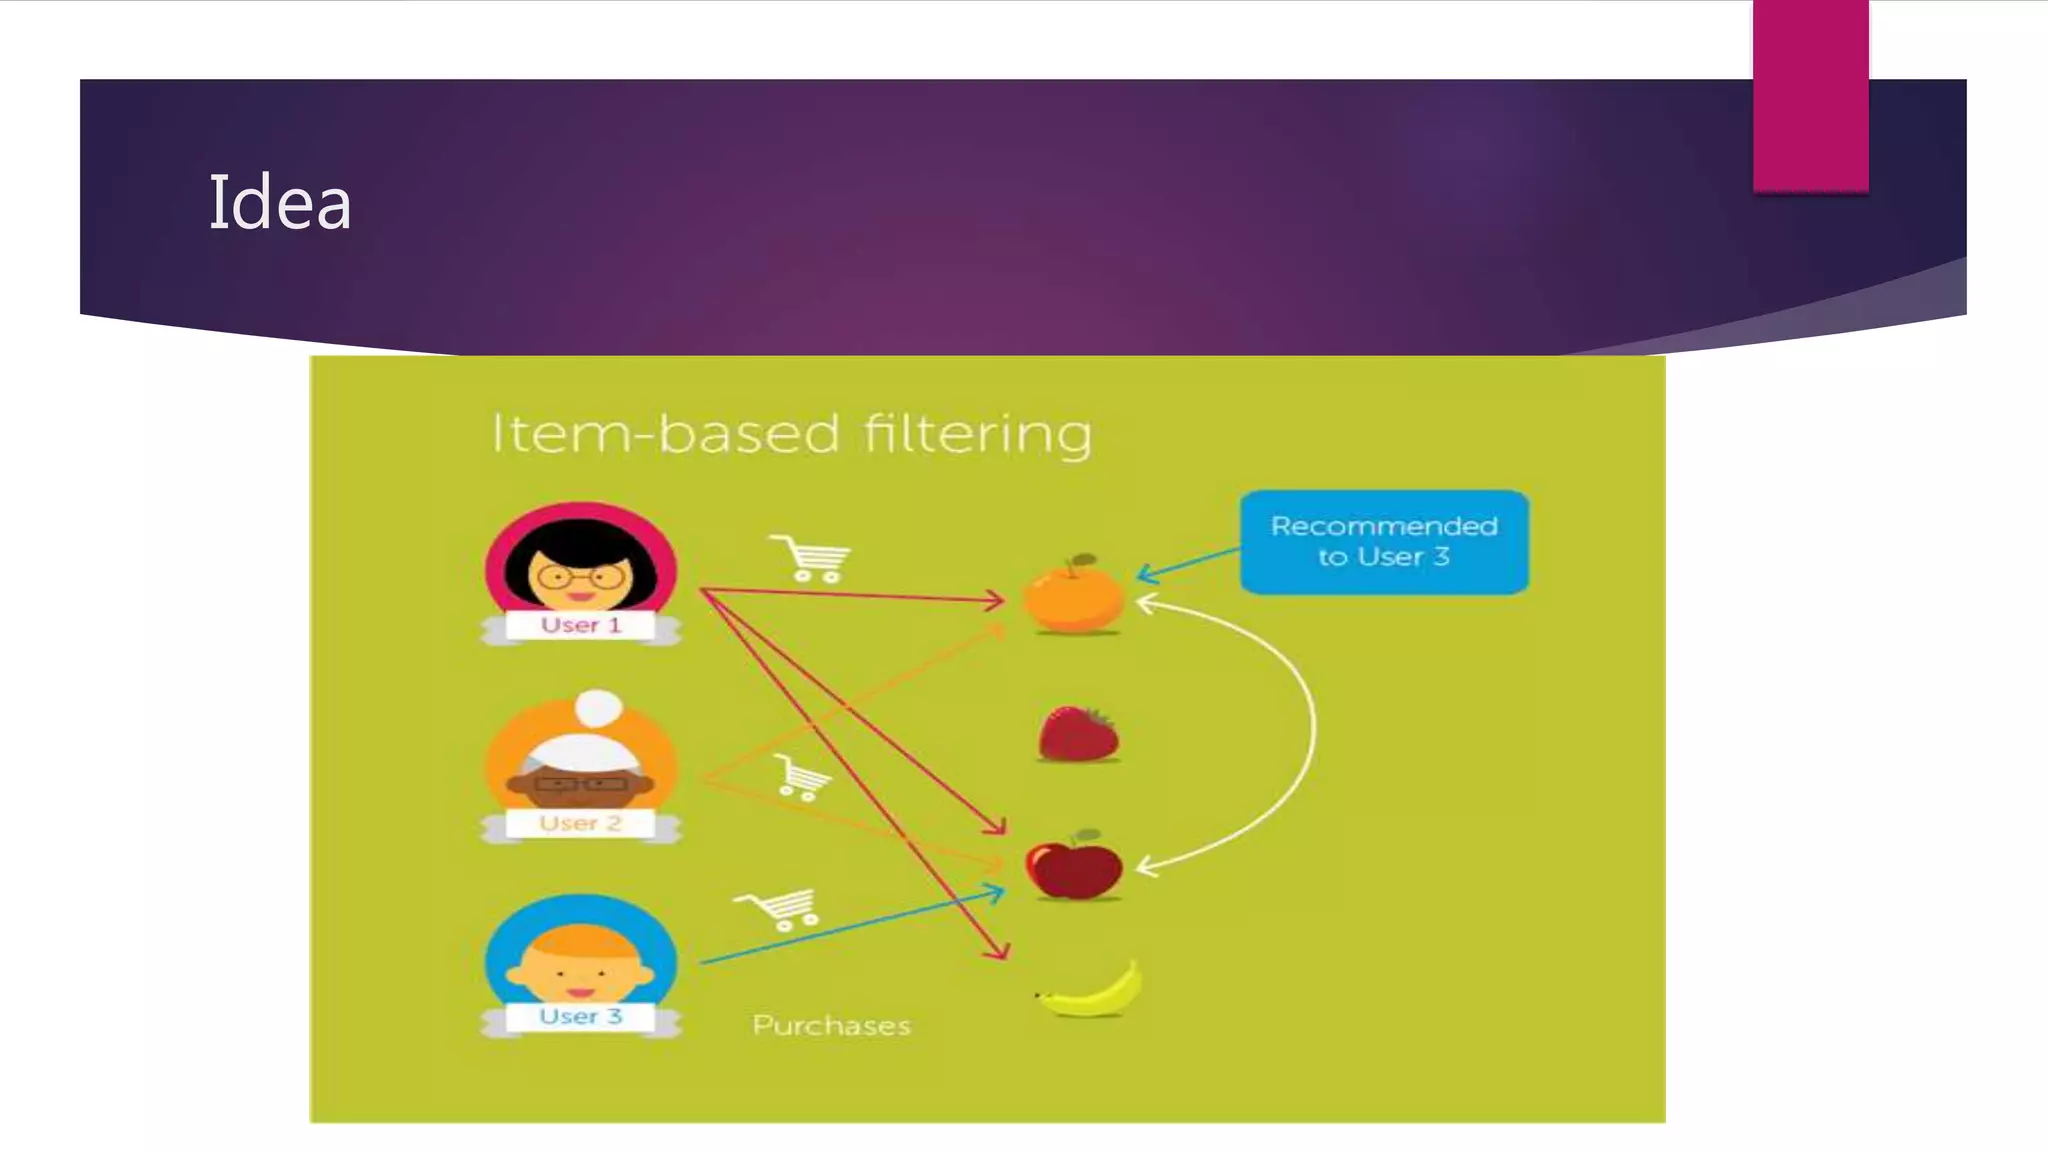
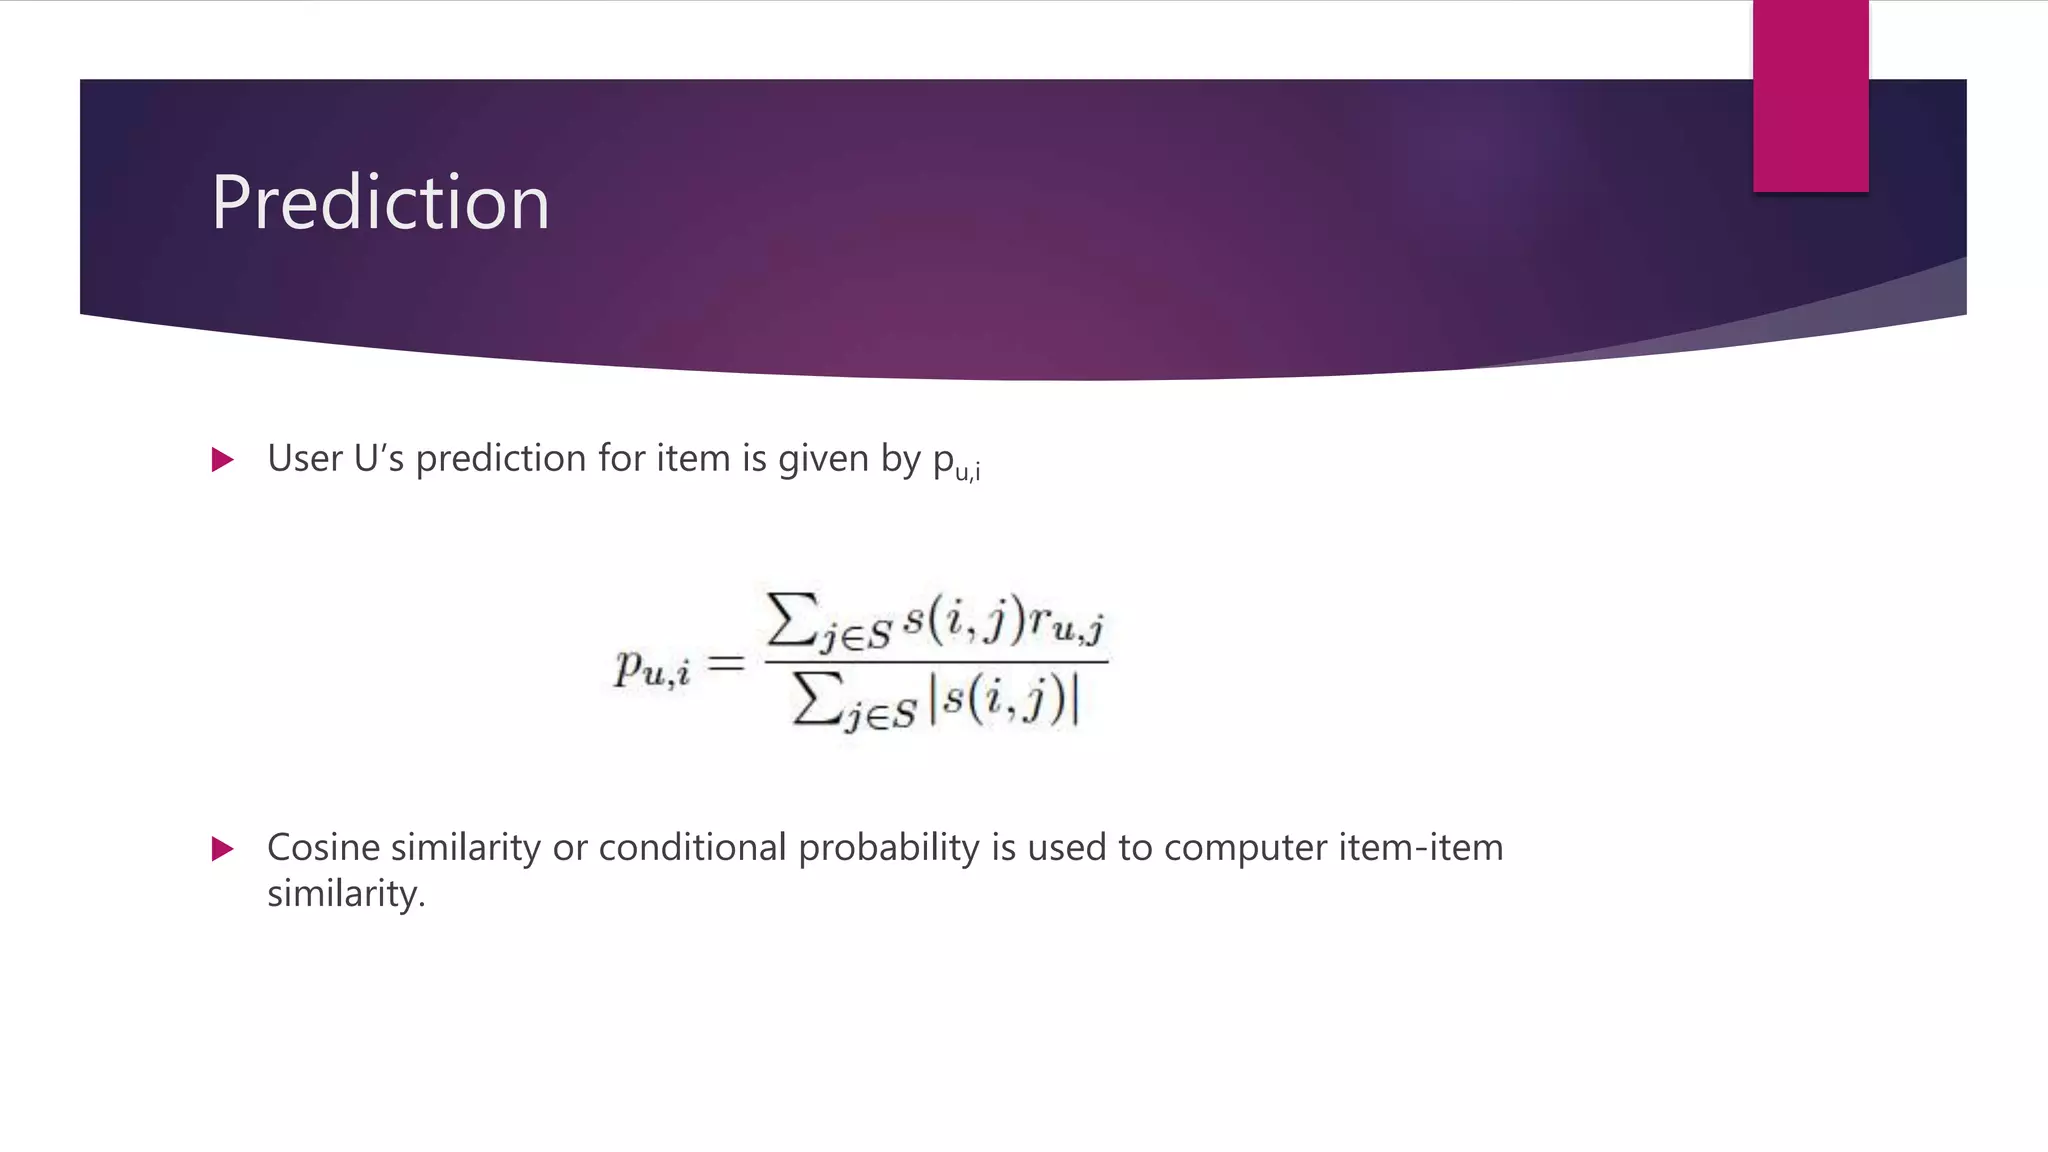
Overview of user-user and item-item collaborative filtering methods and their predictive mechanics.
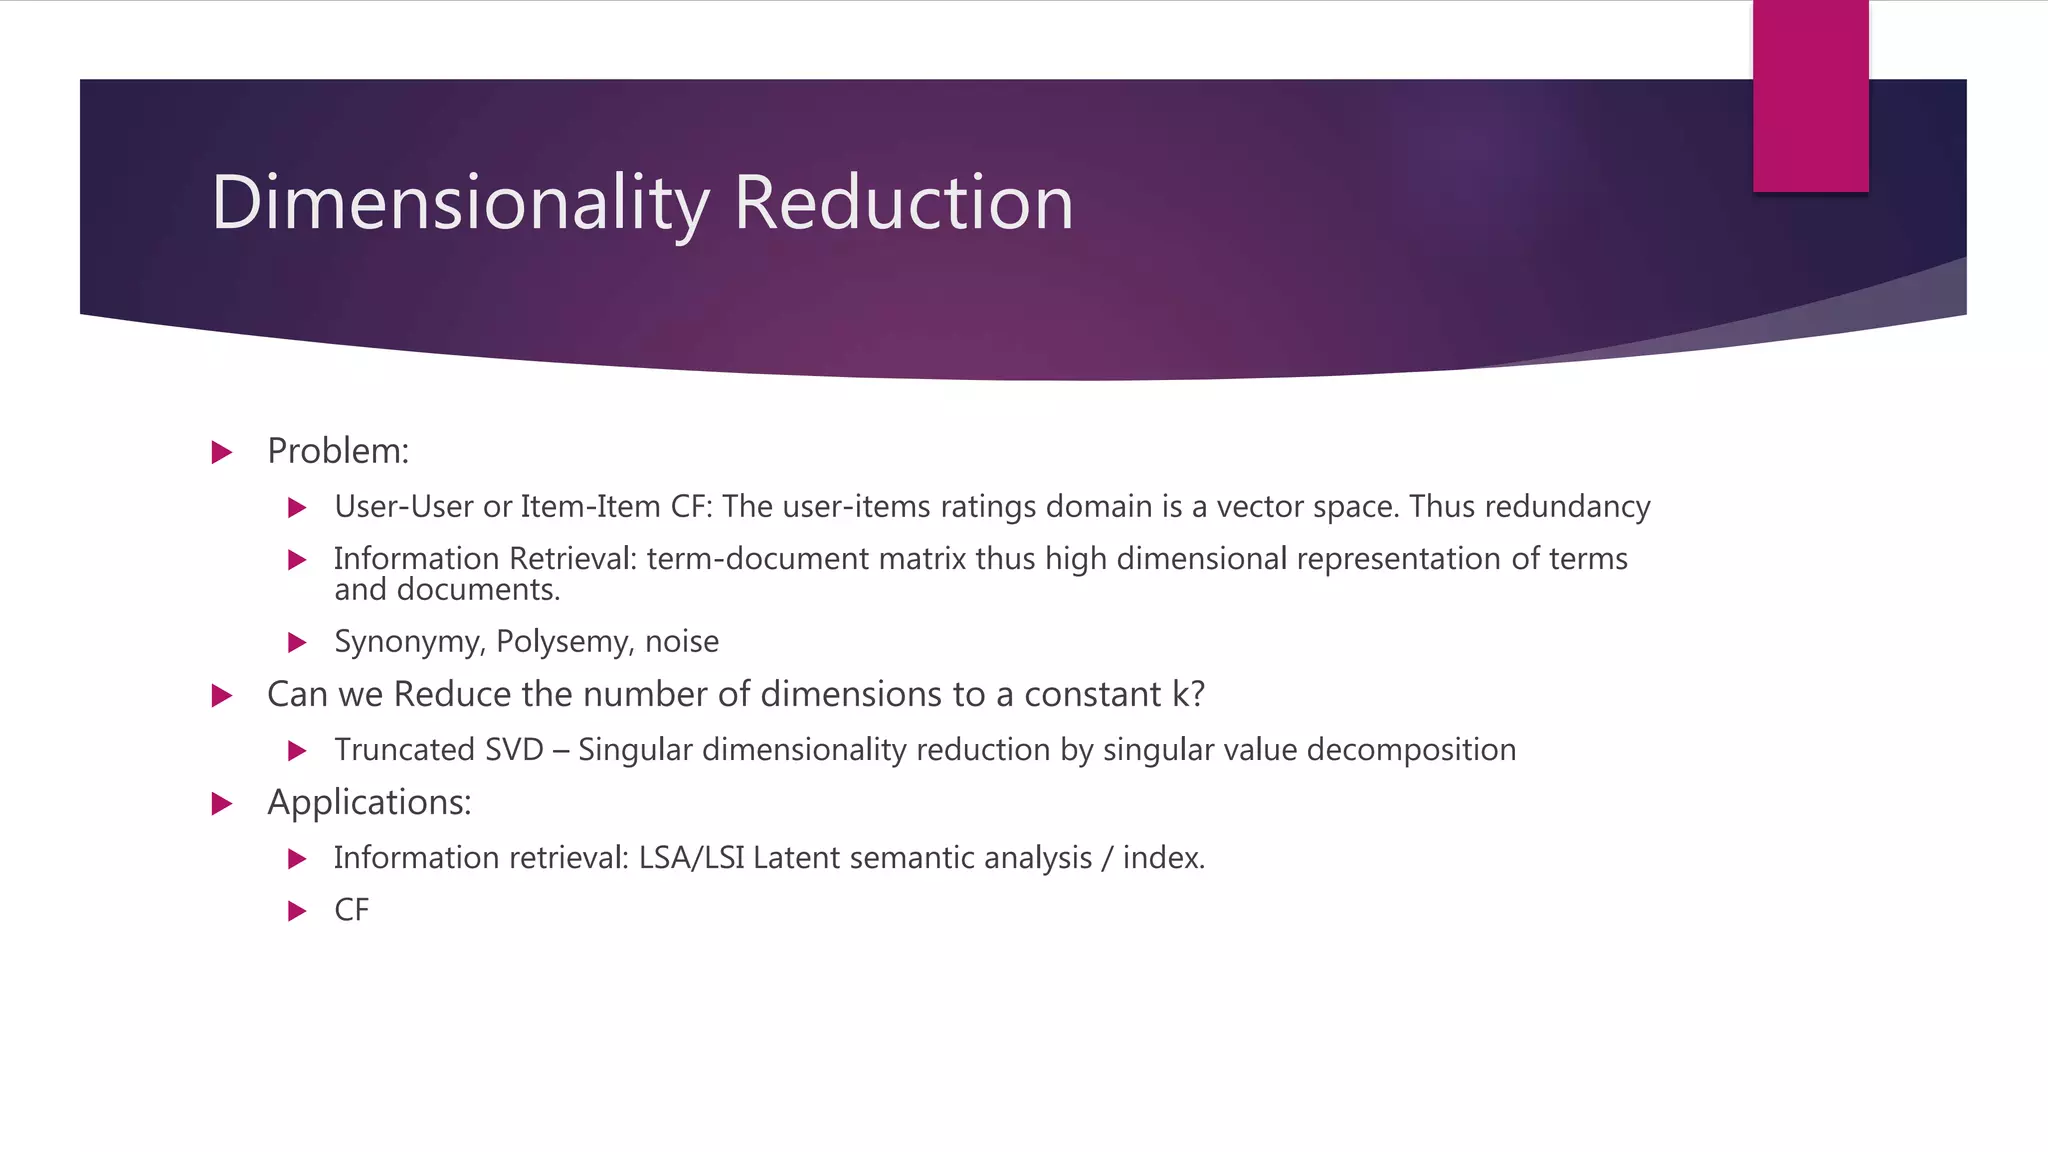
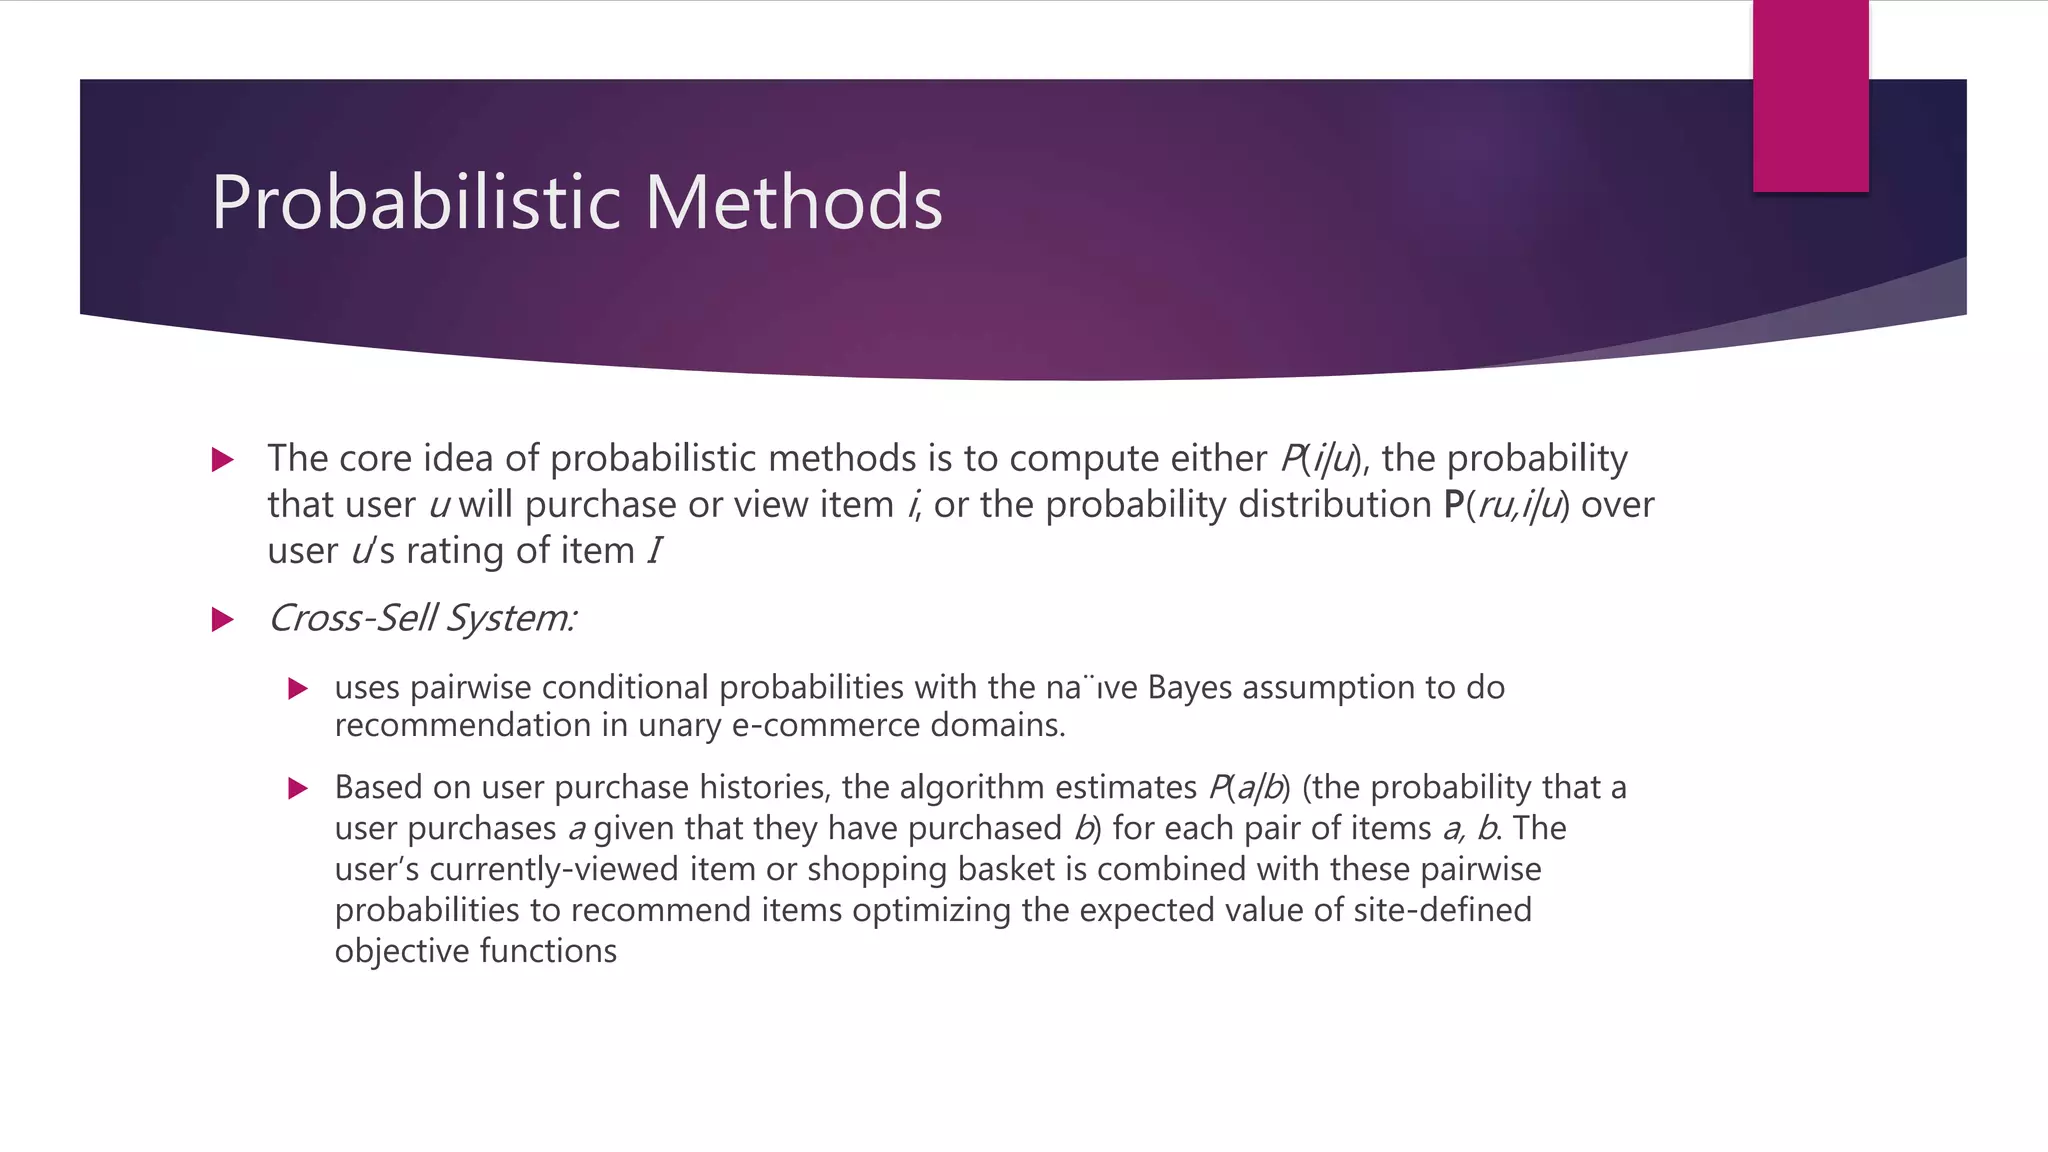
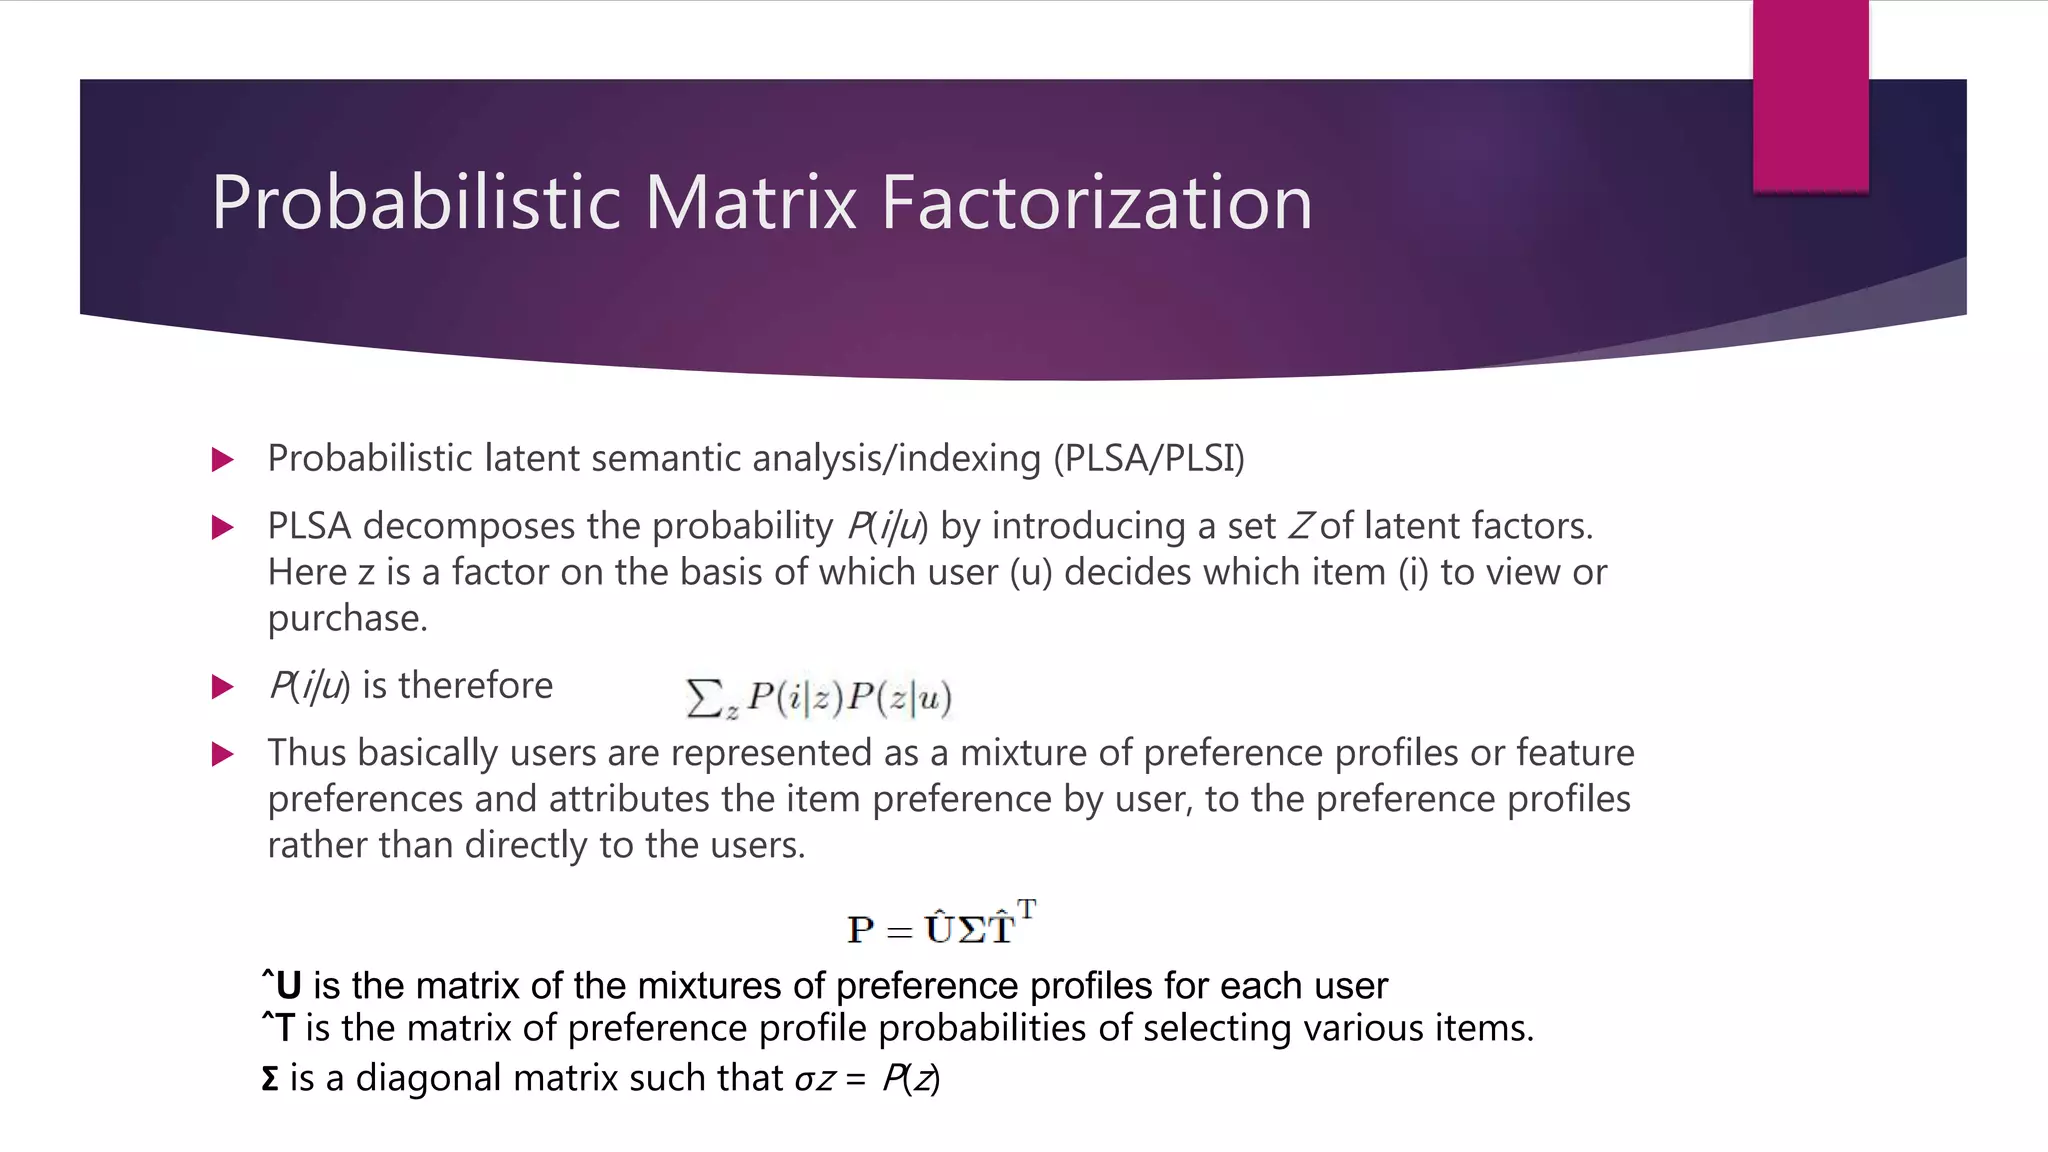
Introduction to dimensionality reduction and probabilistic methods like PLSA in recommender systems.
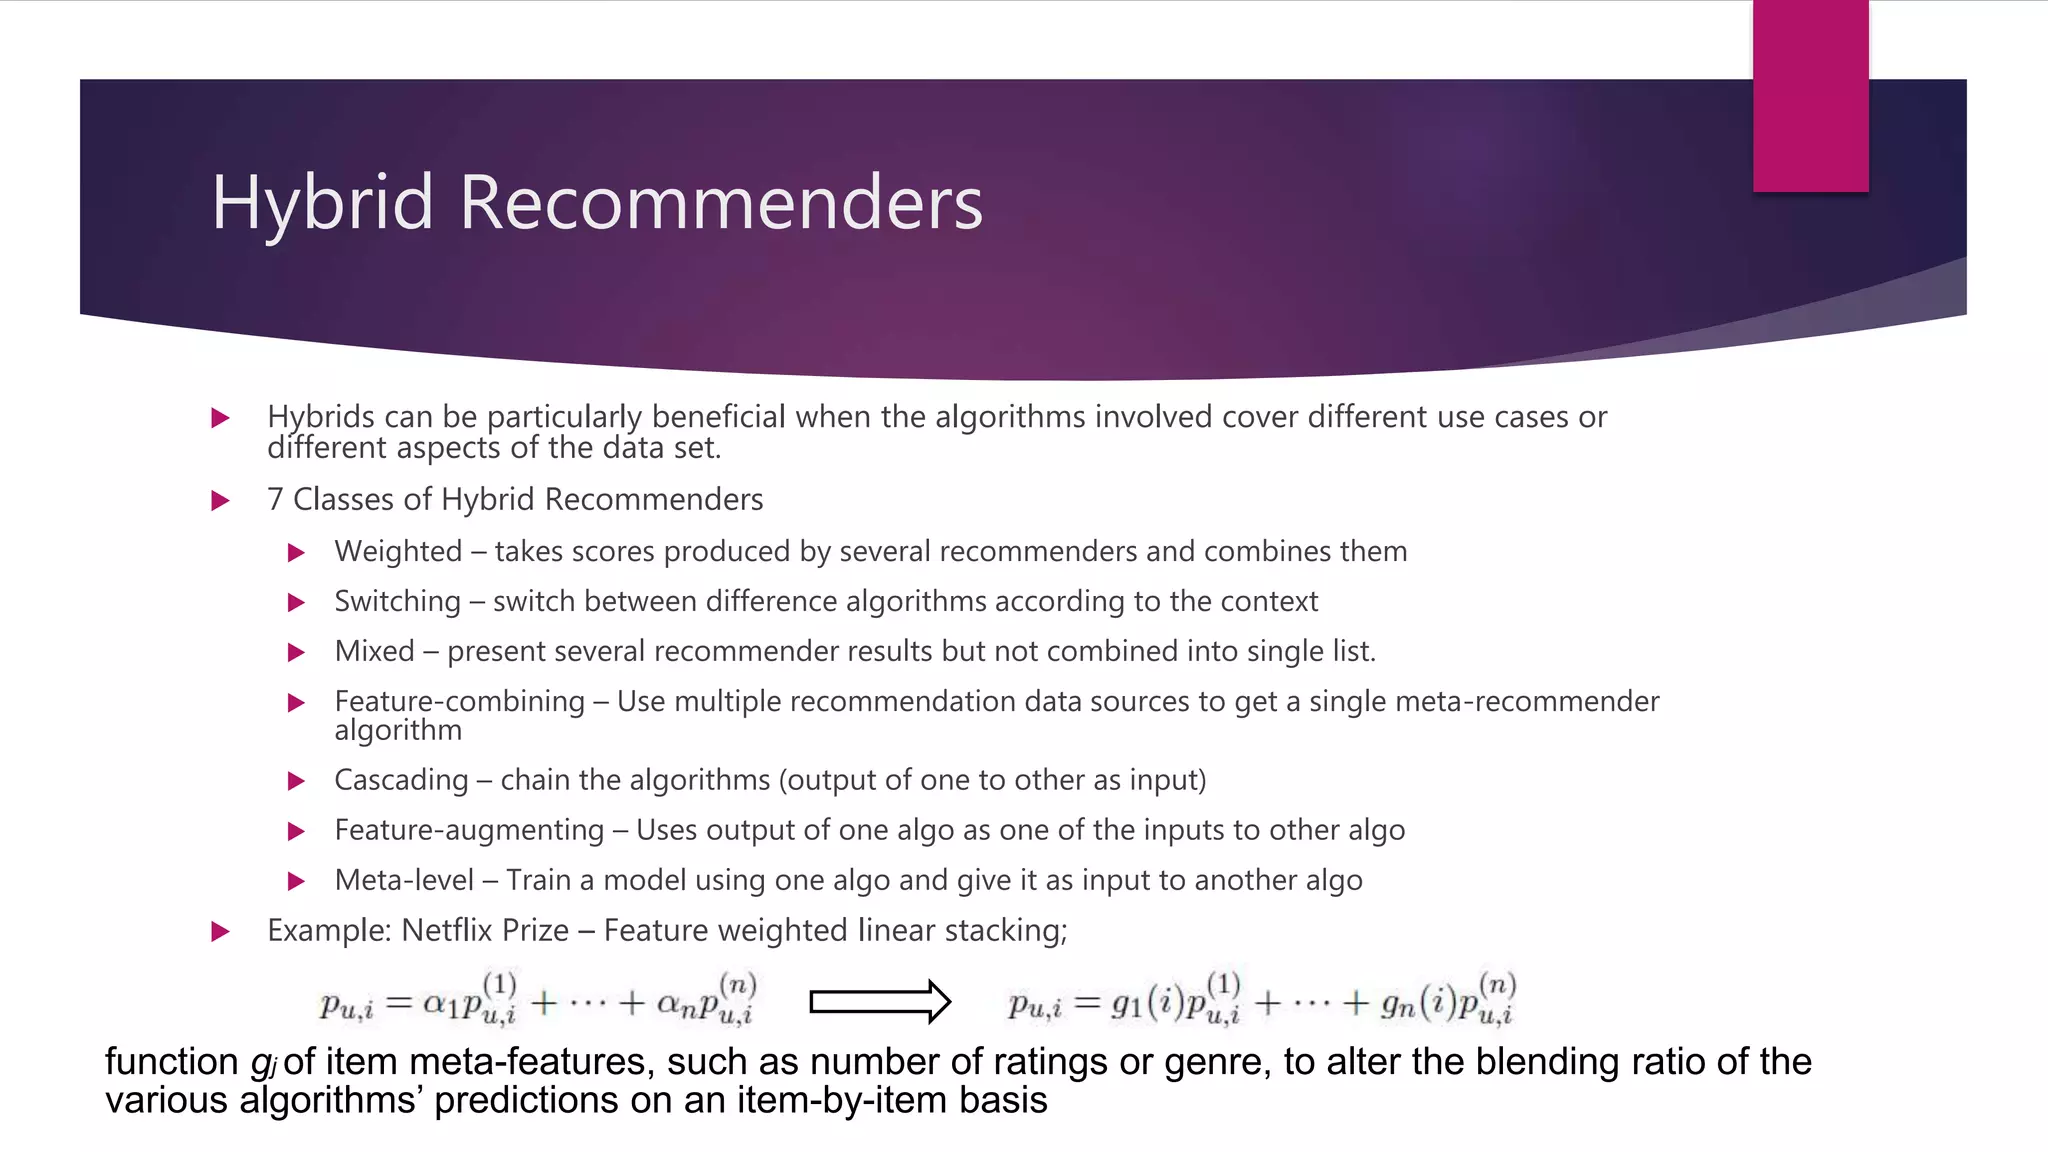
Explanation of hybrid recommenders combining various algorithms for optimal performance.
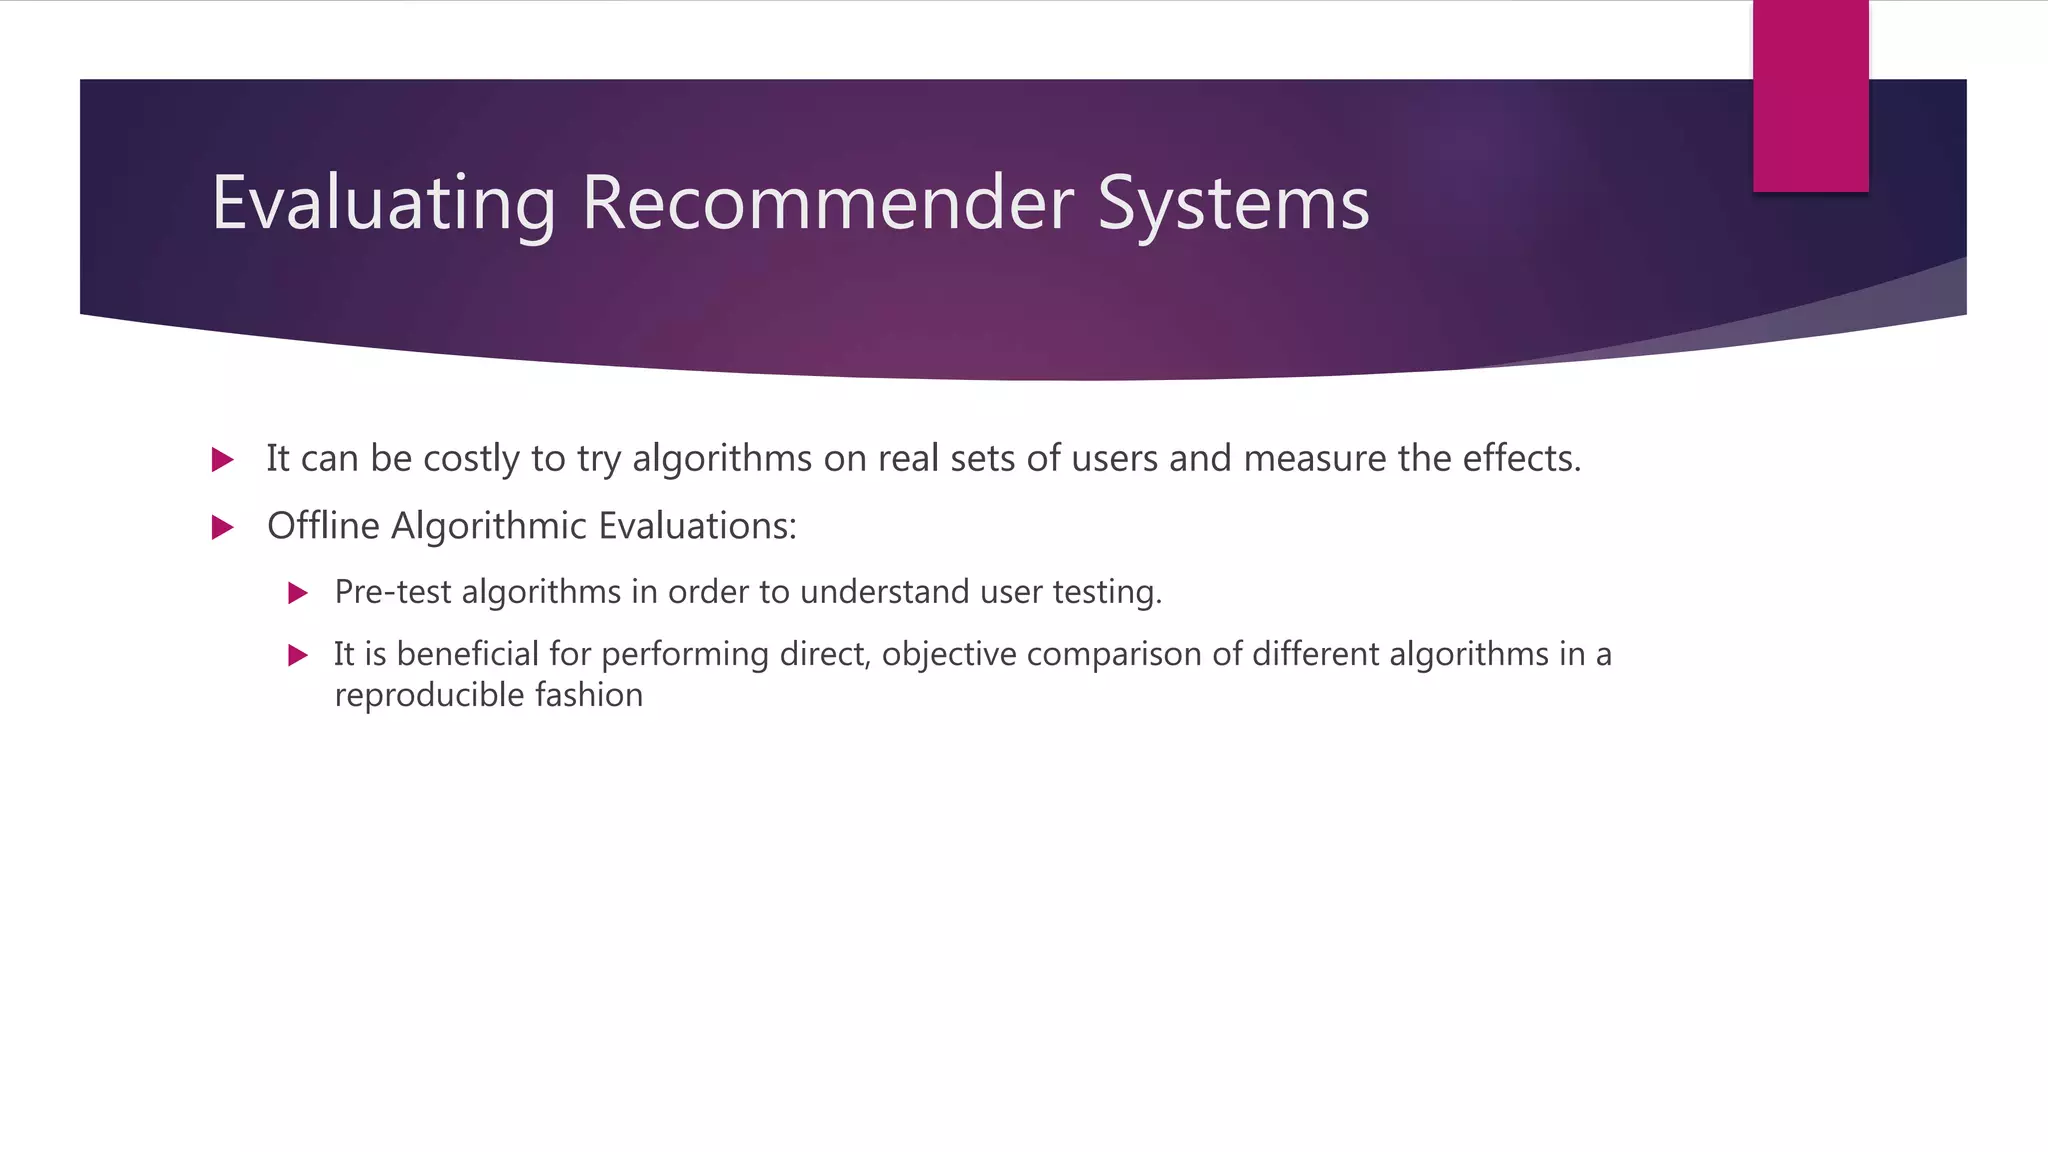
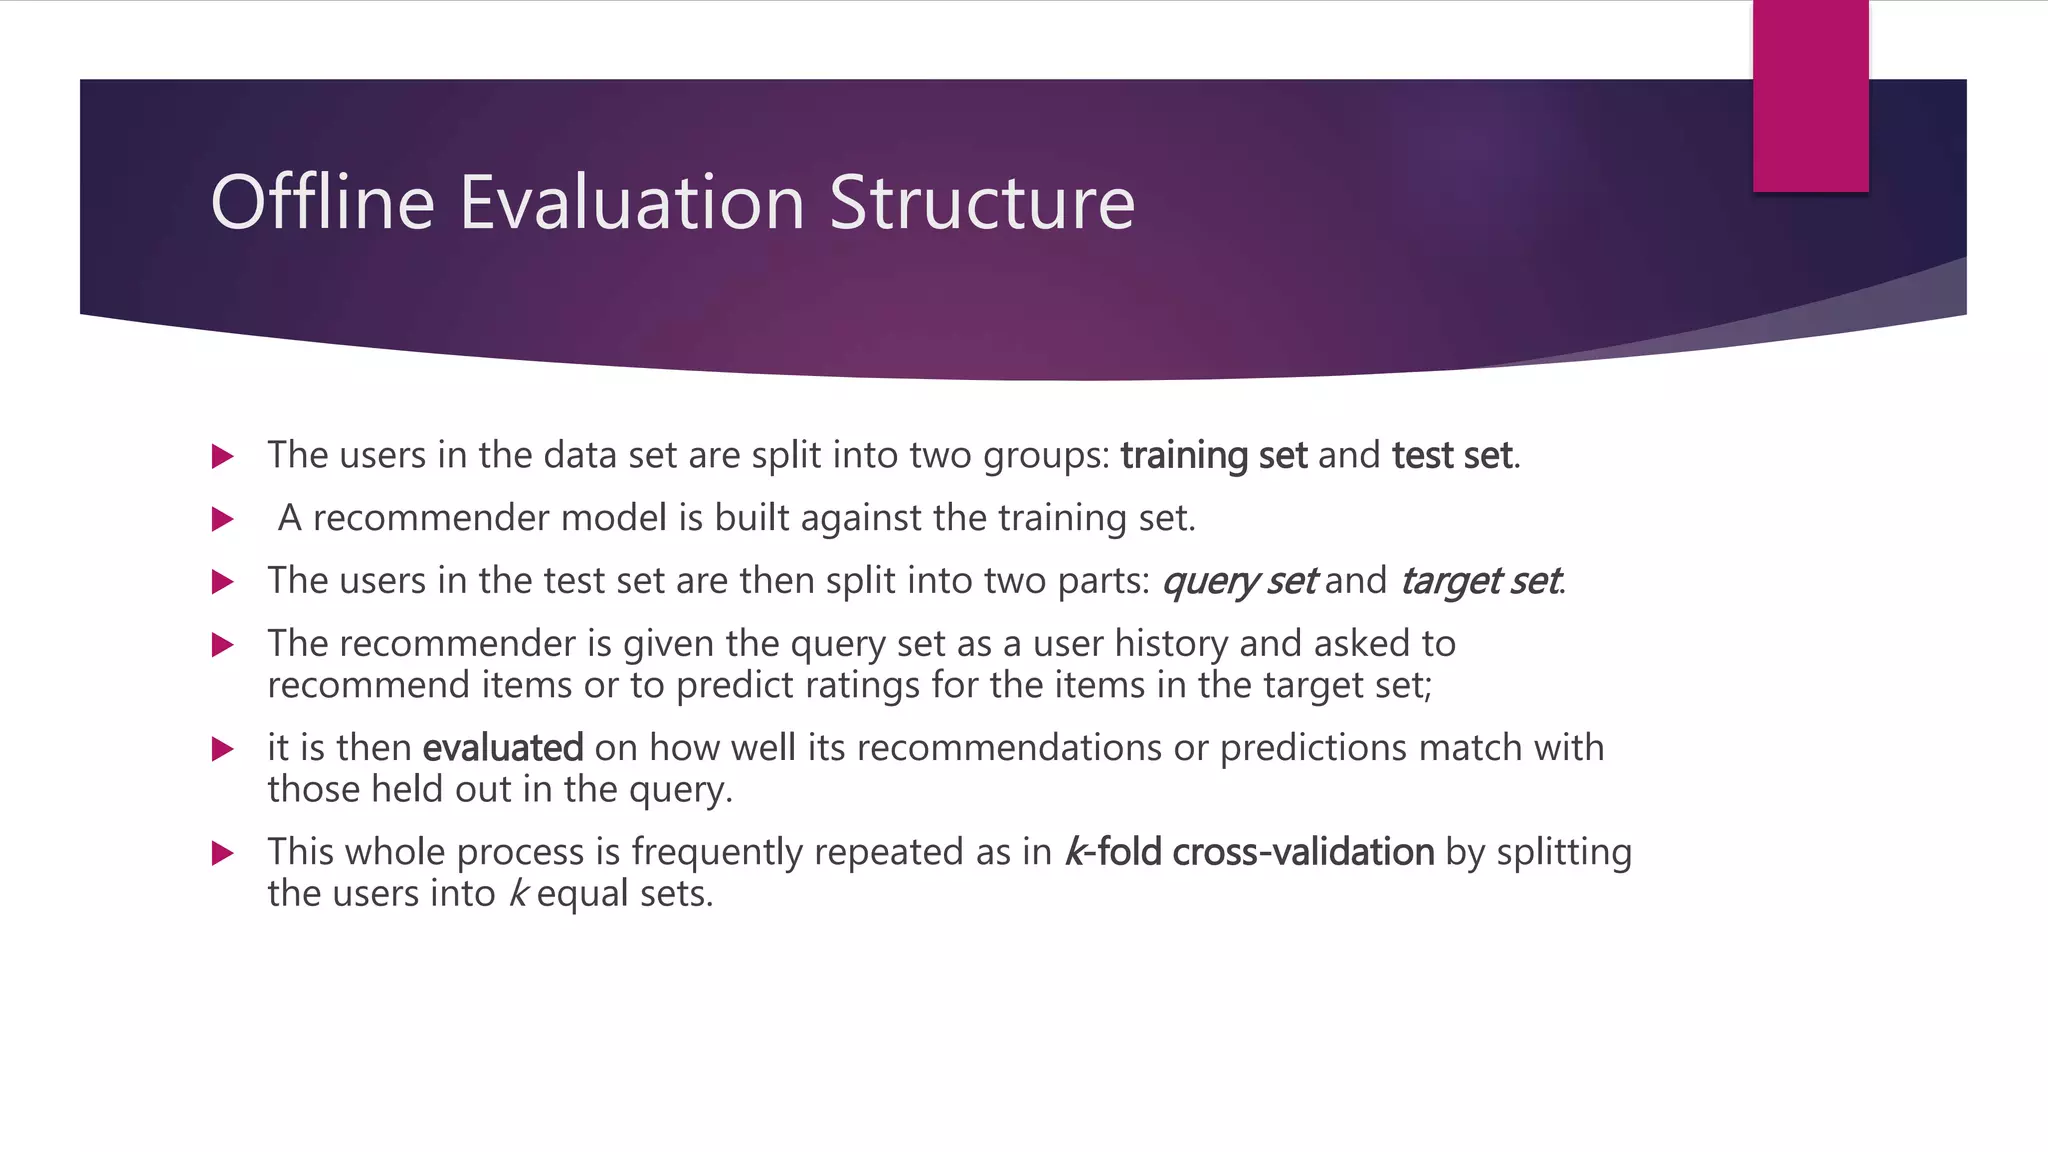
Evaluation methods for recommender systems, including offline evaluations and metrics like MAE and RMSE. Methods to measure prediction accuracy and decision metrics to enhance user relevance.
Significance of online user testing and trials in evaluating recommender systems against real-world data.
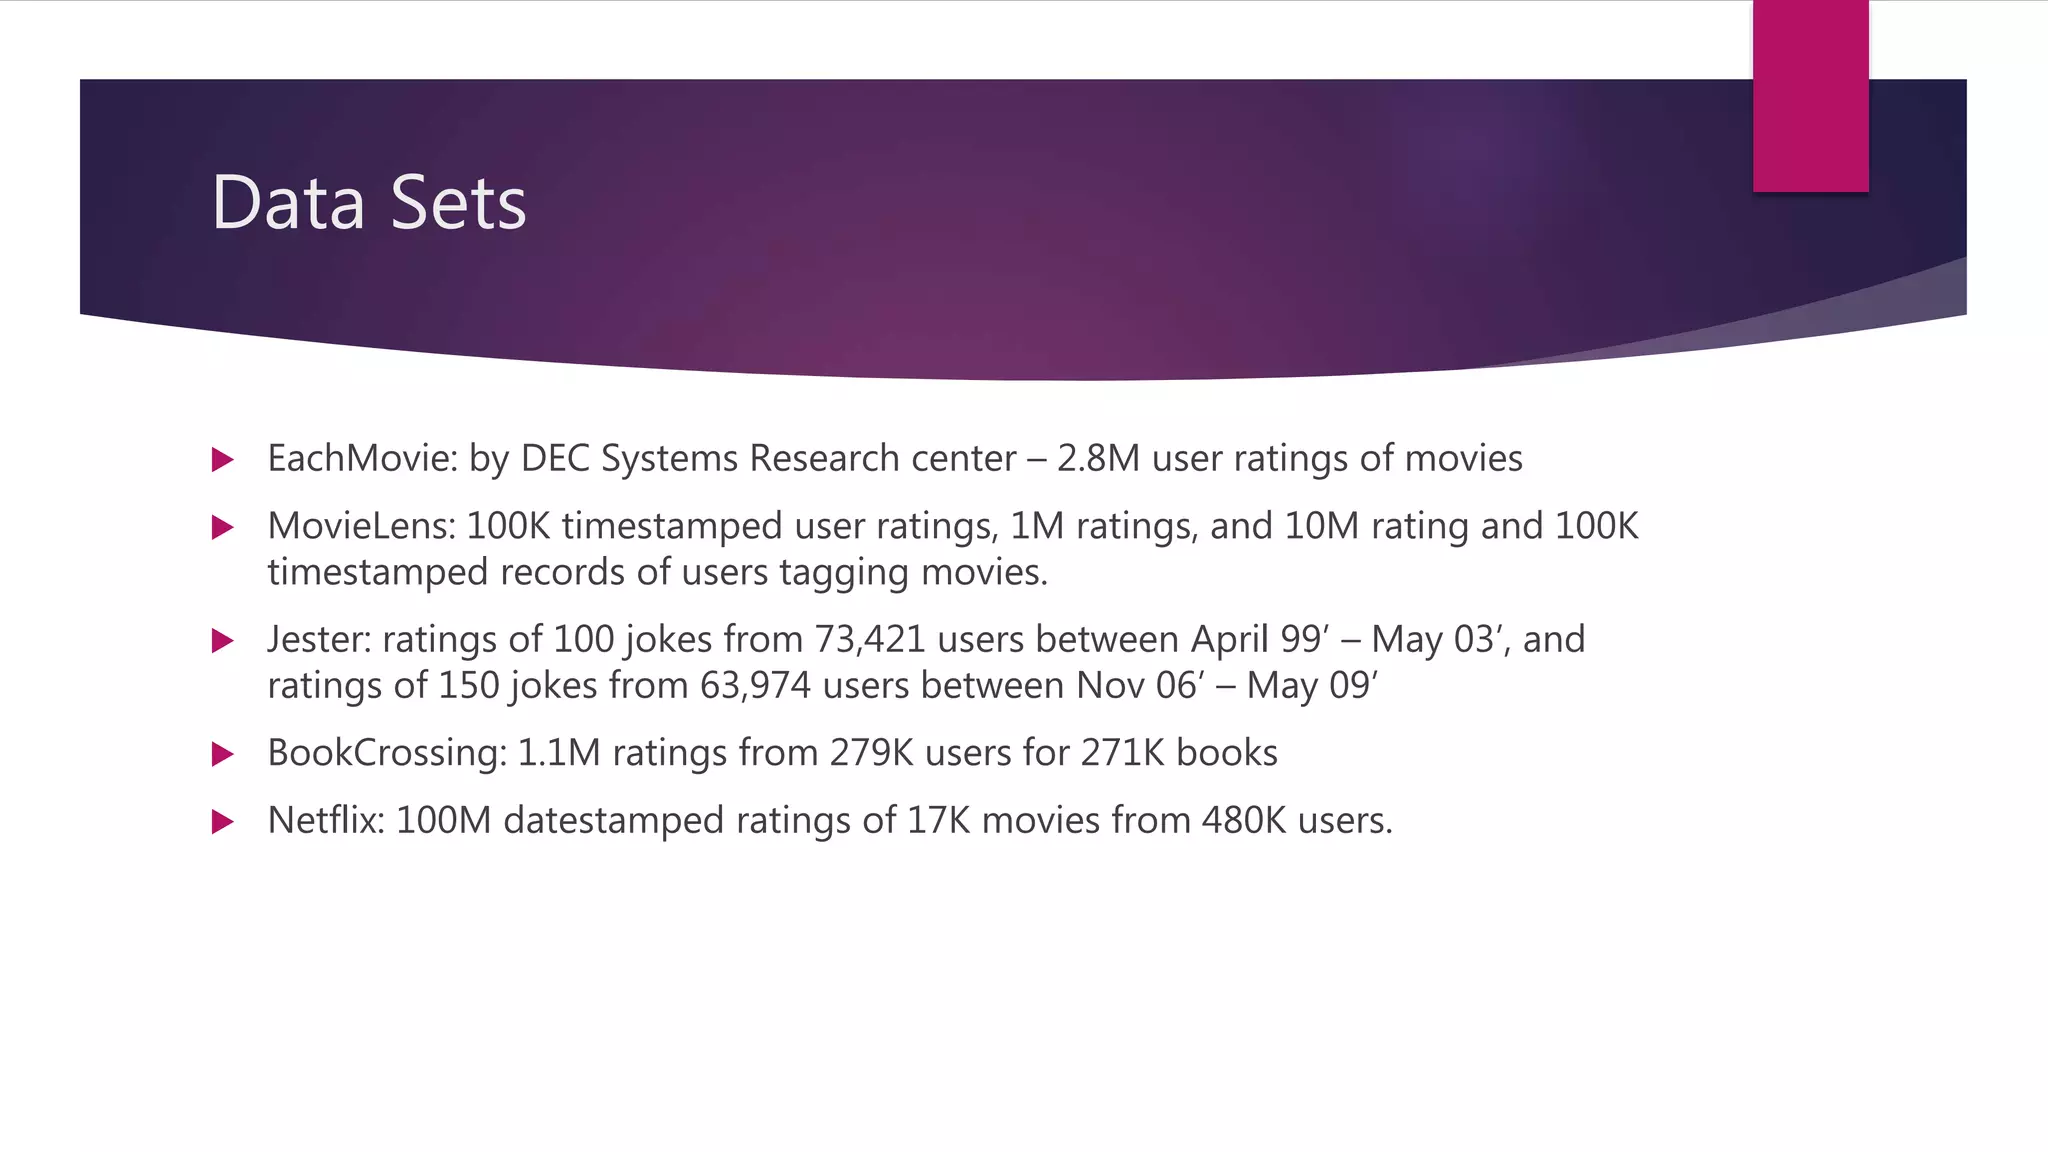
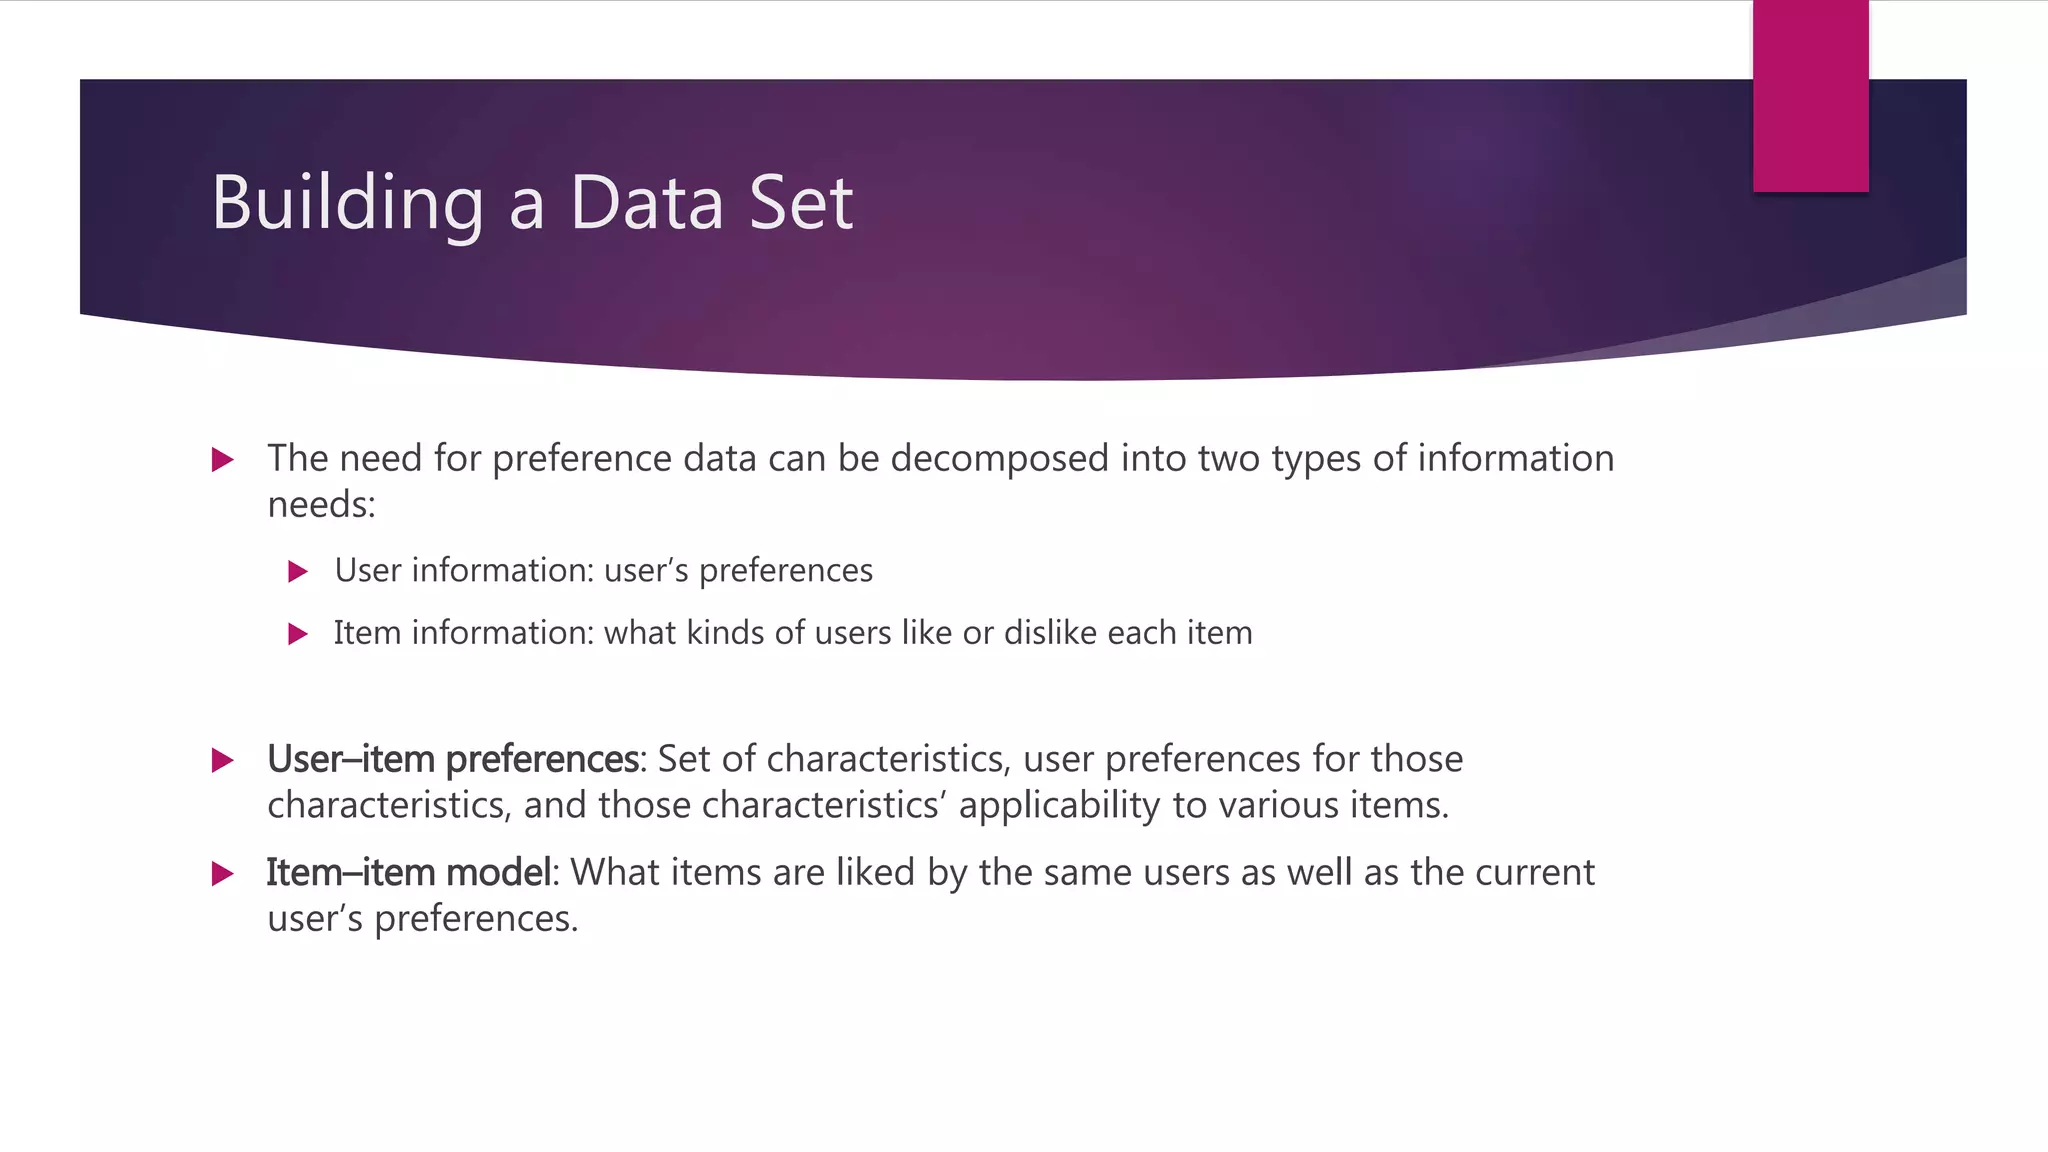
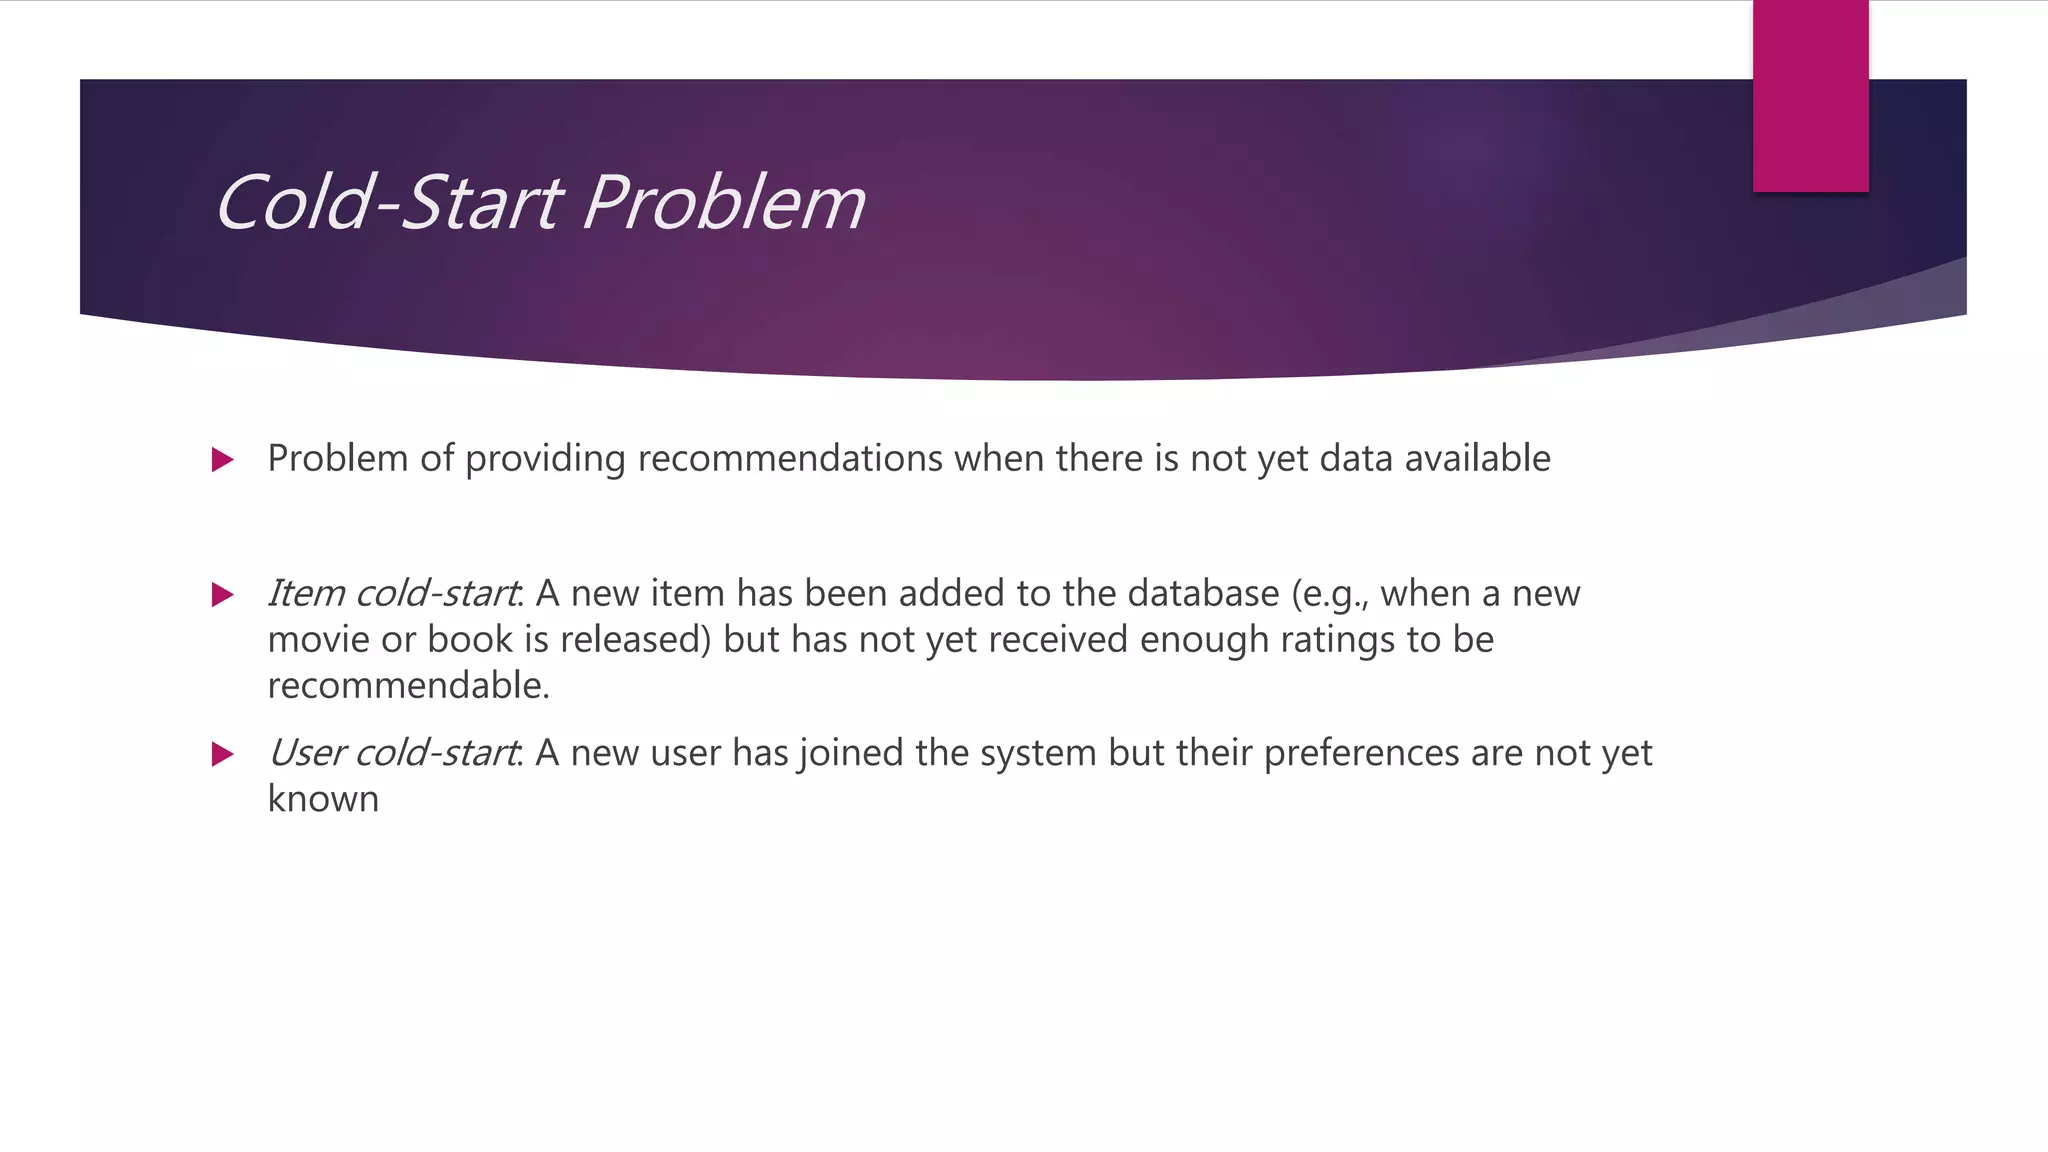
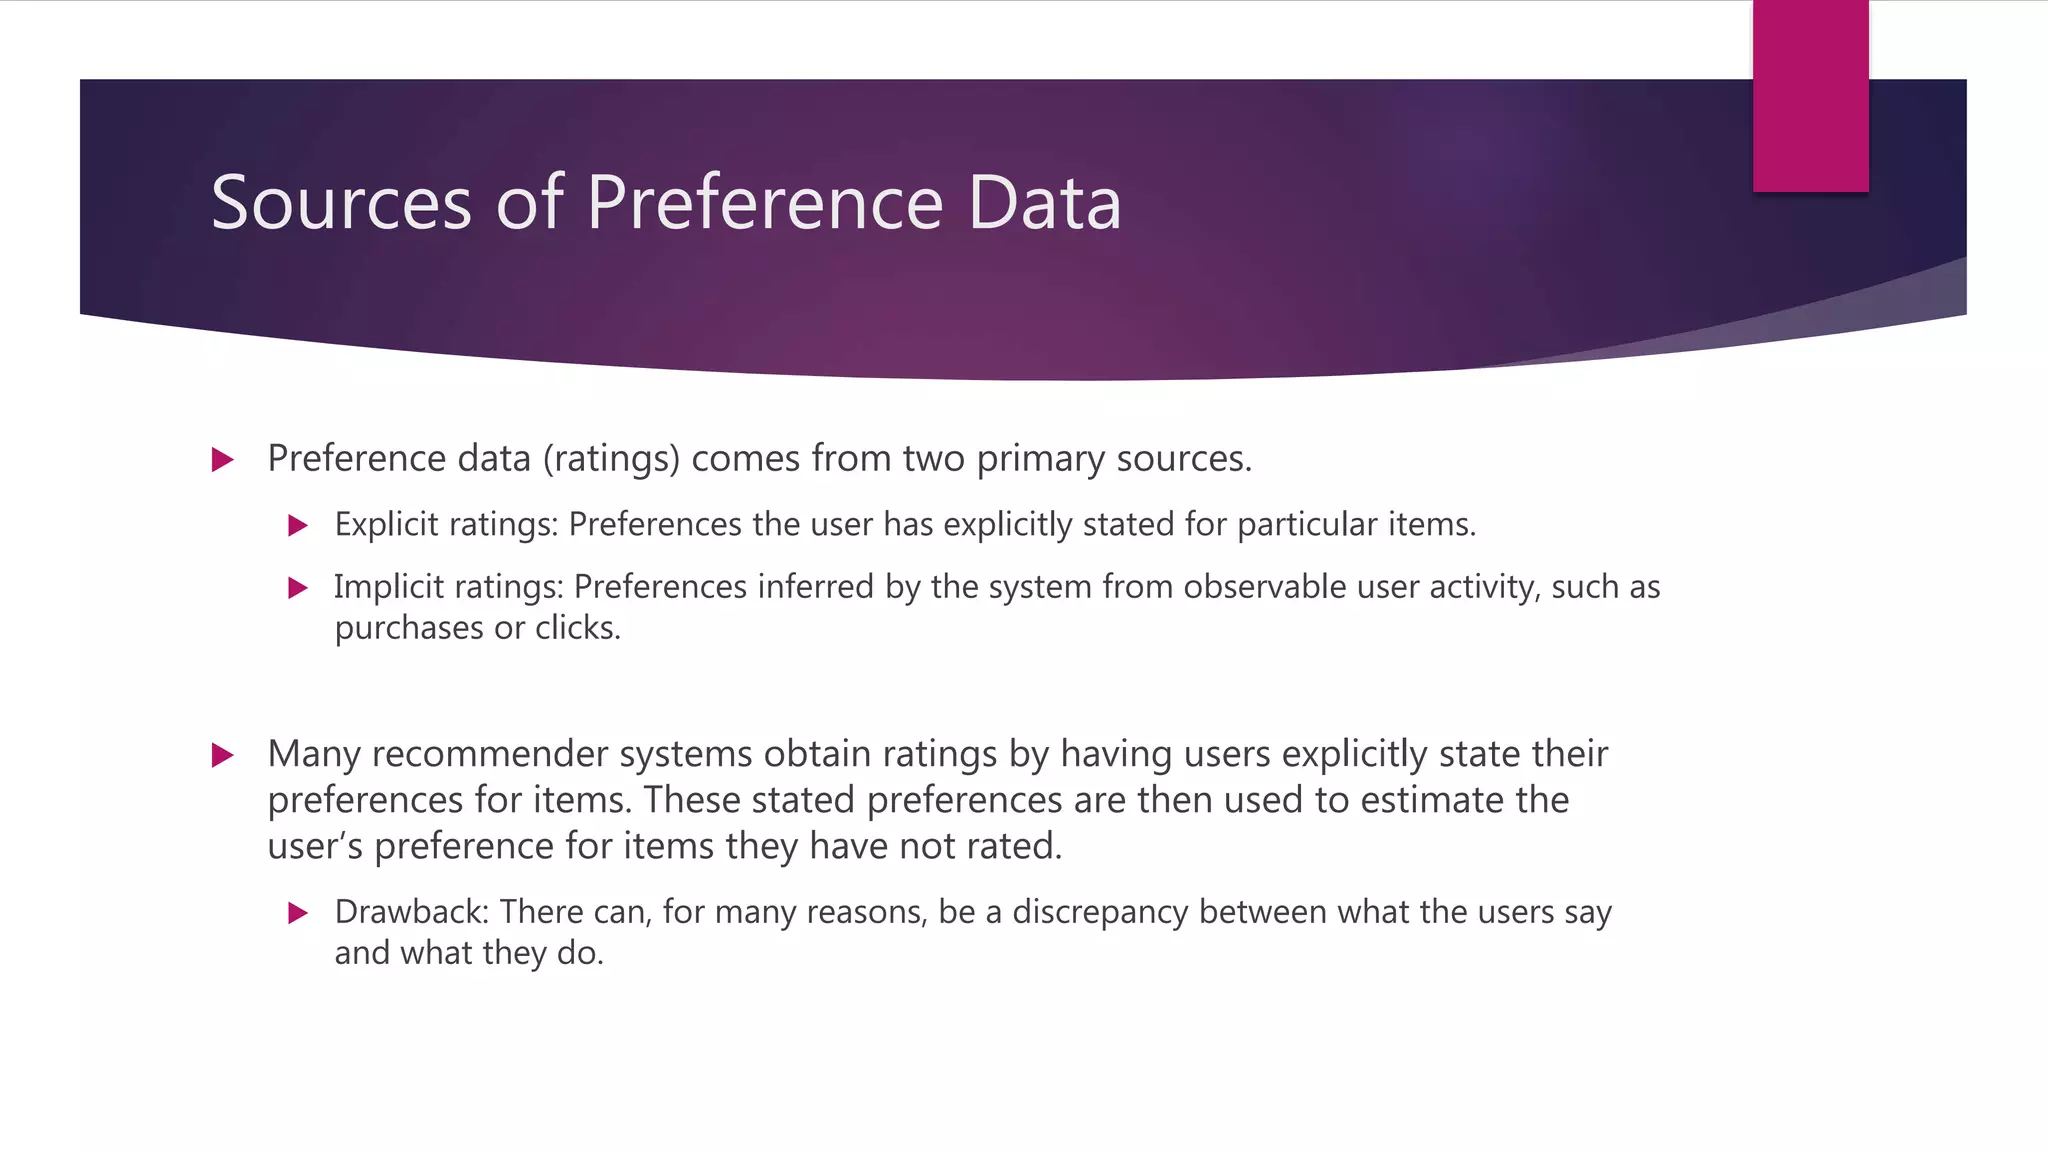
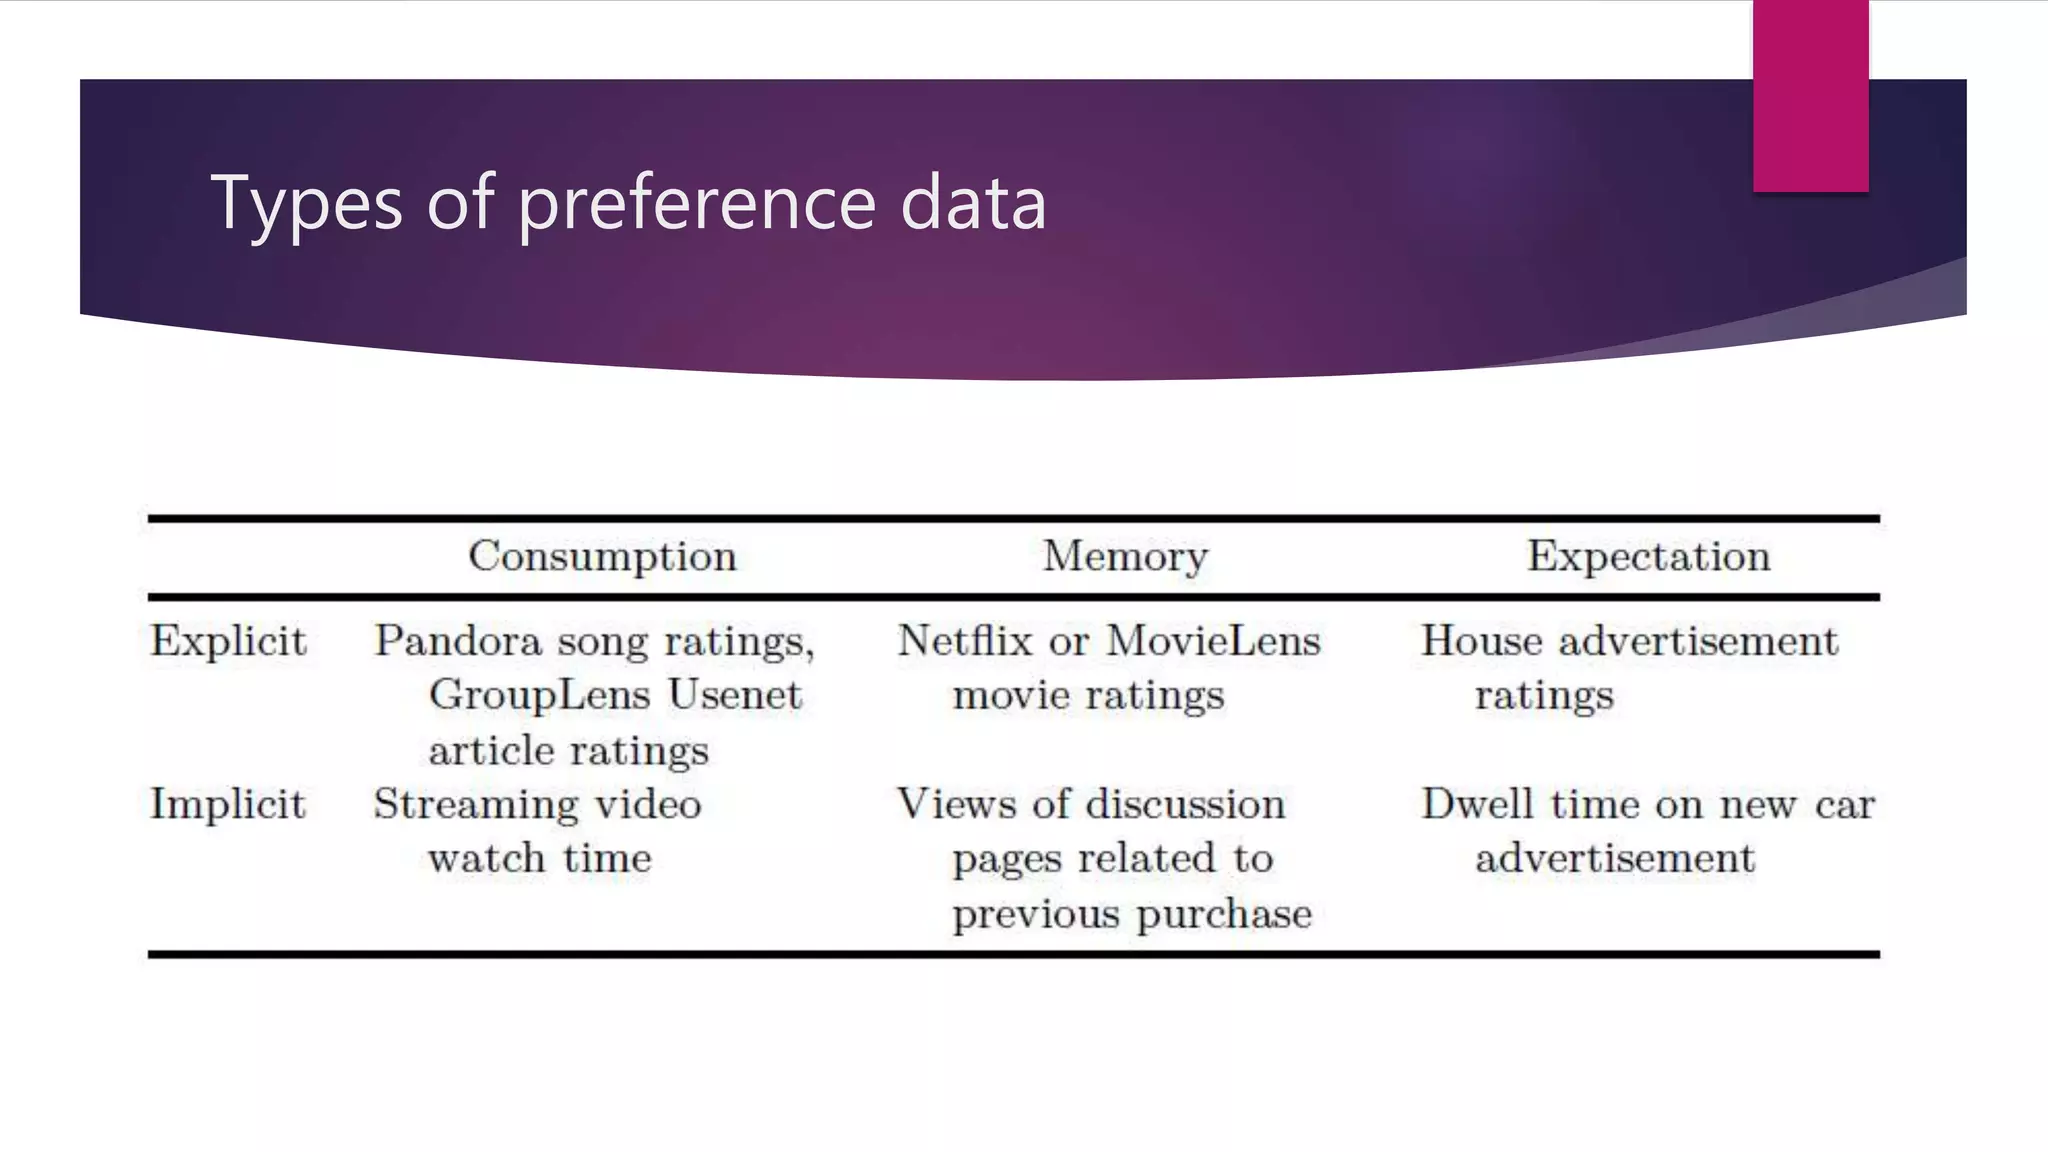
Challenges like the cold-start problem and sources of preference data for recommendations.
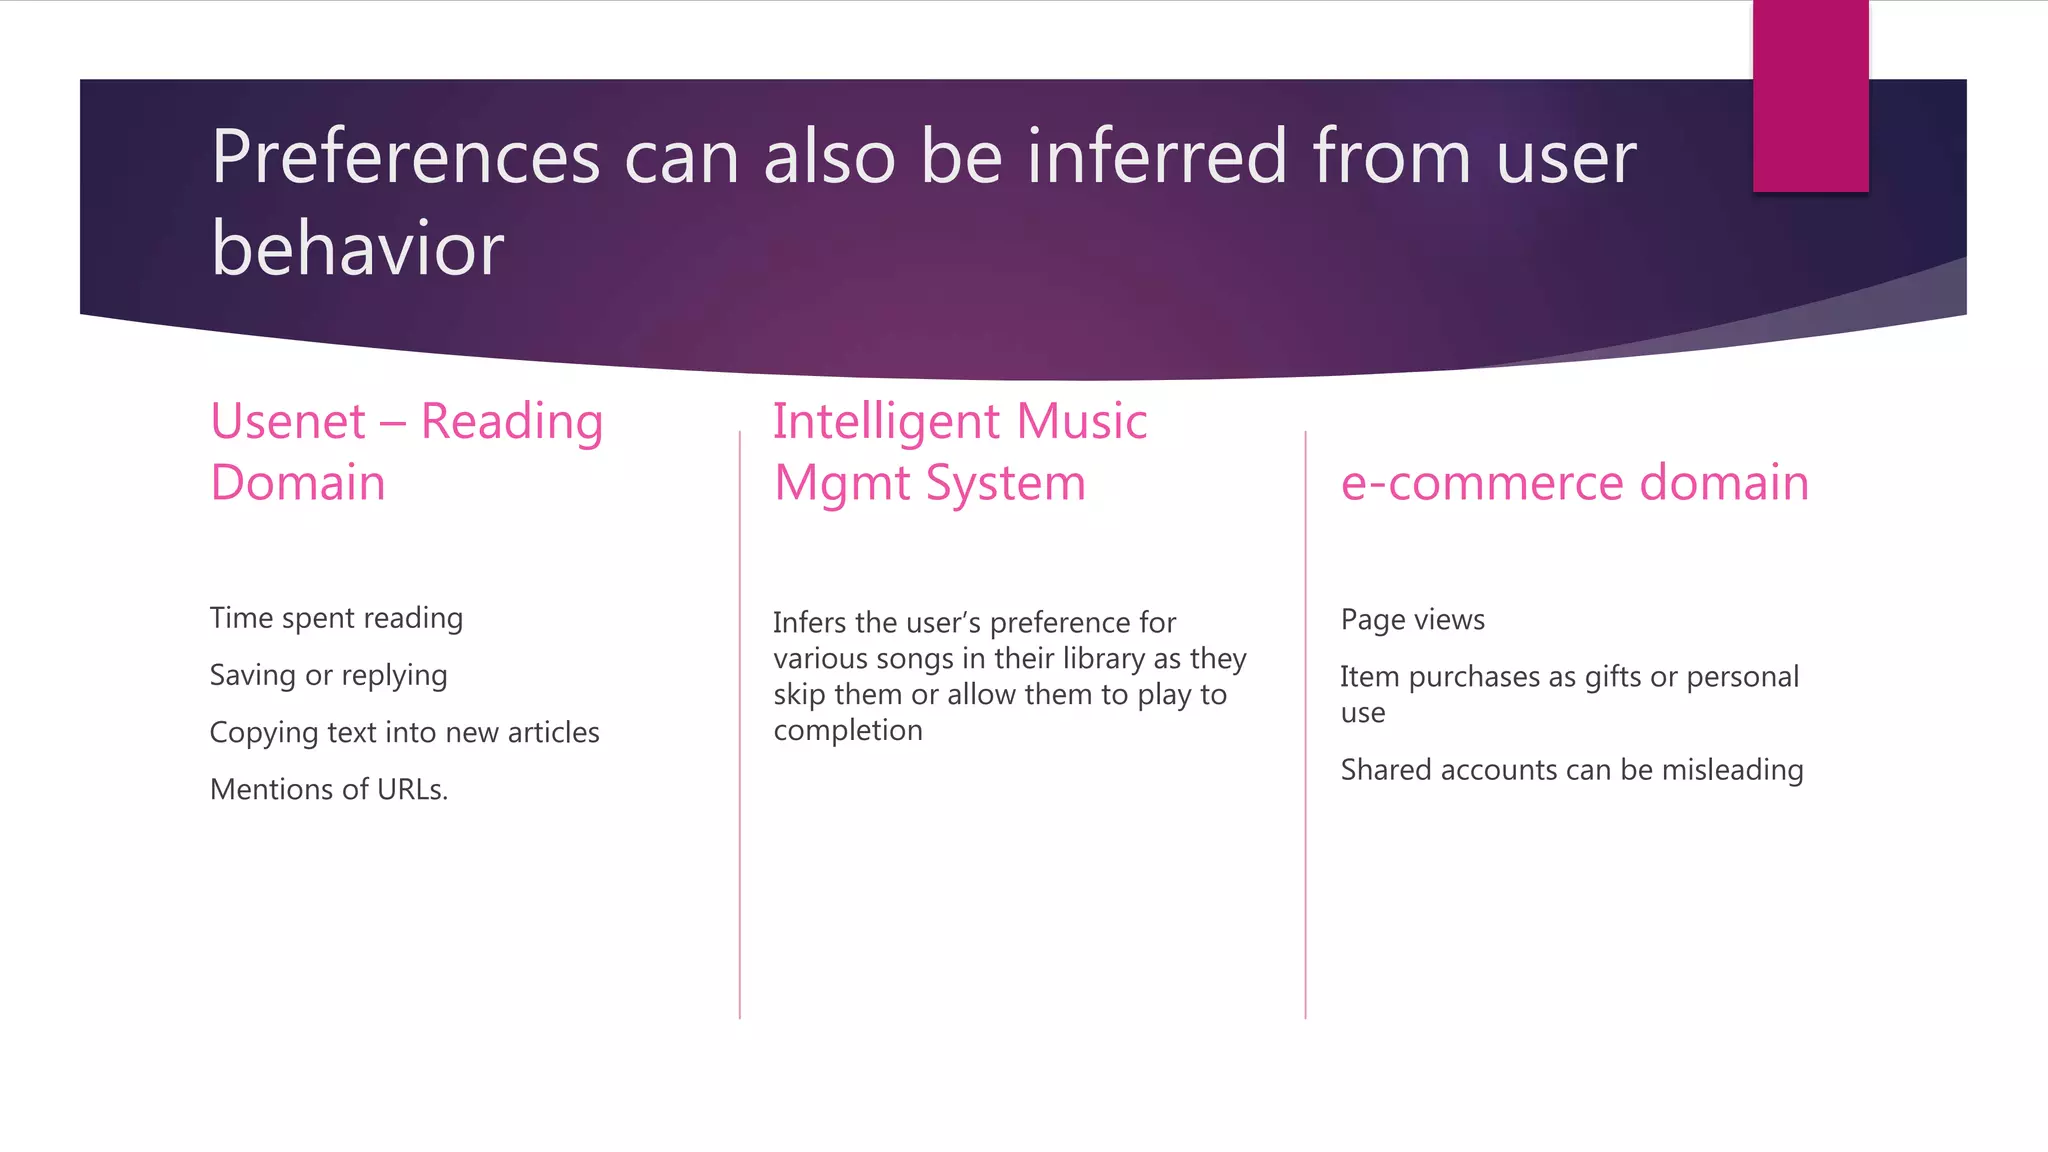
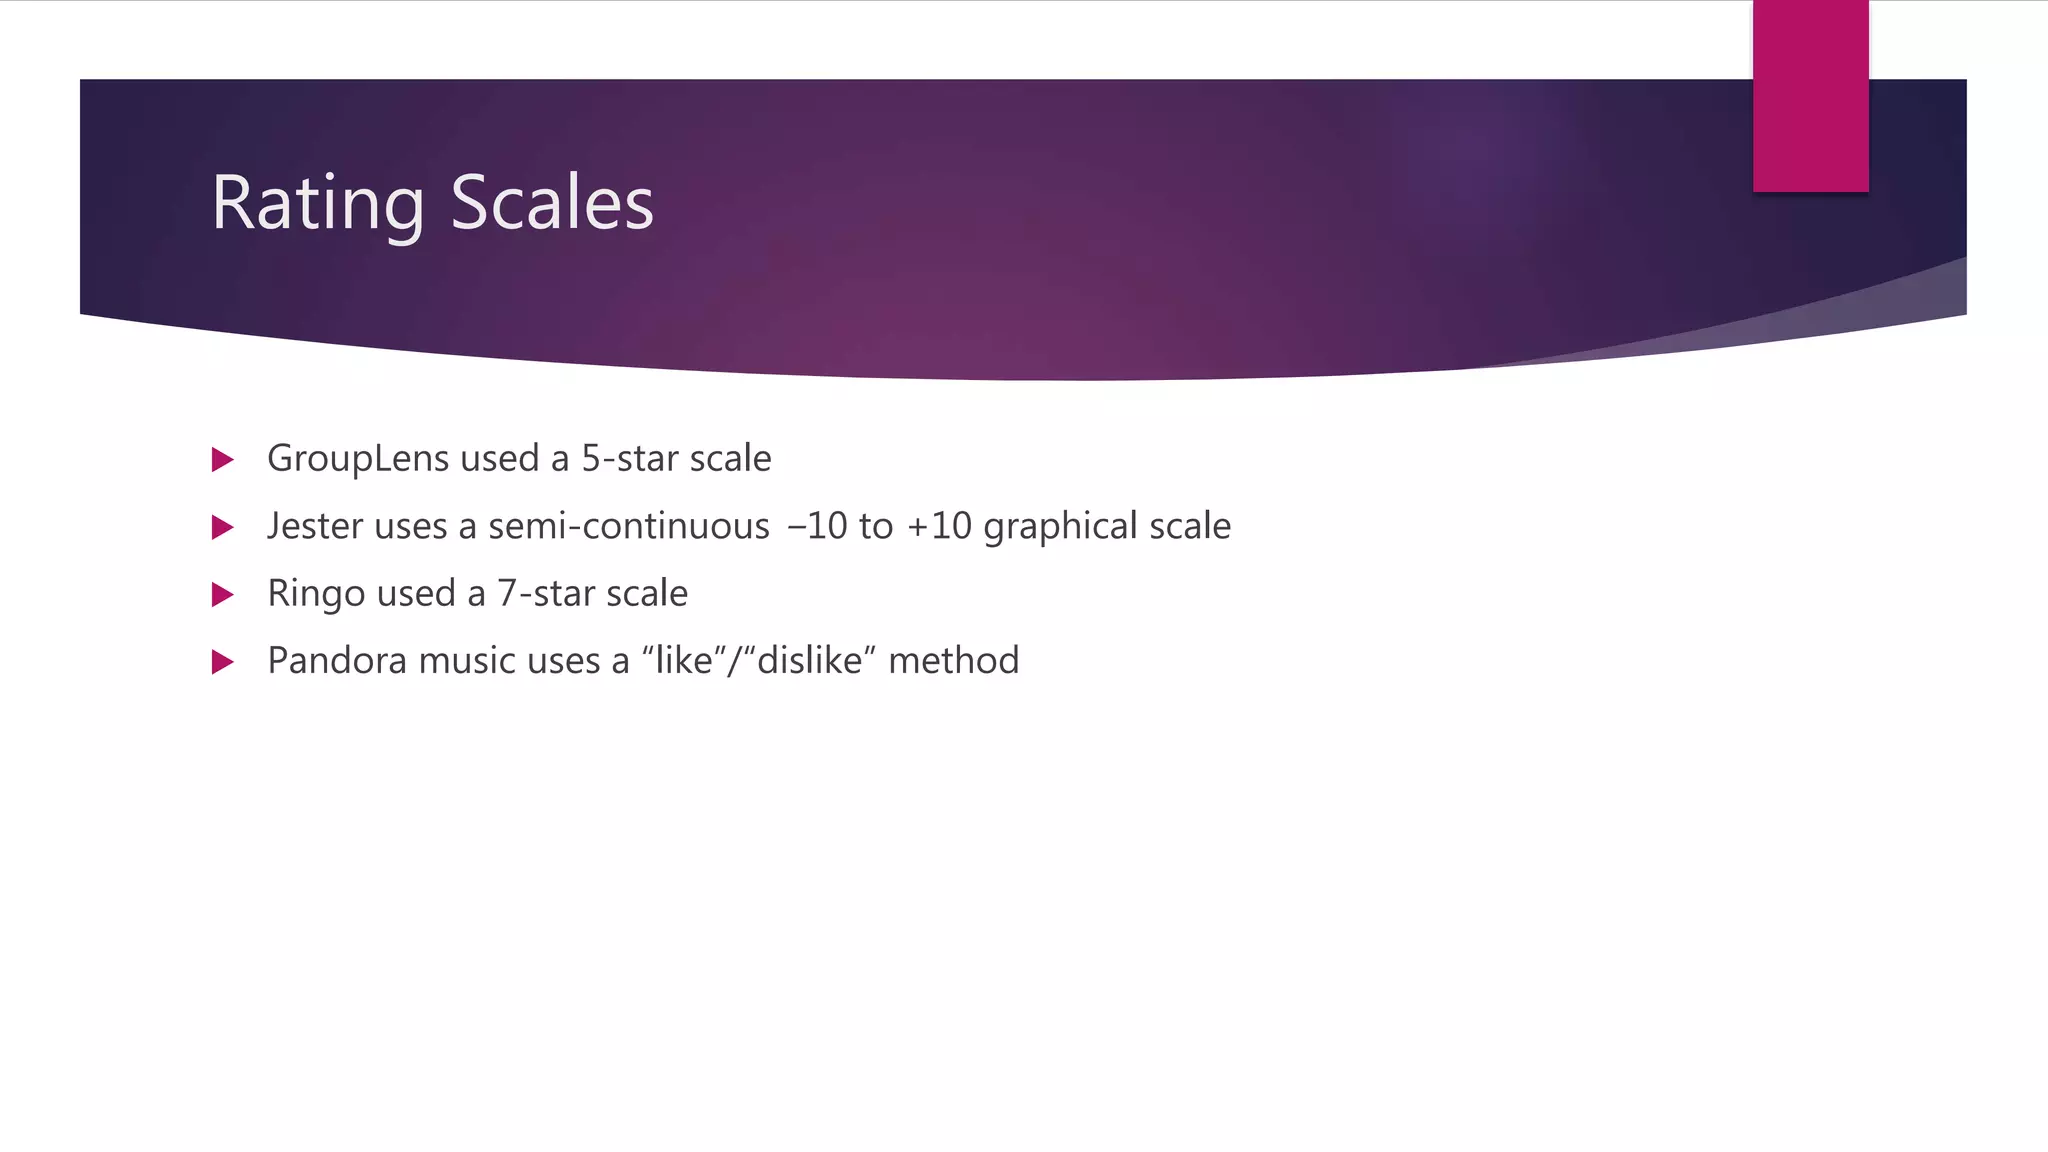
Different types of preference data, rating scales, and strategies to minimize noise in ratings.


![[Final]collaborative filtering and recommender systems](https://cdn.slidesharecdn.com/ss_thumbnails/finalcollaborativefilteringandrecommendersystems-141103044224-conversion-gate01-thumbnail.jpg?width=640&height=640&fit=bounds)