Downloaded 49 times


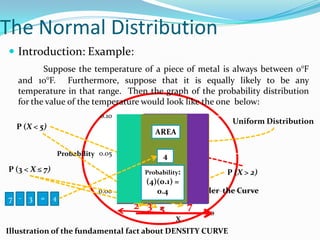


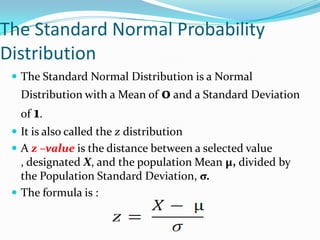
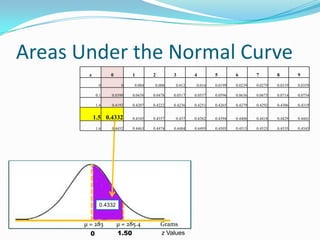
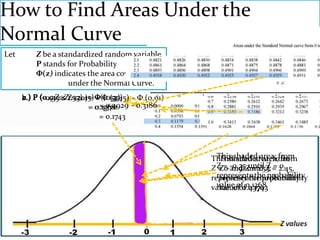

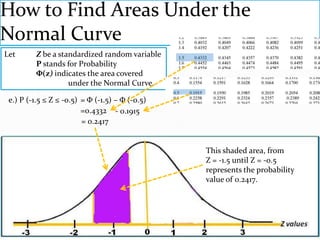


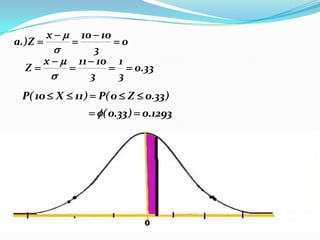
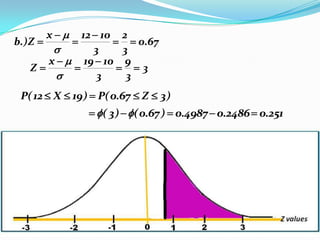
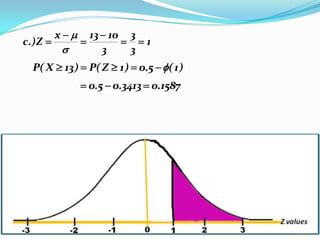
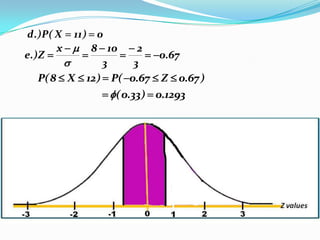
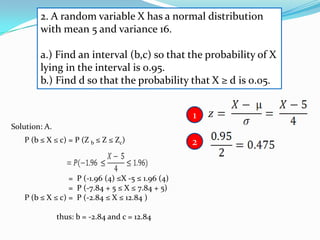


This document provides an introduction to the normal distribution and standard normal probability distribution. It defines key terms like mean, standard deviation, and z-scores. It explains that the normal distribution is a continuous, bell-shaped curve that is symmetrical about the mean. The document also shows how to find probabilities and areas under the normal curve using the z-table and standard normal distribution. Examples are provided to illustrate how to calculate areas between different z-values.


