The
Rules
•Answer the
questions within10
second
•If the answer is
correct the GROUP
will get 1 point
•if the answer is wrong
the GROUP will lose 1
point
•Have fun!
LEA RN ING
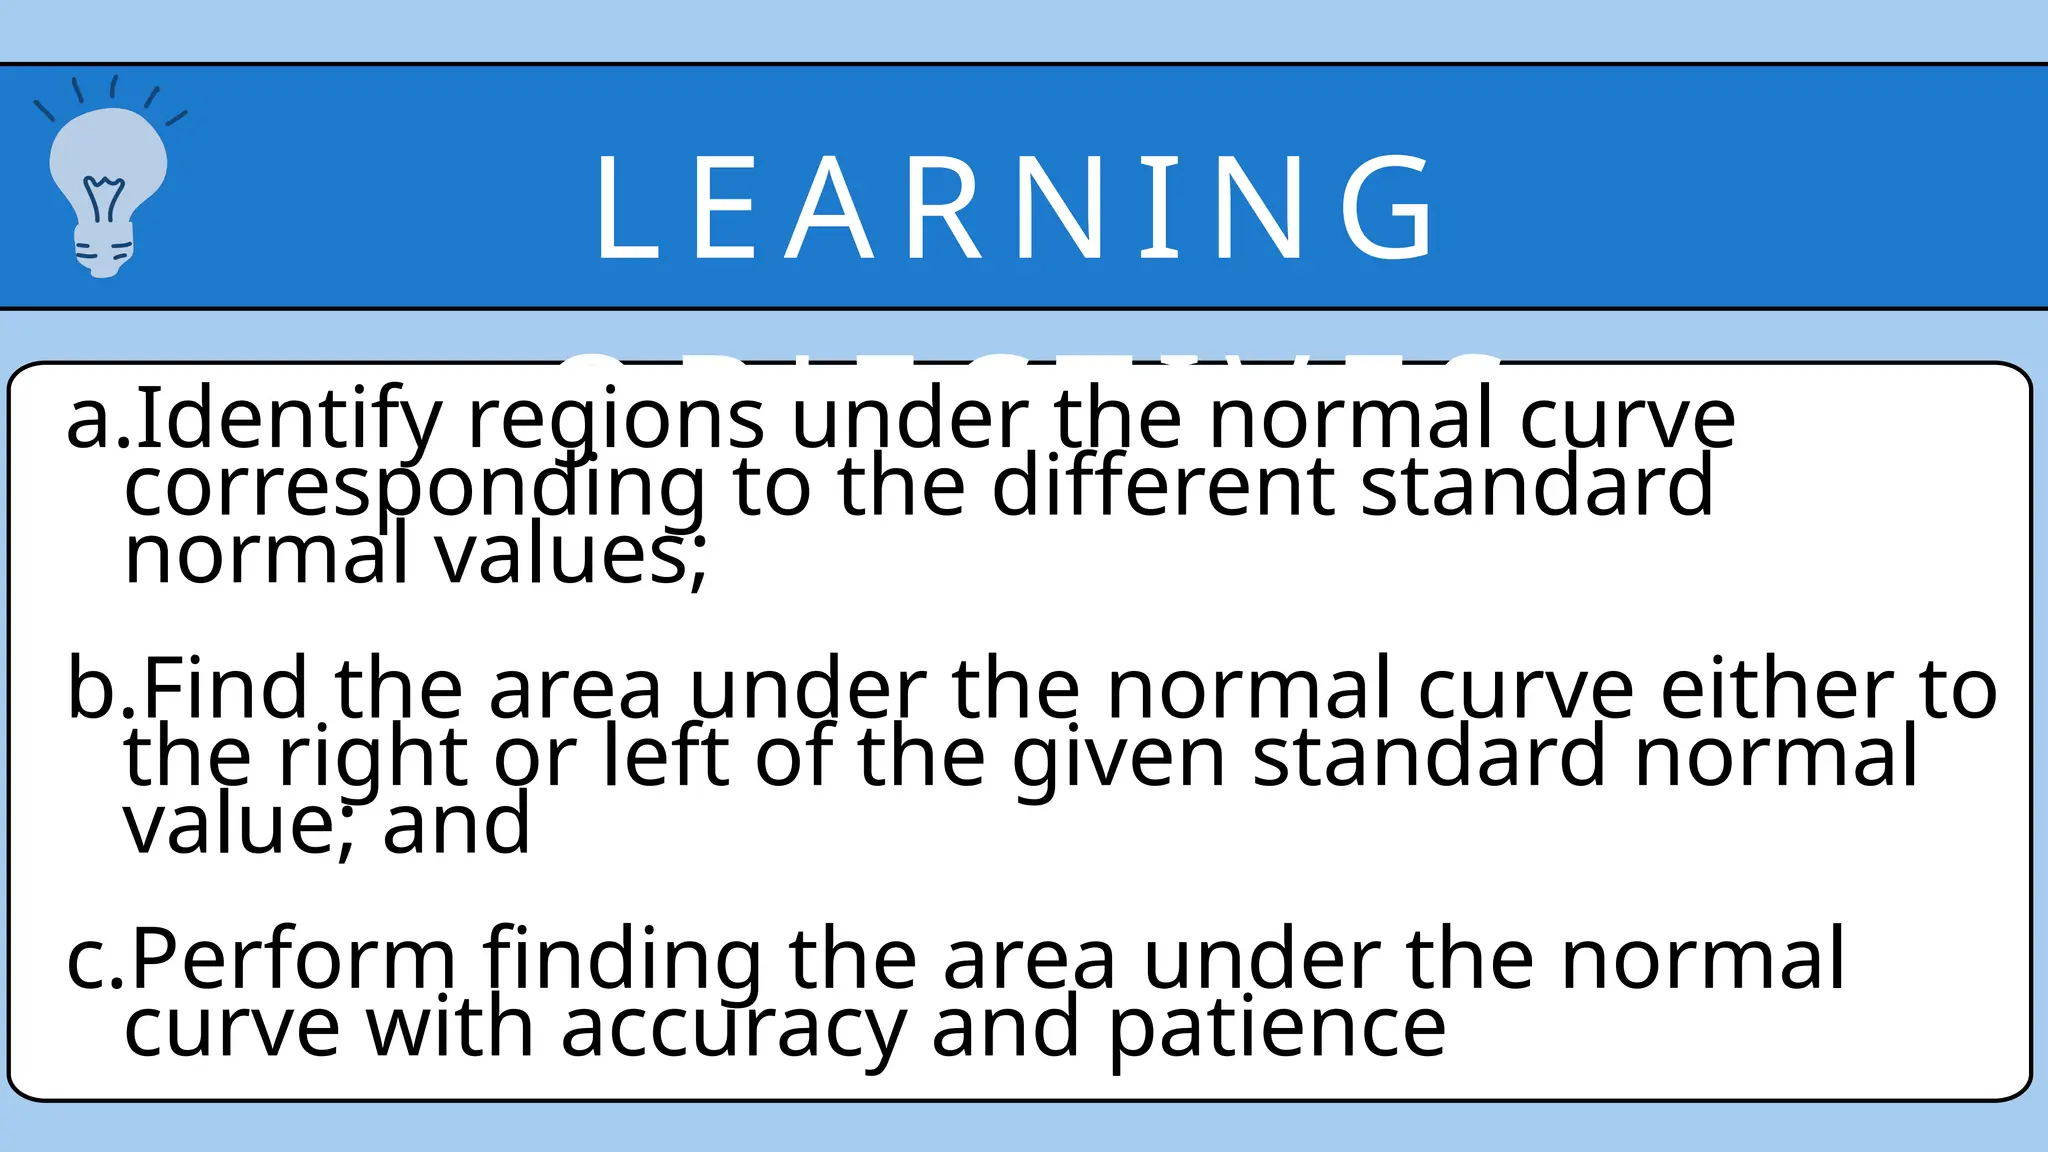
O BJE CTI V ES
a.Identify regions under the normal curve
corresponding to the different standard
normal values;
b.Find the area under the normal curve either to
the right or left of the given standard normal
value; and
c.Perform finding the area under the normal
curve with accuracy and patience
23.
M A TH E M A T I C S
1 1
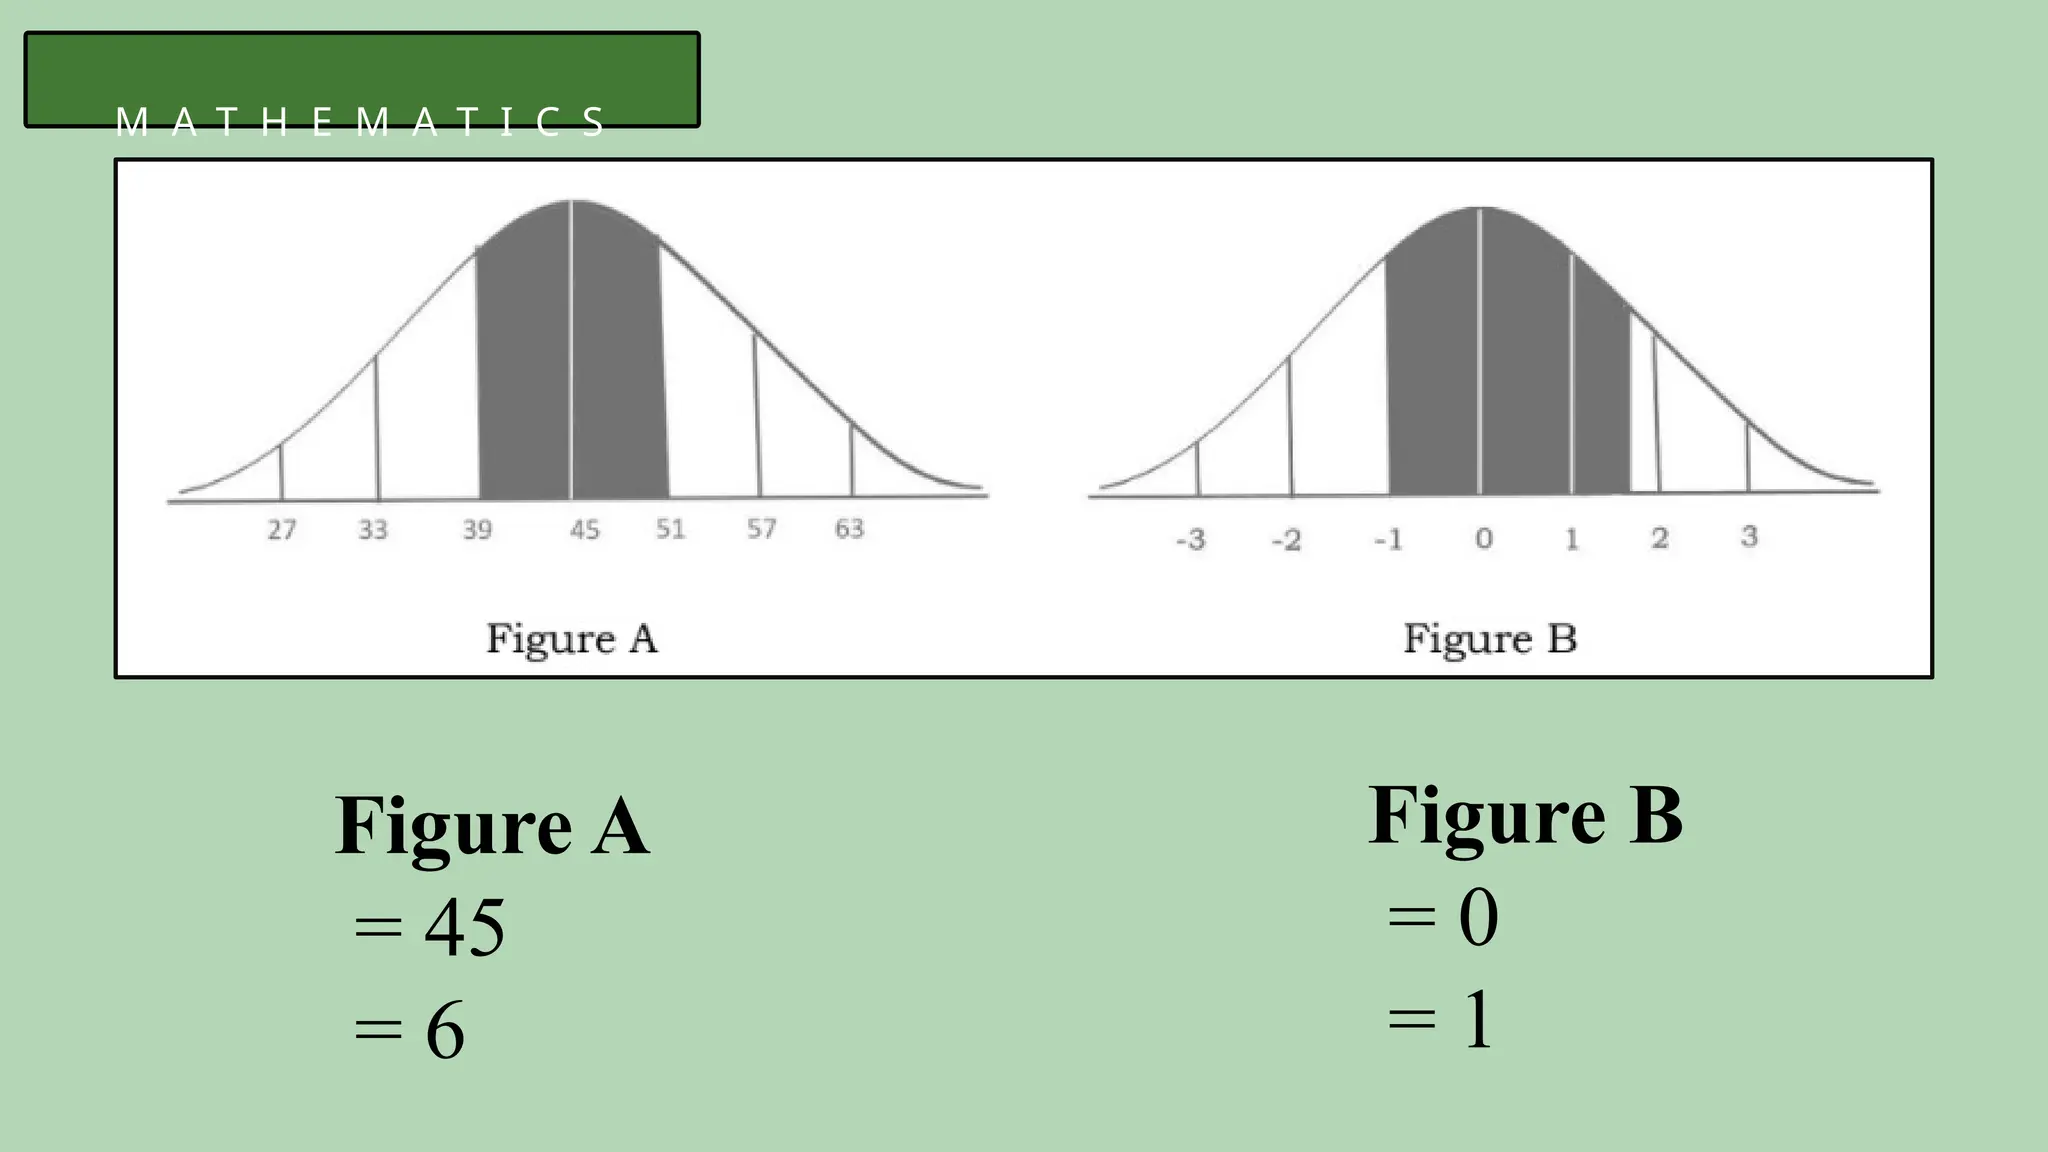
Figure A
= 45
= 6
Figure B
= 0
= 1
24.
M A TH E M A T I C S
1 1
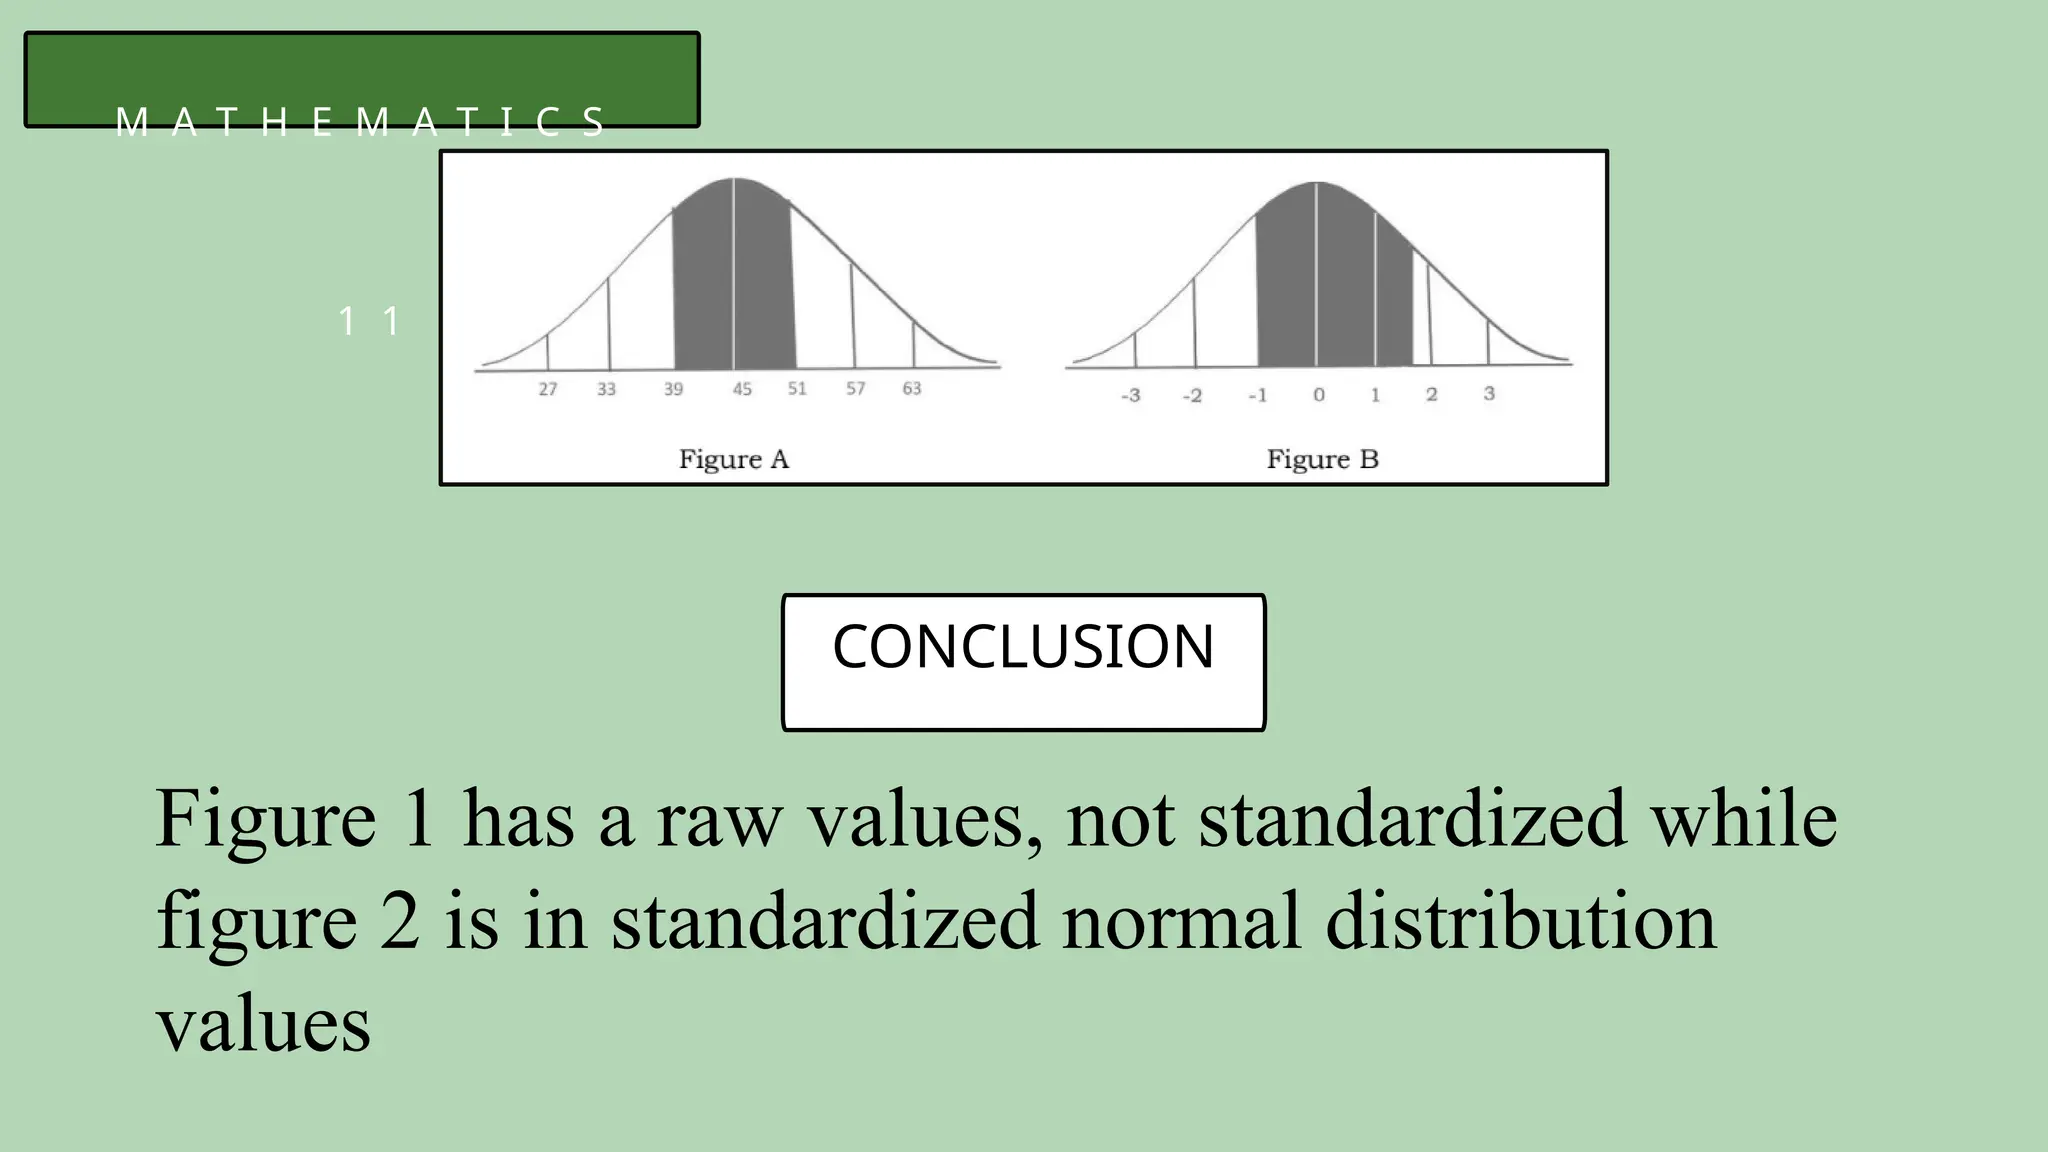
Figure 1 has a raw values, not standardized while
figure 2 is in standardized normal distribution
values
CONCLUSION
25.
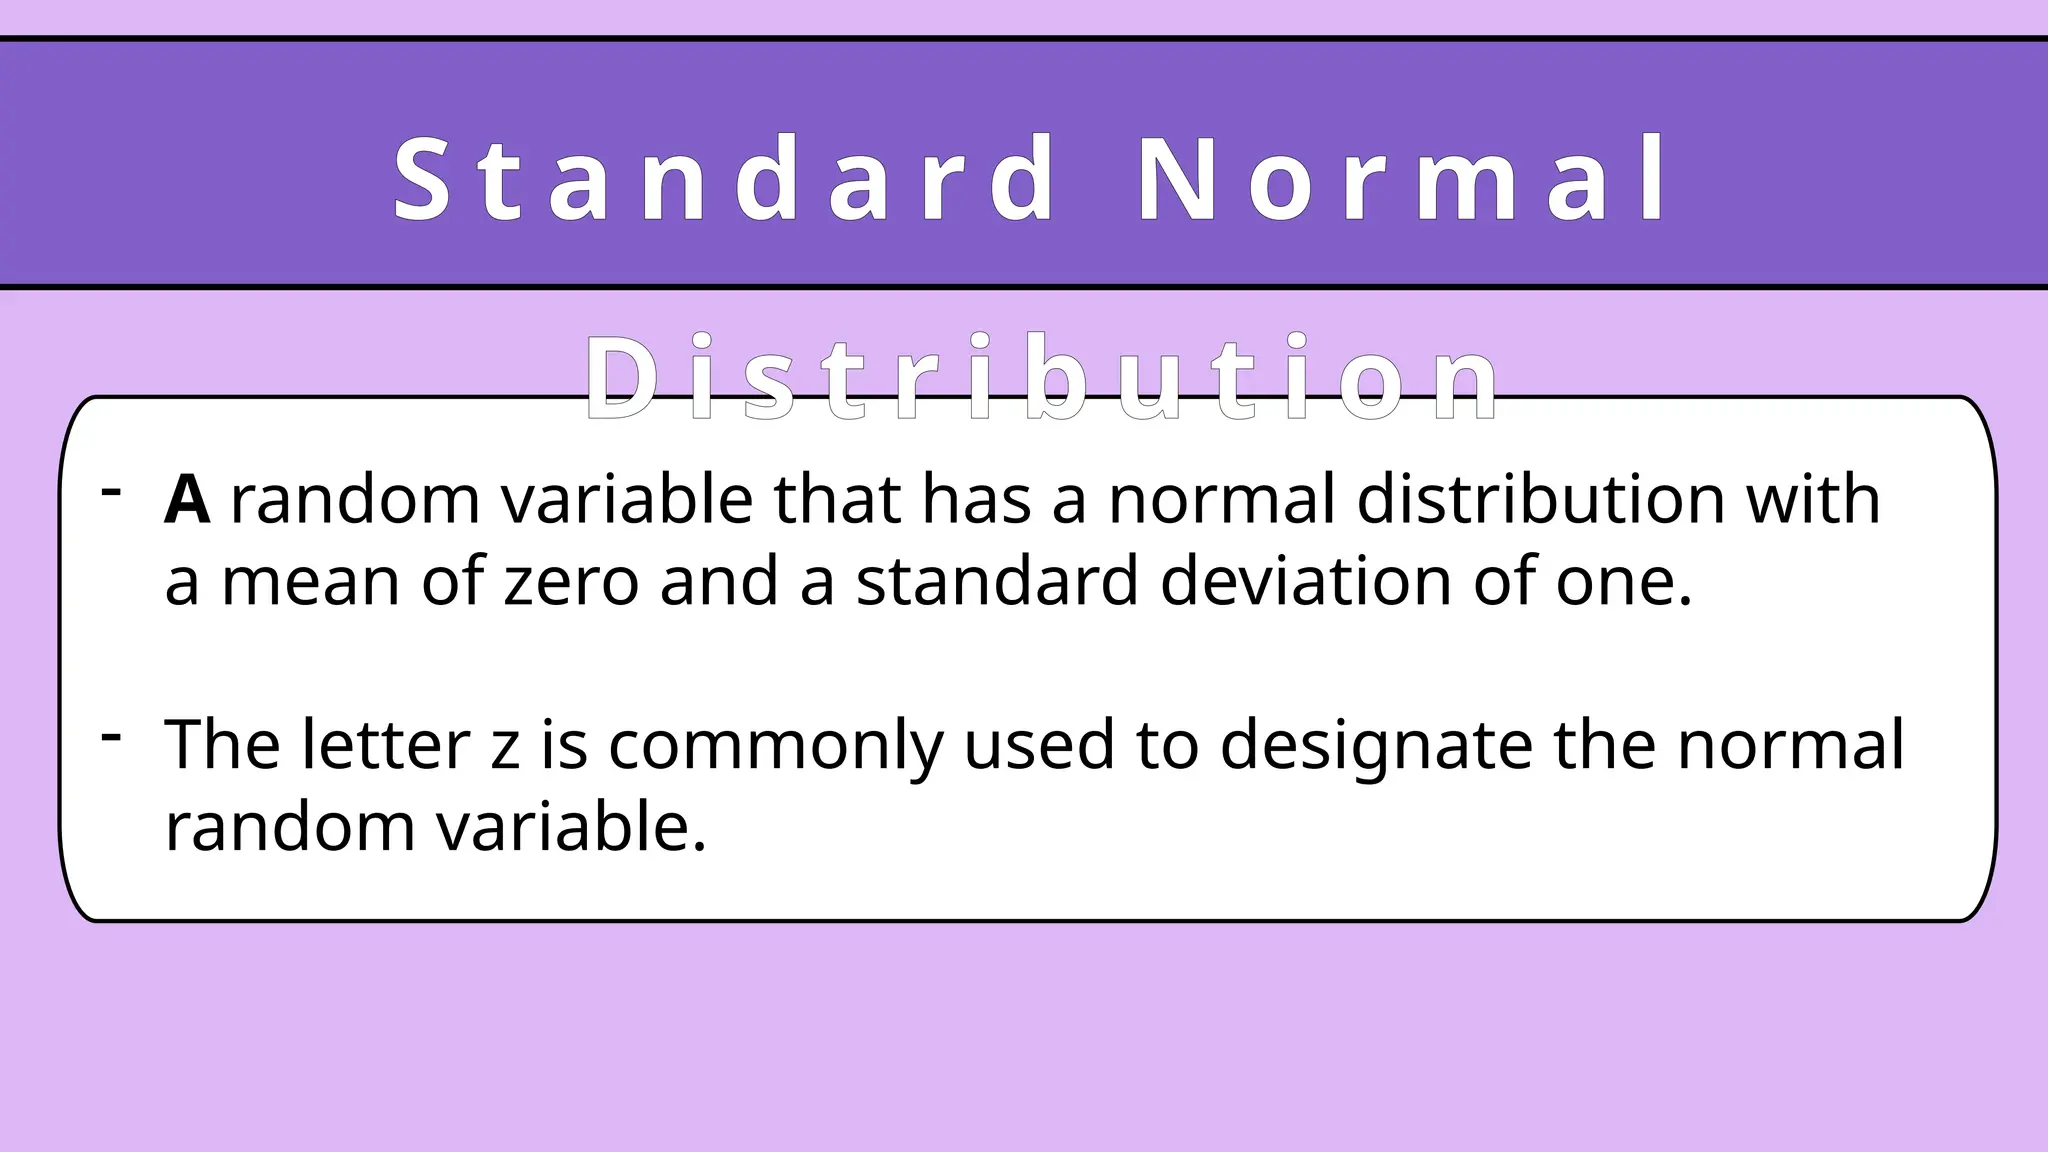
- A randomvariable that has a normal distribution with
a mean of zero and a standard deviation of one.
- The letter z is commonly used to designate the normal
random variable.
S t a n d a r d N o r m a l
D i s t r i b u t i o n
26.
W h yd o w e n e e d t o
s t a n d a r d i z e d t h e v a l u e s ?
27.
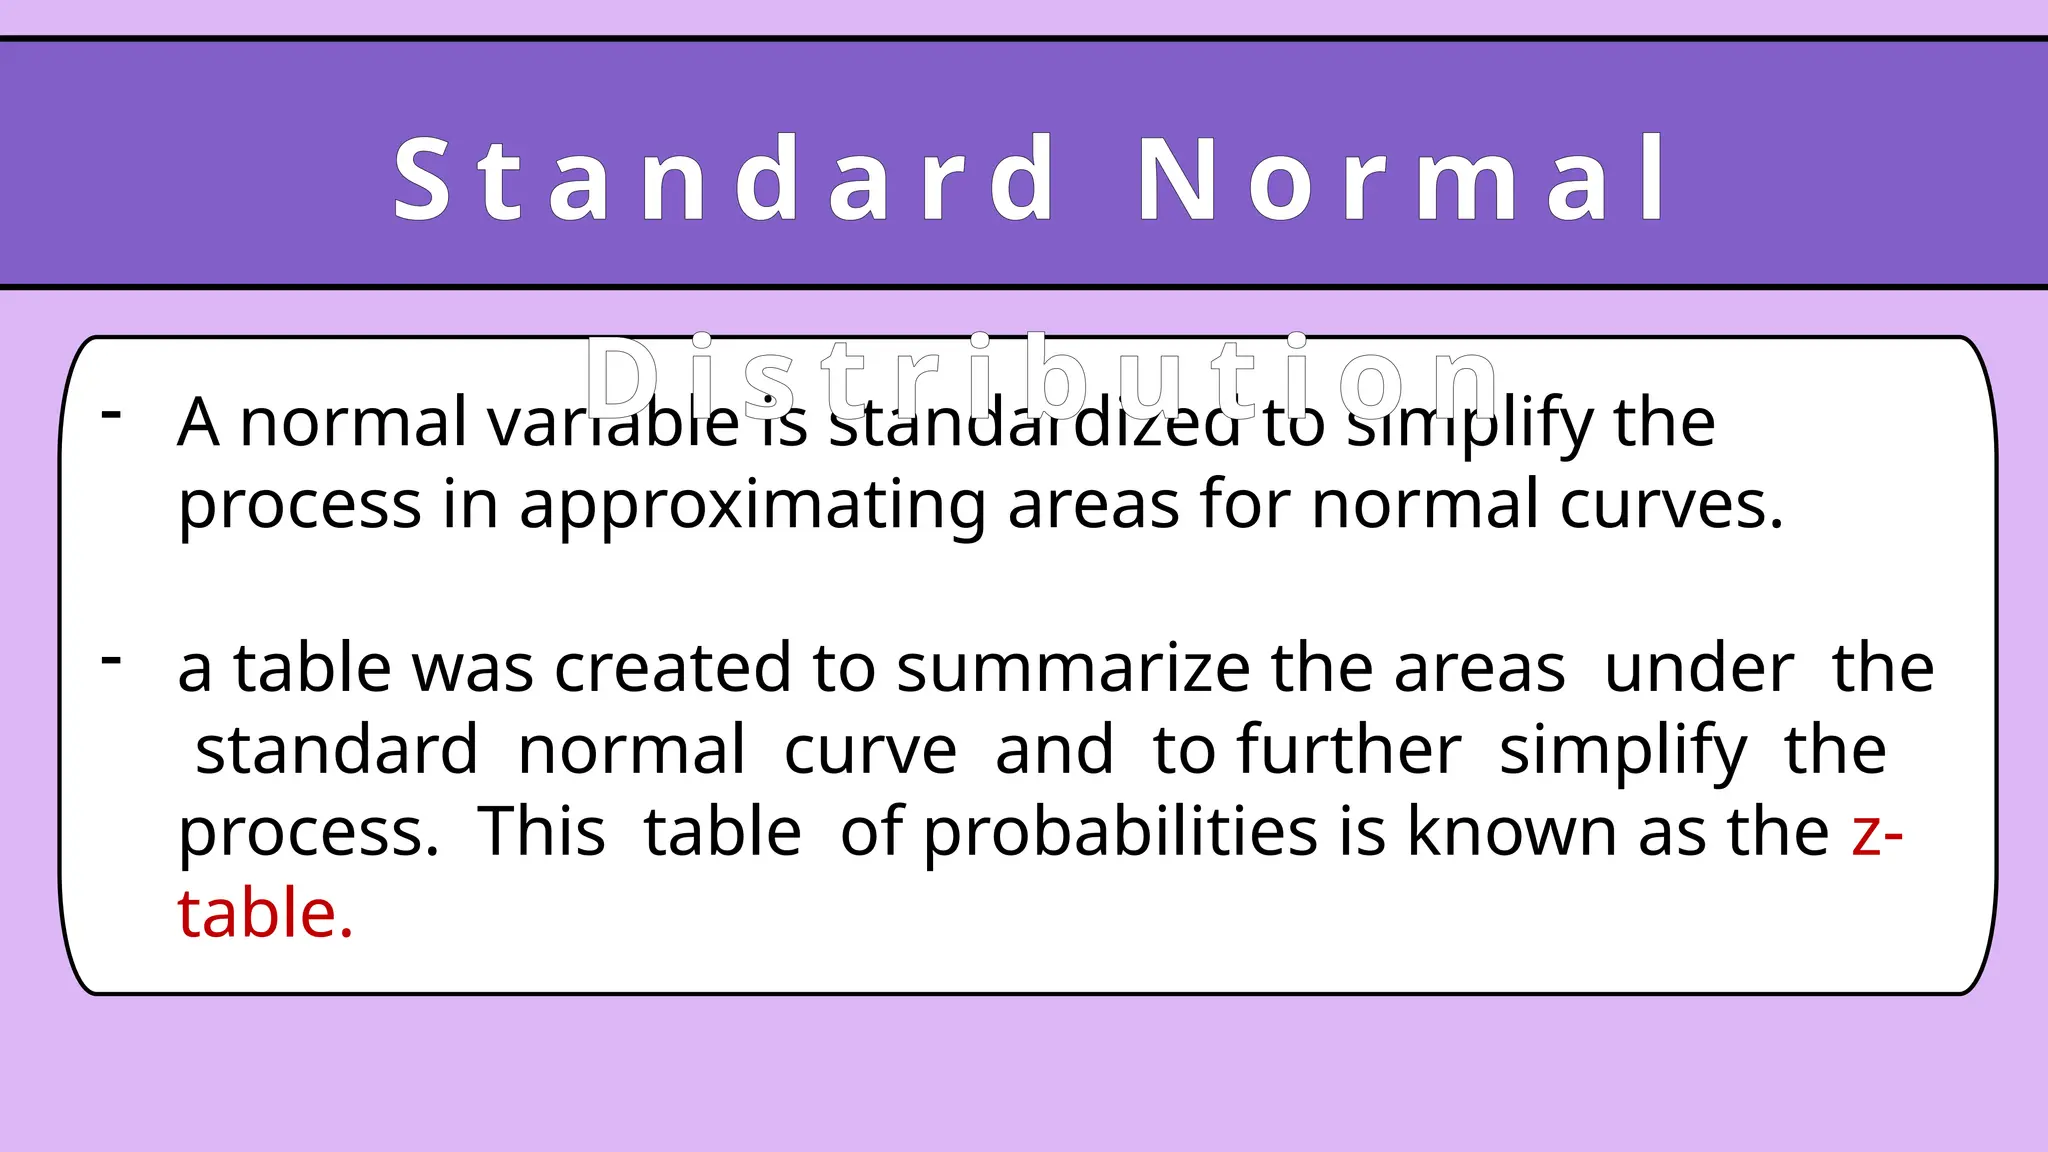
- A normalvariable is standardized to simplify the
process in approximating areas for normal curves.
- a table was created to summarize the areas under the
standard normal curve and to further simplify the
process. This table of probabilities is known as the z-
table.
S t a n d a r d N o r m a l
D i s t r i b u t i o n
28.
S t an d a r d N o r m a l
D i s t r i b u t i o n
29.
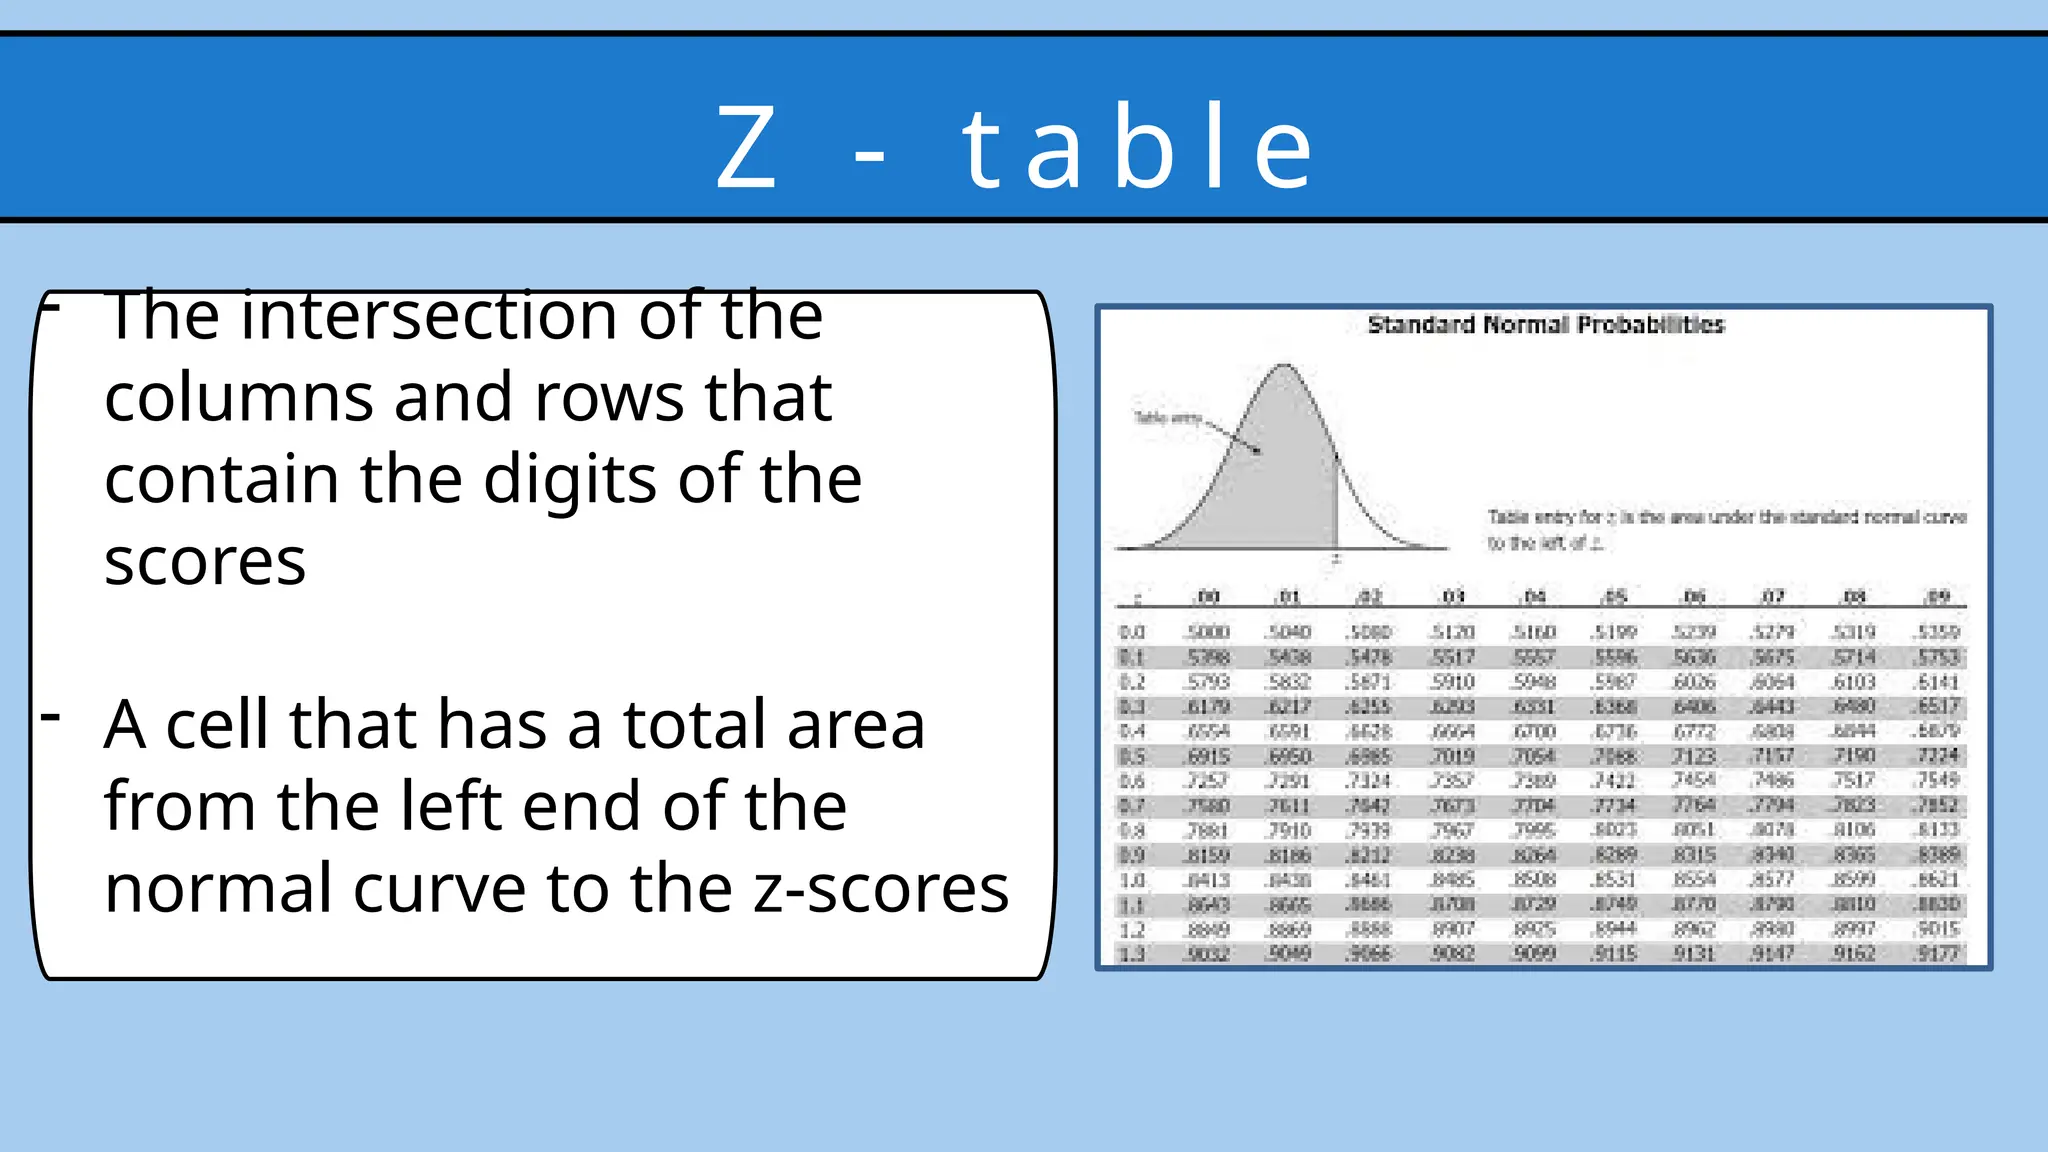
- The intersectionof the
columns and rows that
contain the digits of the
scores
- A cell that has a total area
from the left end of the
normal curve to the z-scores
Z - t a b l e
30.
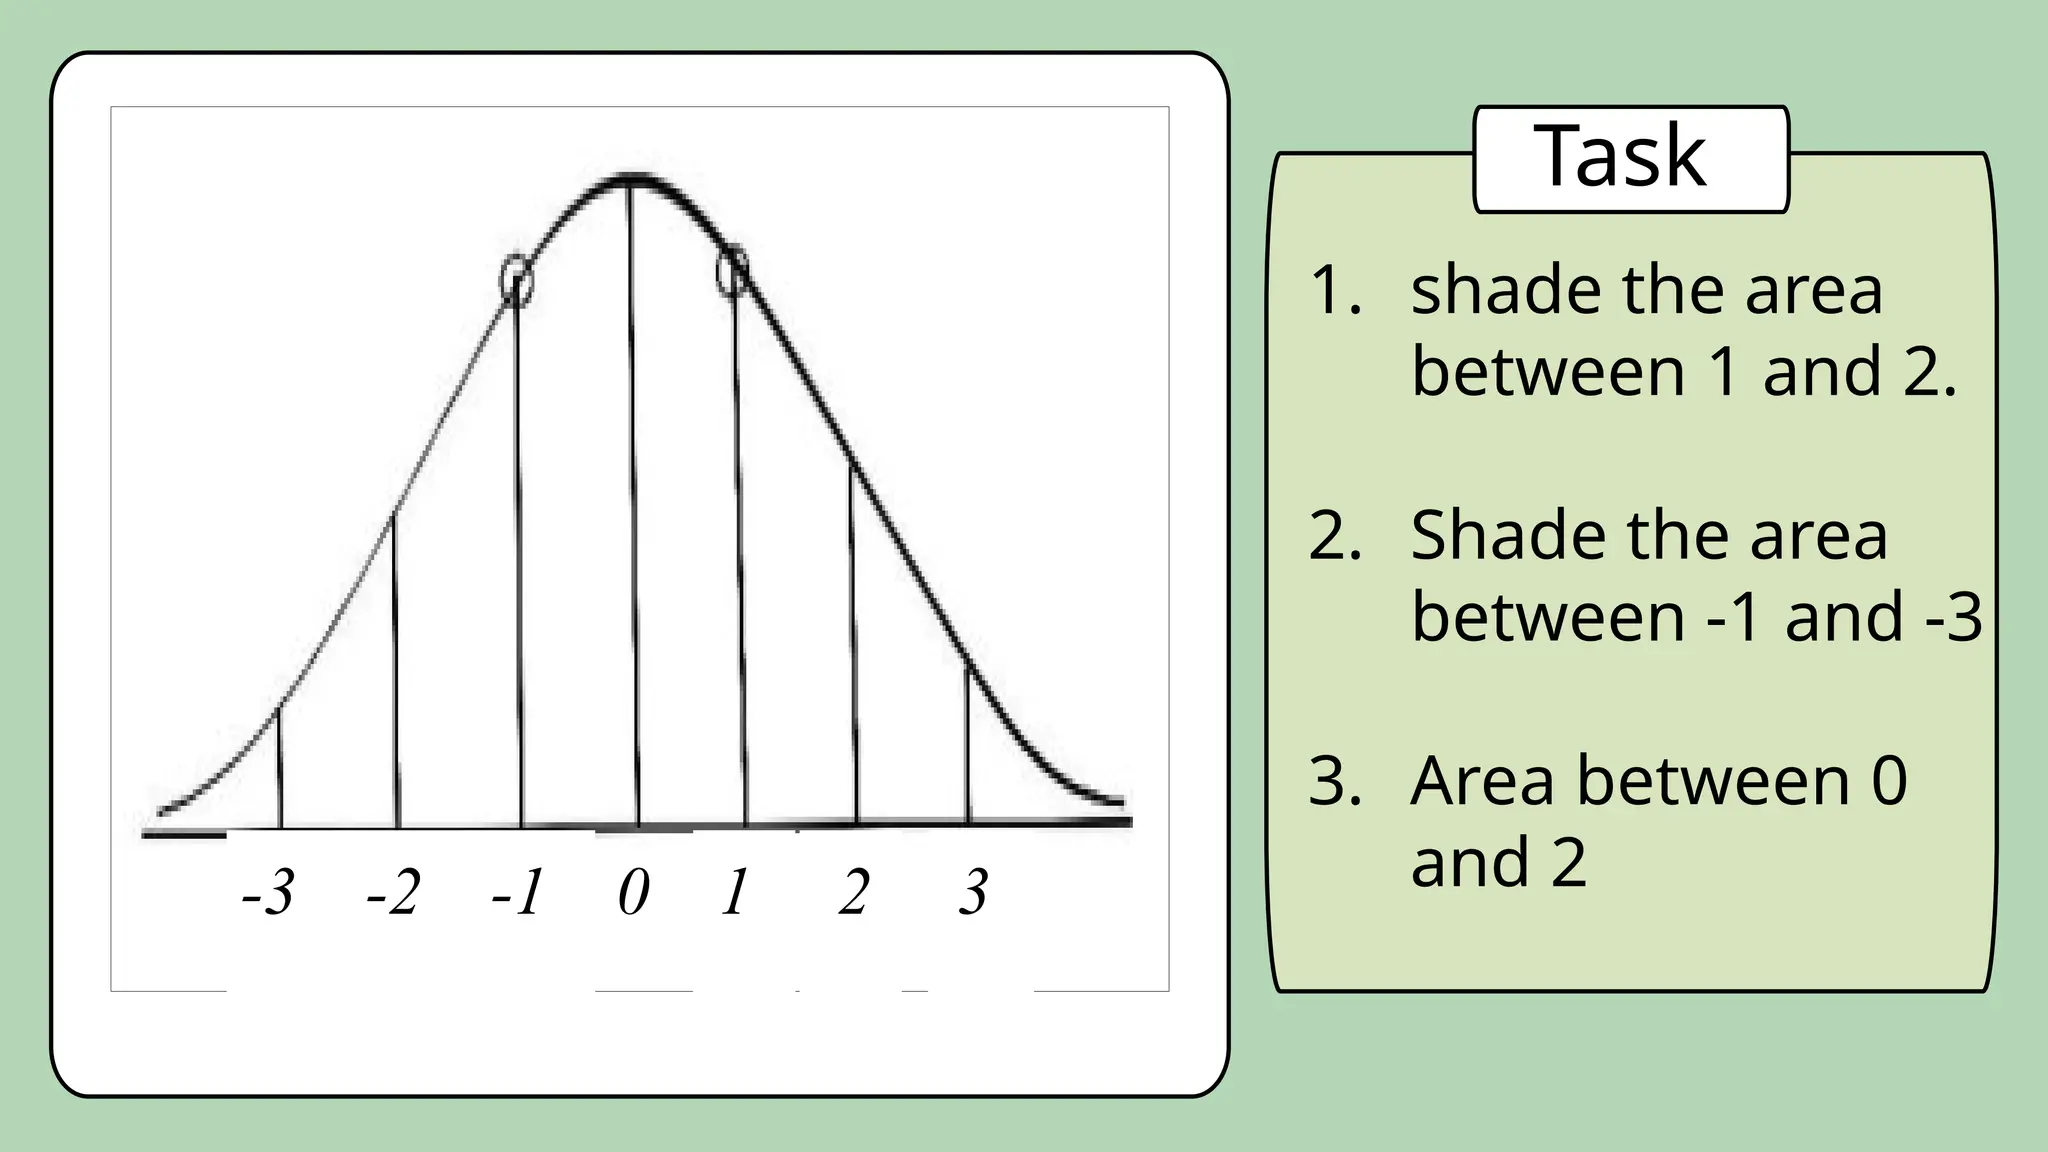
-3 -2 -10 1 2 3
1. shade the area
between 1 and 2.
2. Shade the area
between -1 and -3
3. Area between 0
and 2
Task
31.
The z-table providesthe section of the
area between any two specific values
under the curve, regions under the curve
can be described in terms of area.
Z - t a b l e
Find the areathat corresponds to z =
1.85.
EX AM P LE
34.
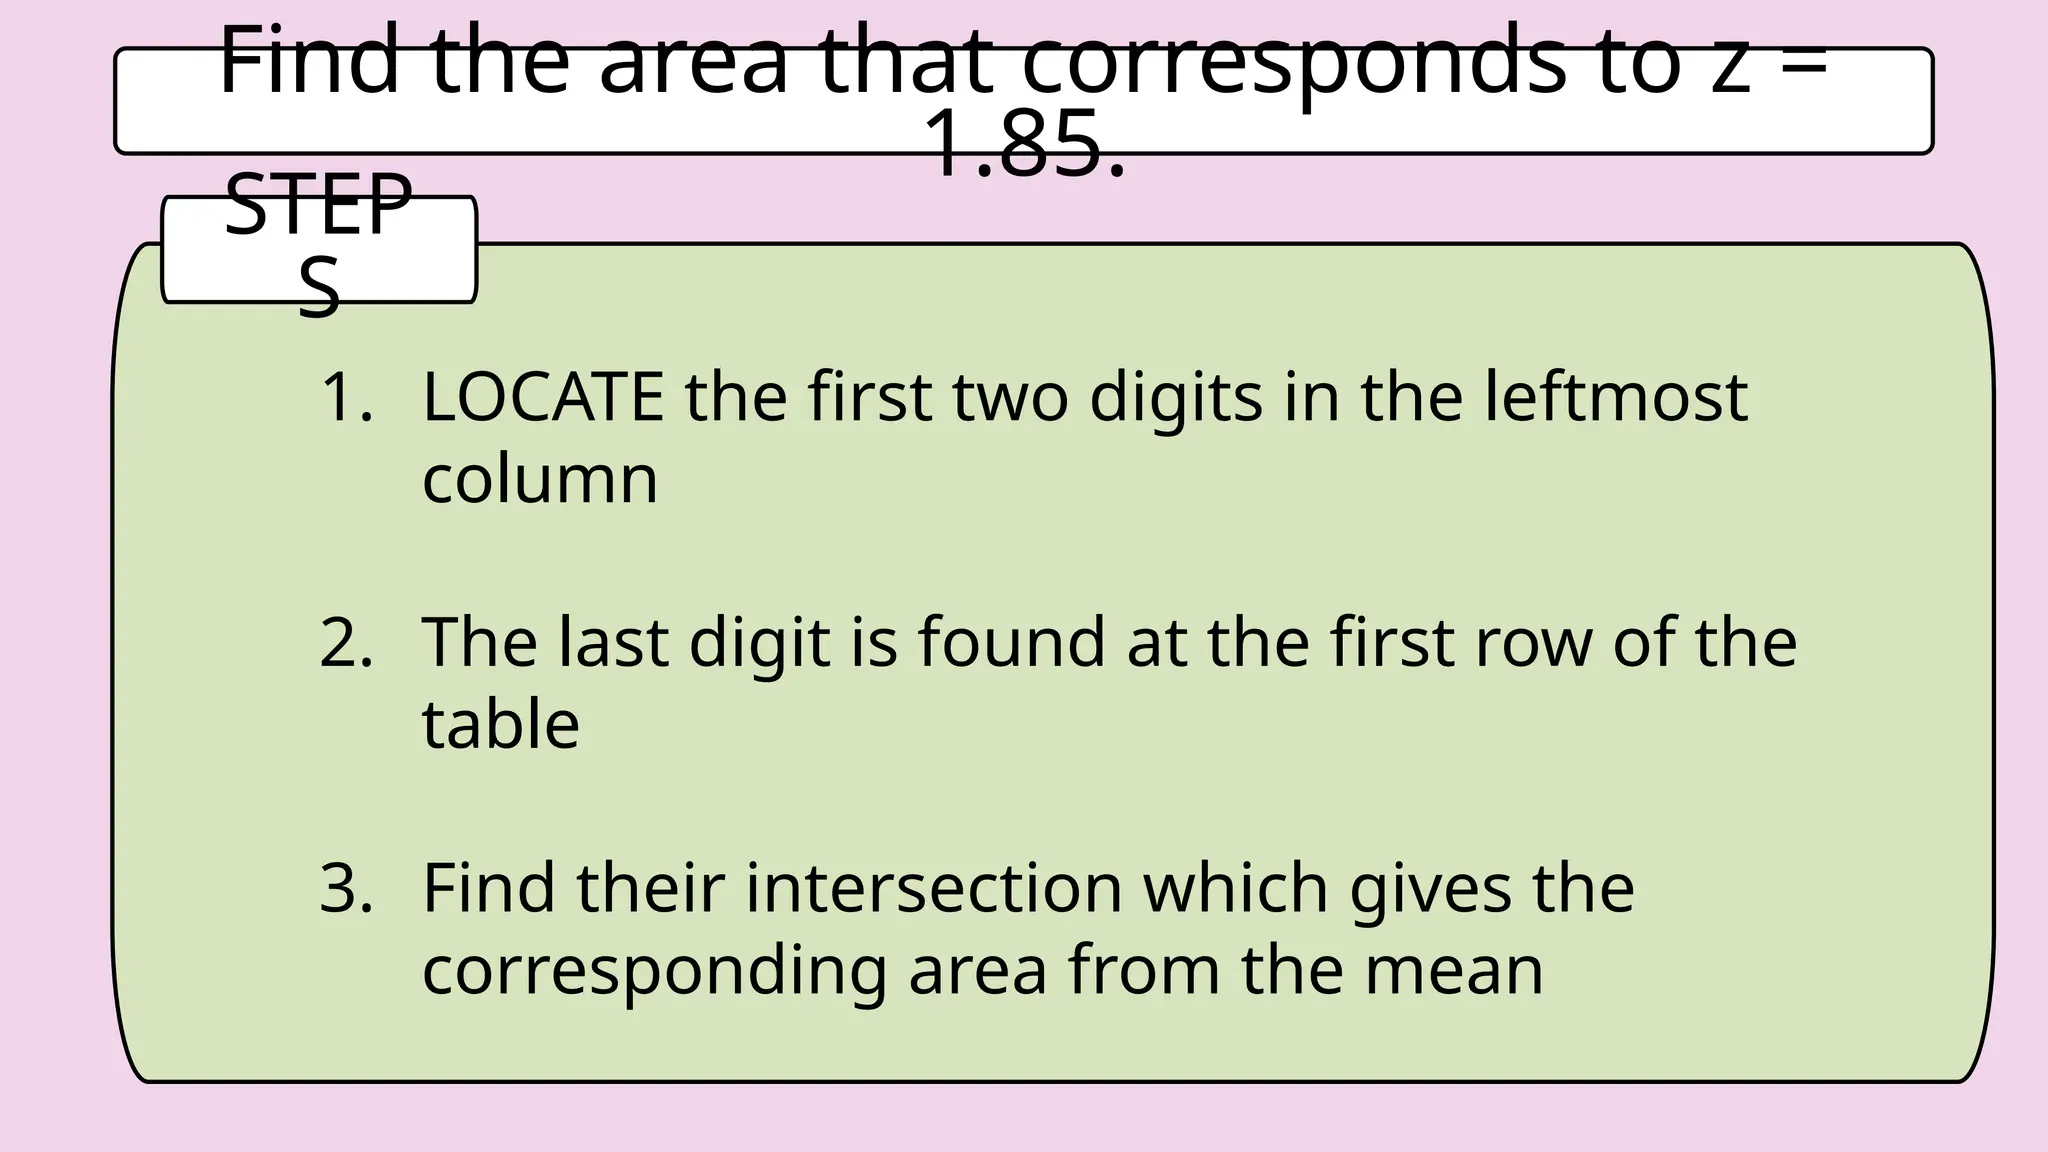
Find the areathat corresponds to z =
1.85.
STEP
S
1. LOCATE the first two digits in the leftmost
column
2. The last digit is found at the first row of the
table
3. Find their intersection which gives the
corresponding area from the mean
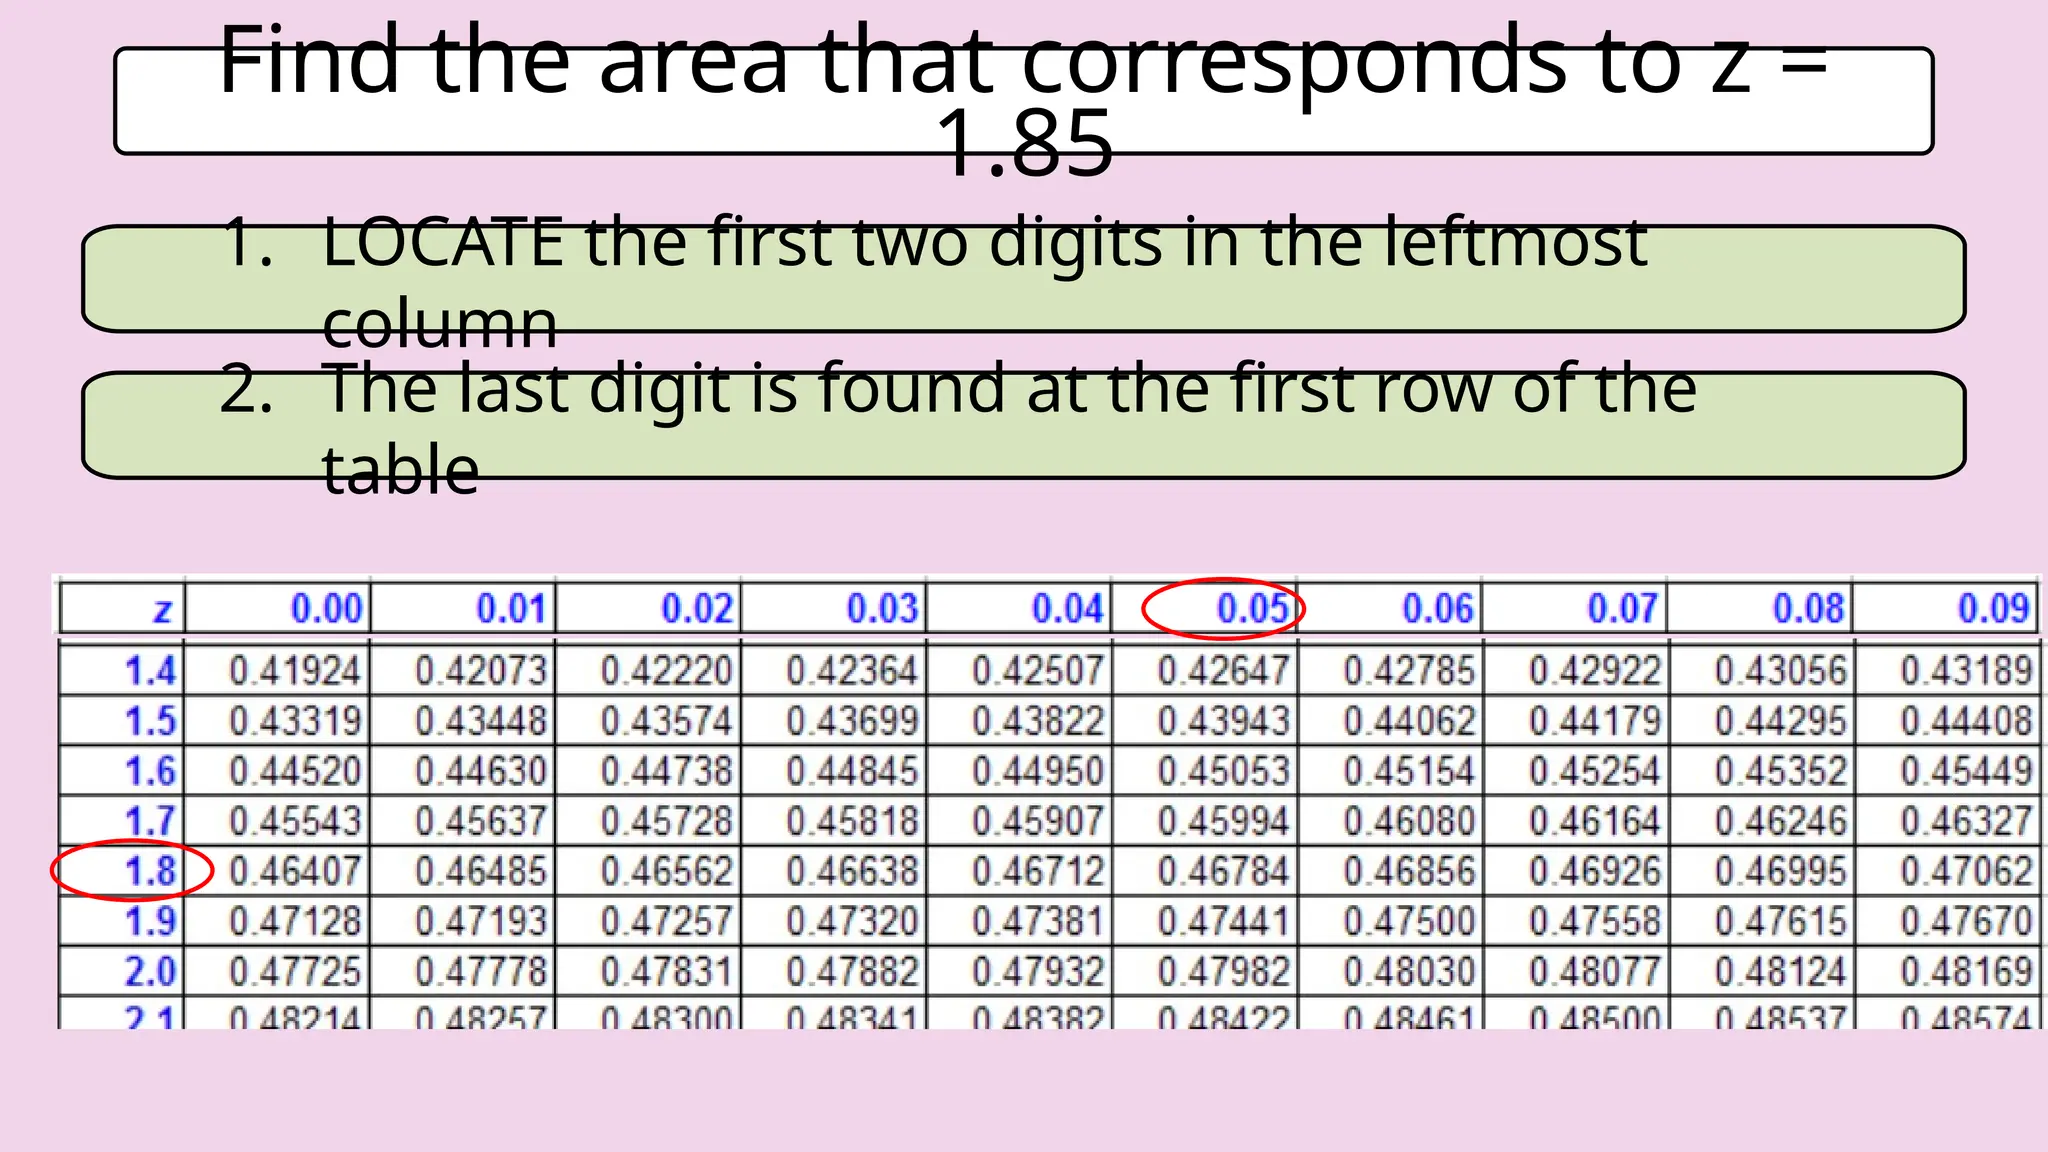
35.
Find the areathat corresponds to z =
1.85
1. LOCATE the first two digits in the leftmost
column
2. The last digit is found at the first row of the
table
36.
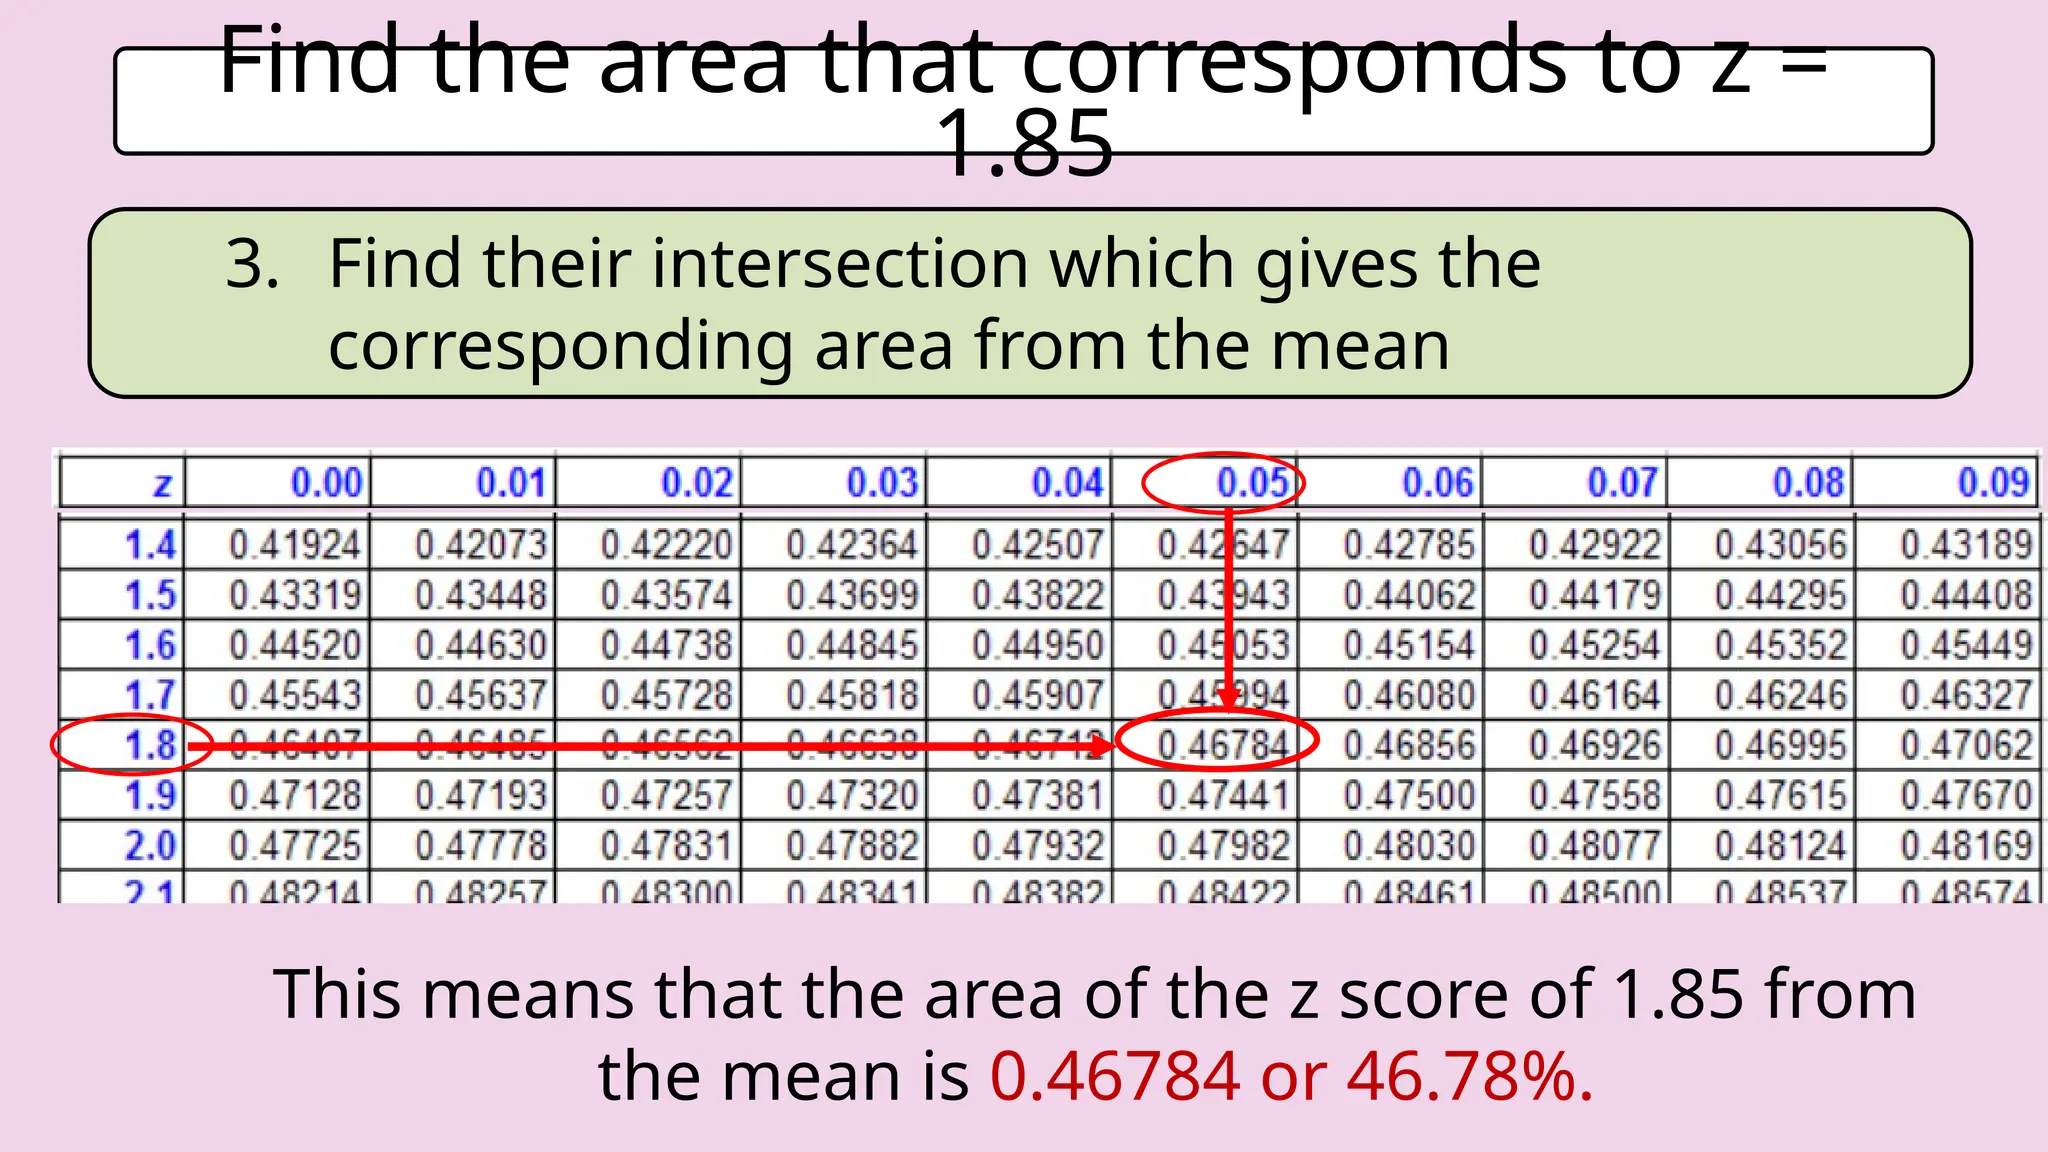
Find the areathat corresponds to z =
1.85
3. Find their intersection which gives the
corresponding area from the mean
This means that the area of the z score of 1.85 from
the mean is 0.46784 or 46.78%.
37.
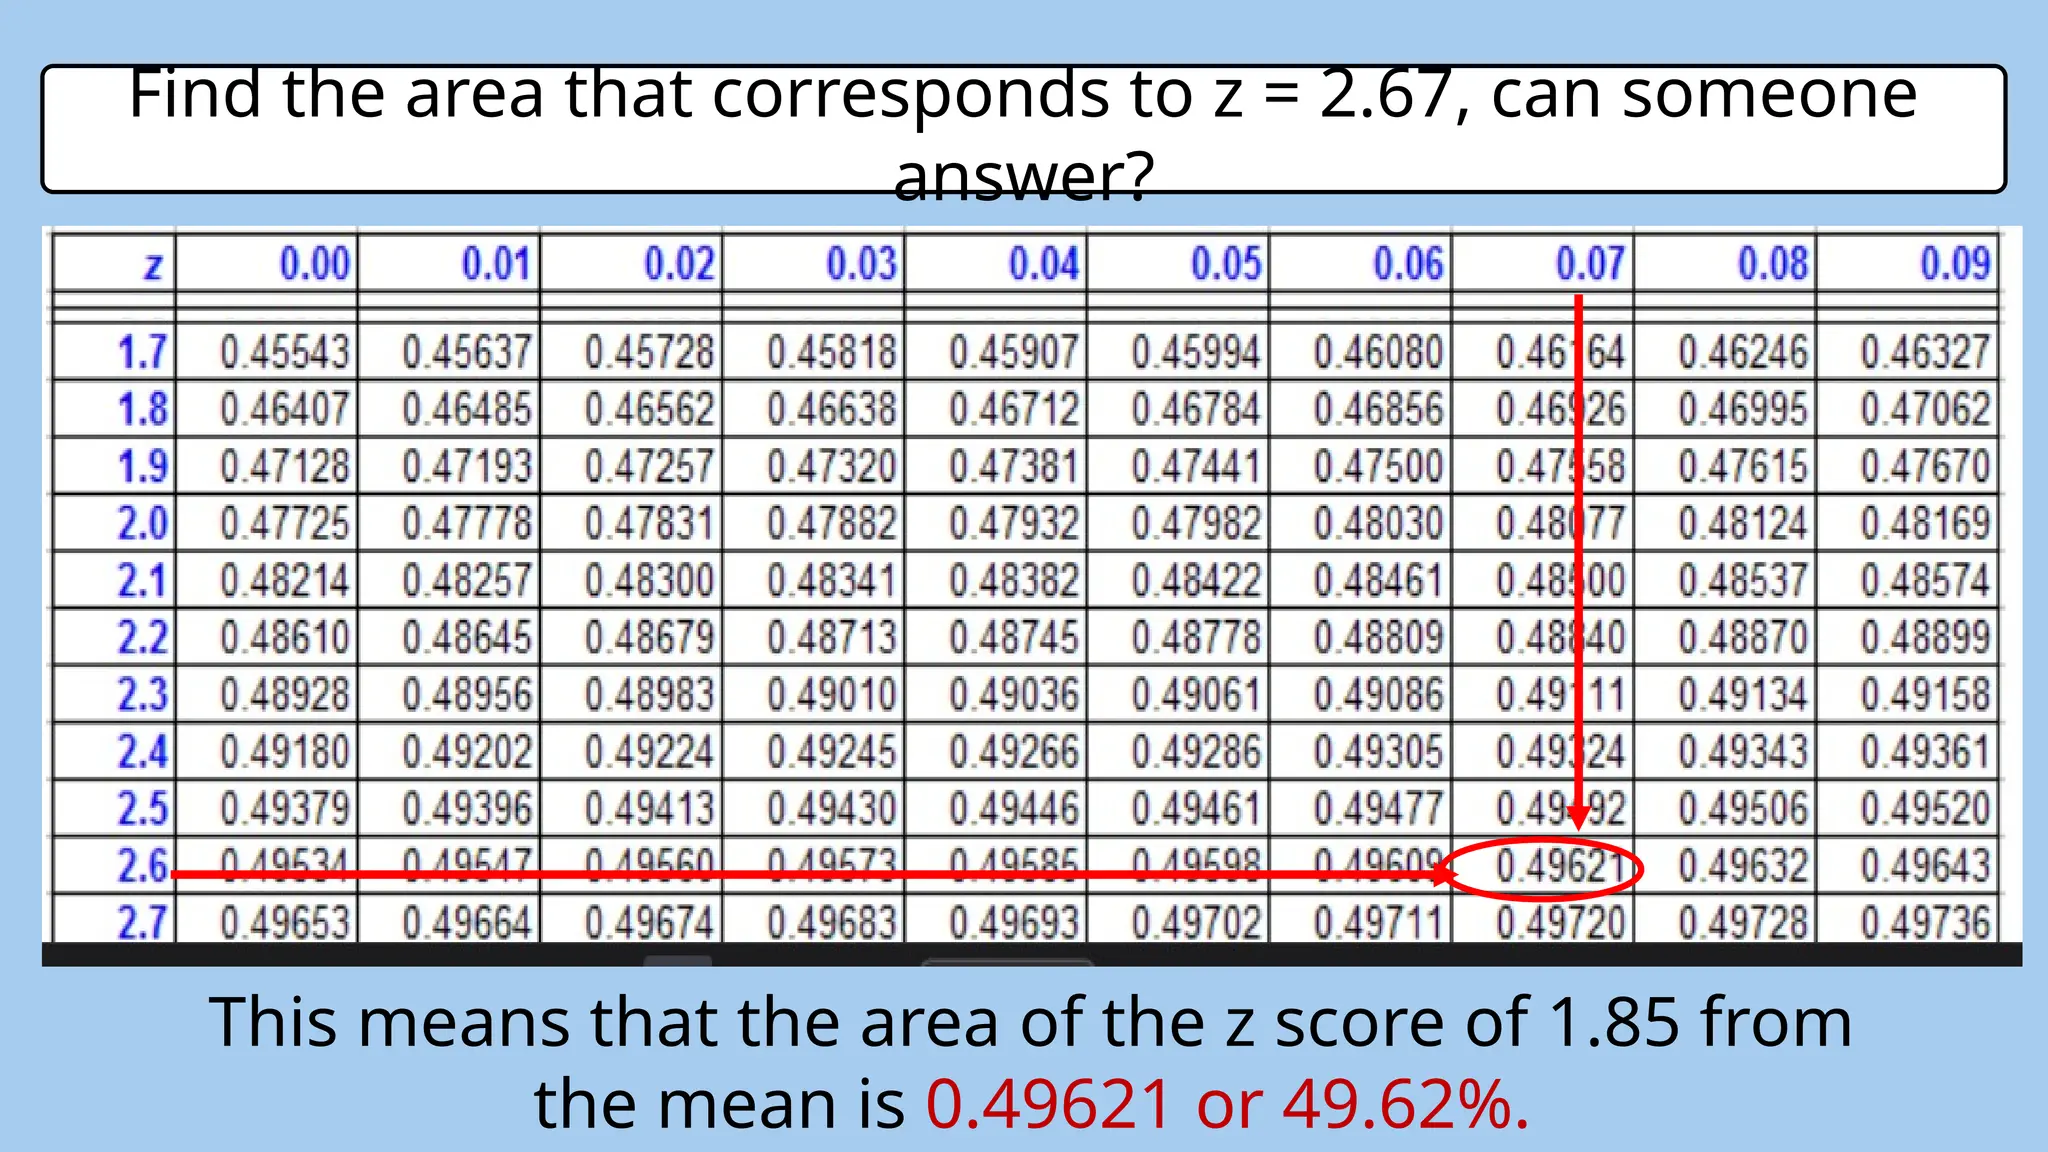
Find the areathat corresponds to z = 2.67, can someone
answer?
This means that the area of the z score of 1.85 from
the mean is 0.49621 or 49.62%.
38.
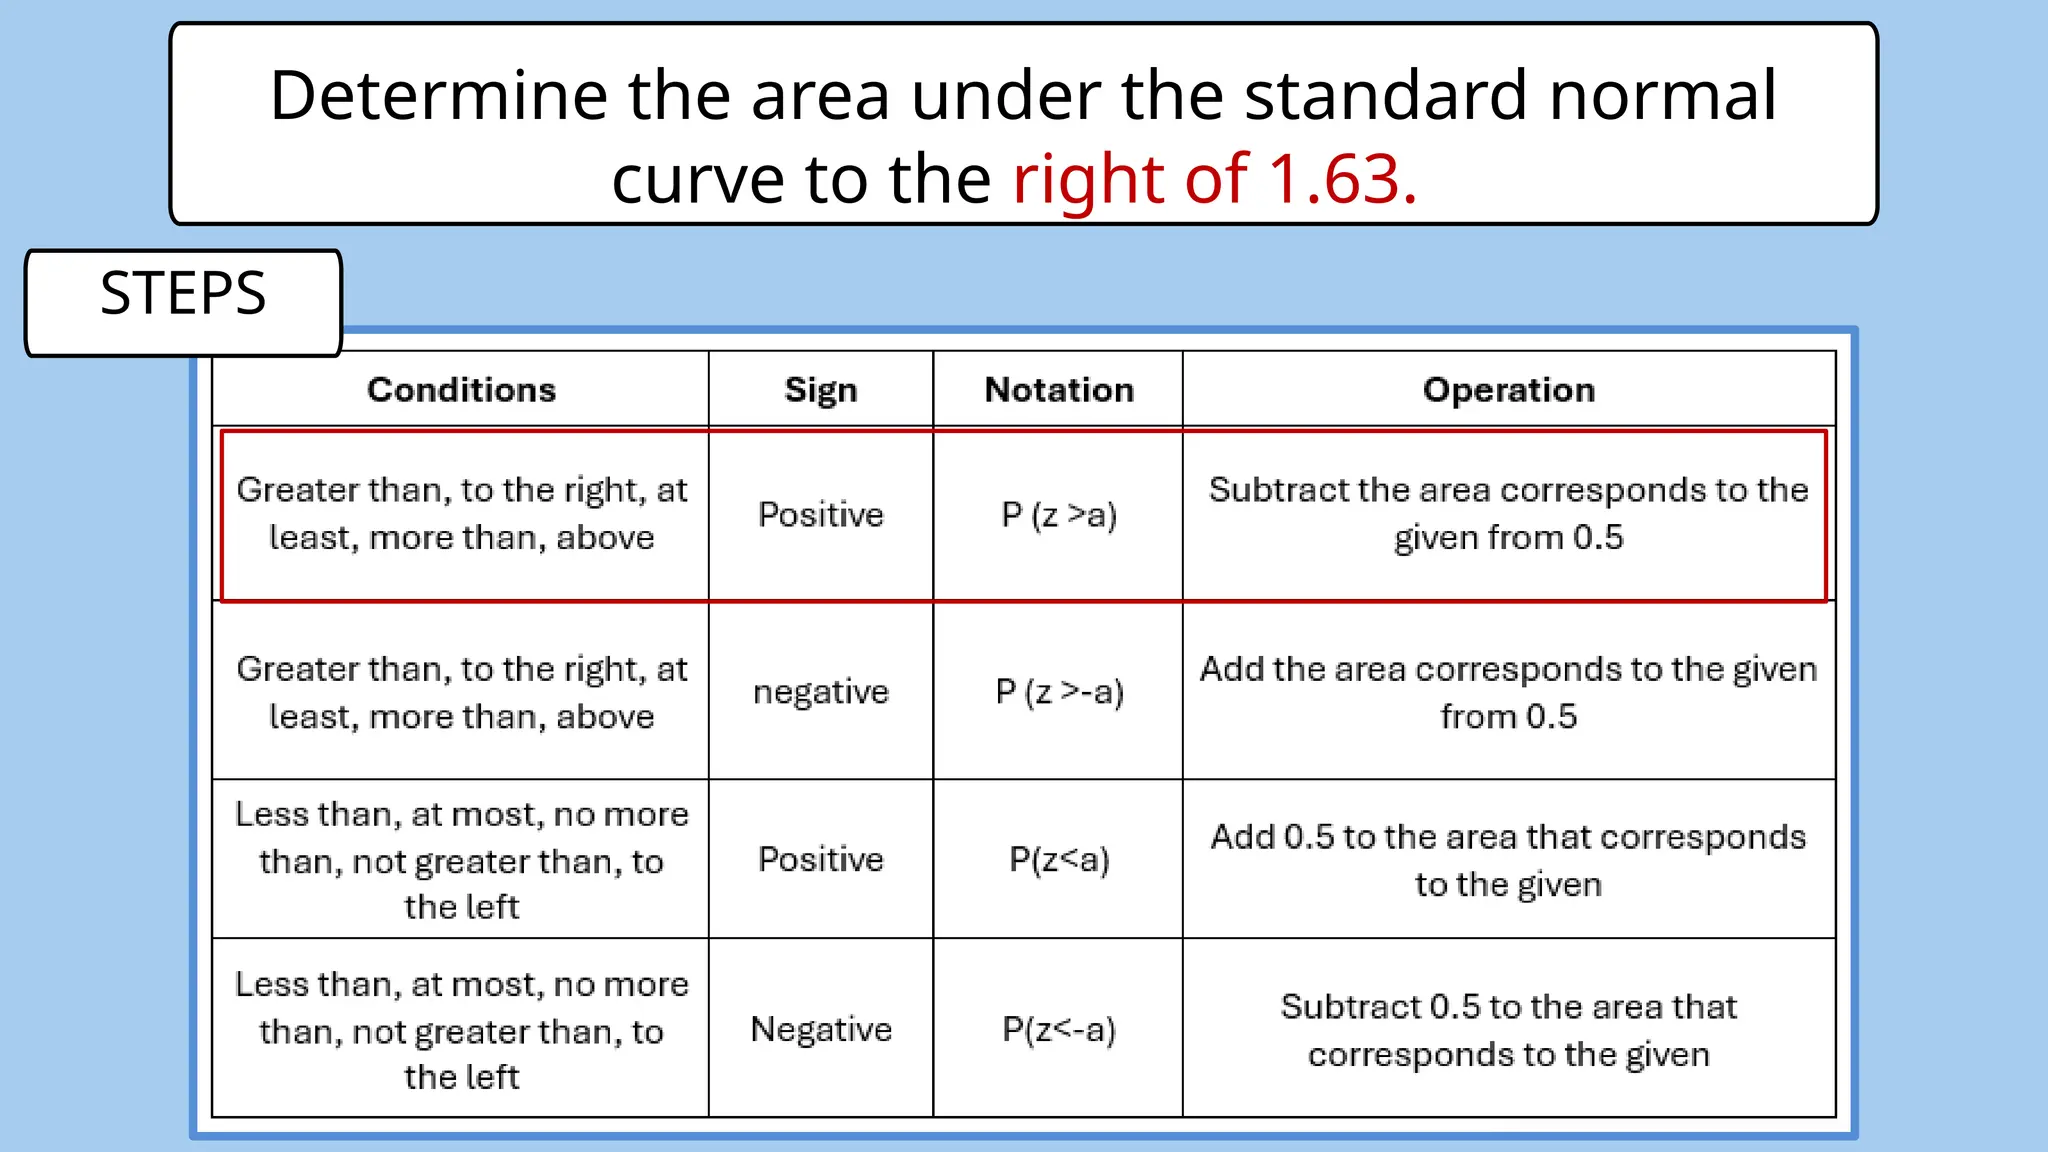
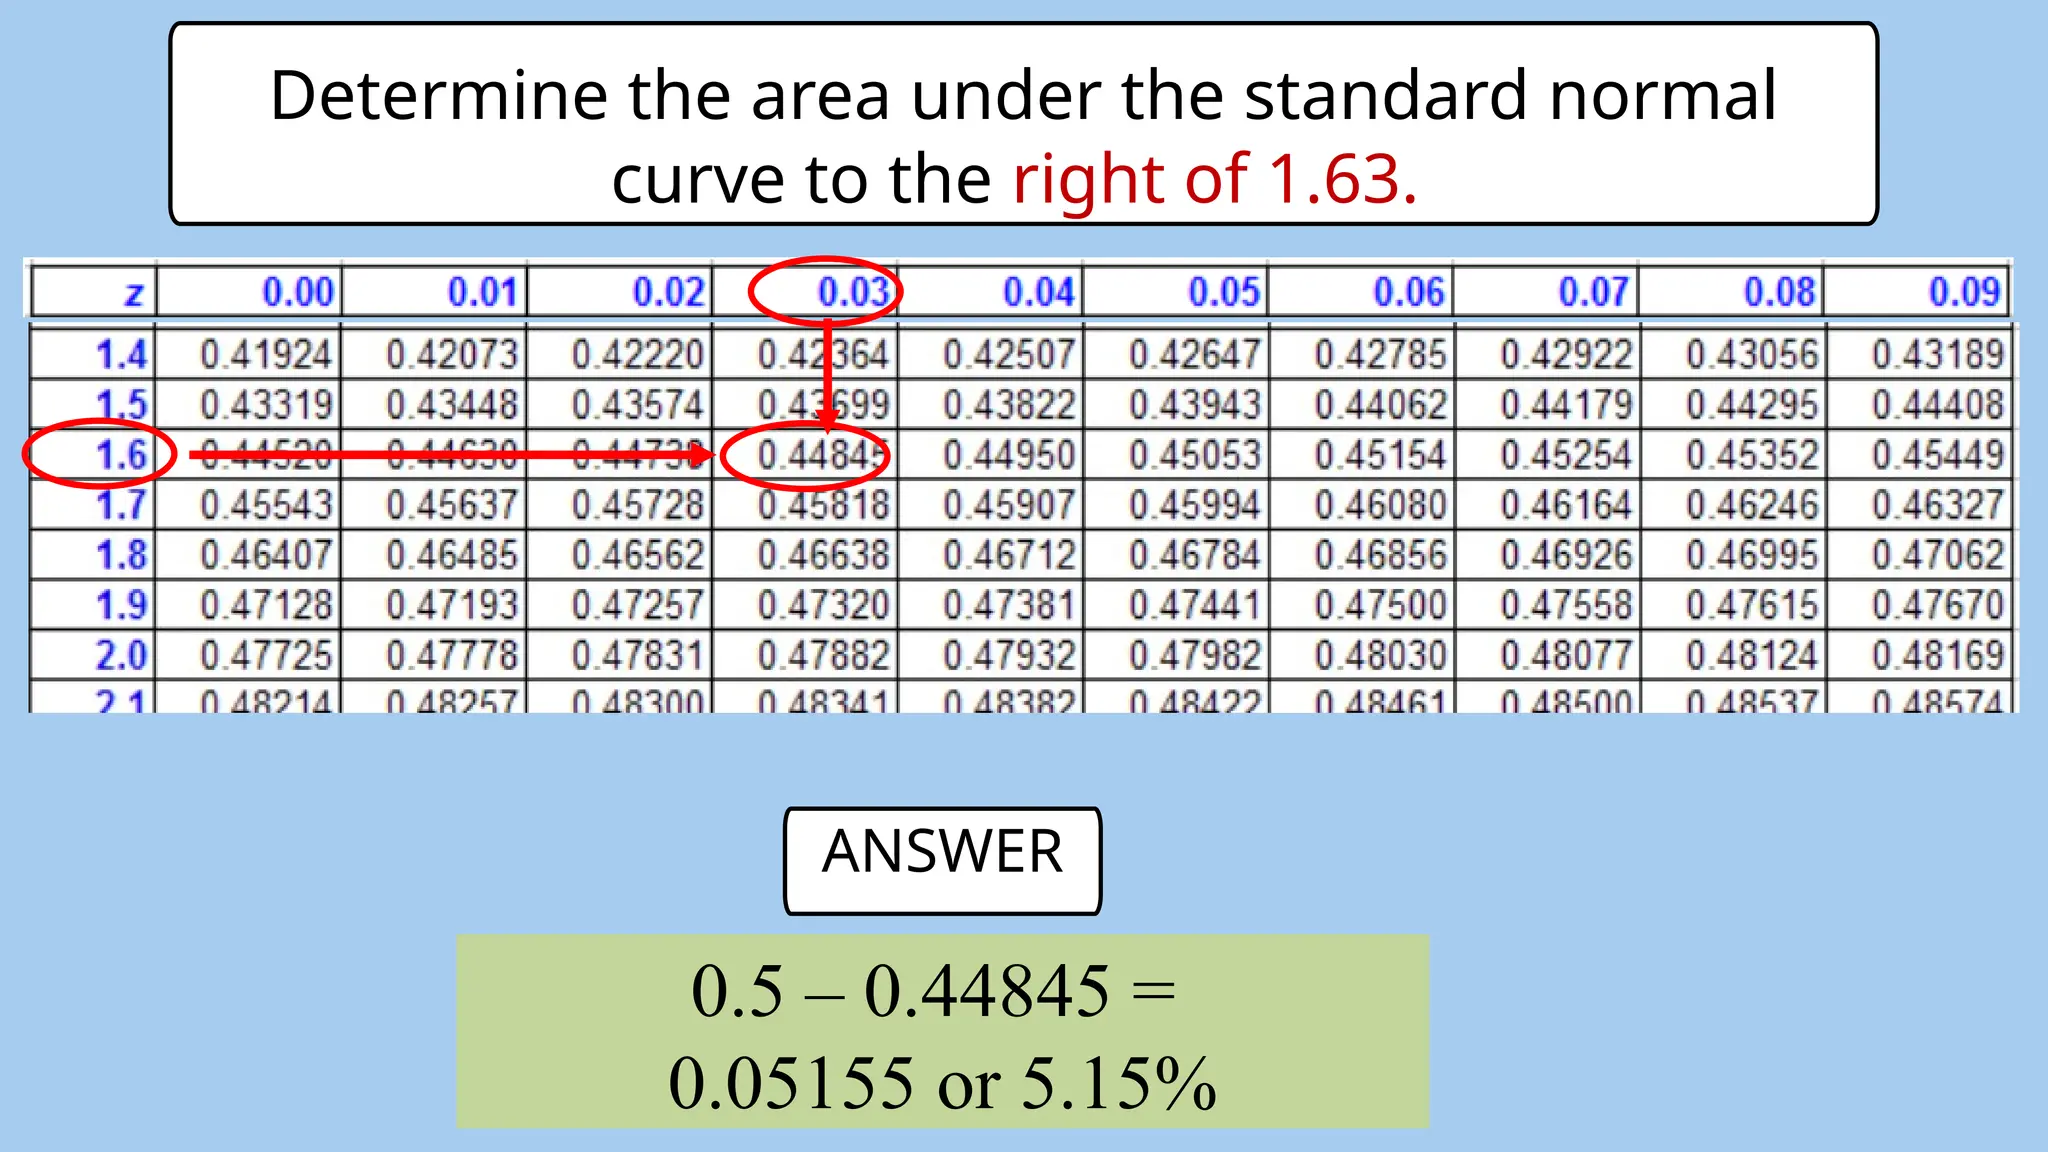
Determine the areaunder the standard normal
curve to the right of 1.63.
STEPS
39.
0.5 – 0.44845=
0.05155 or 5.15%
ANSWER
Determine the area under the standard normal
curve to the right of 1.63.
40.
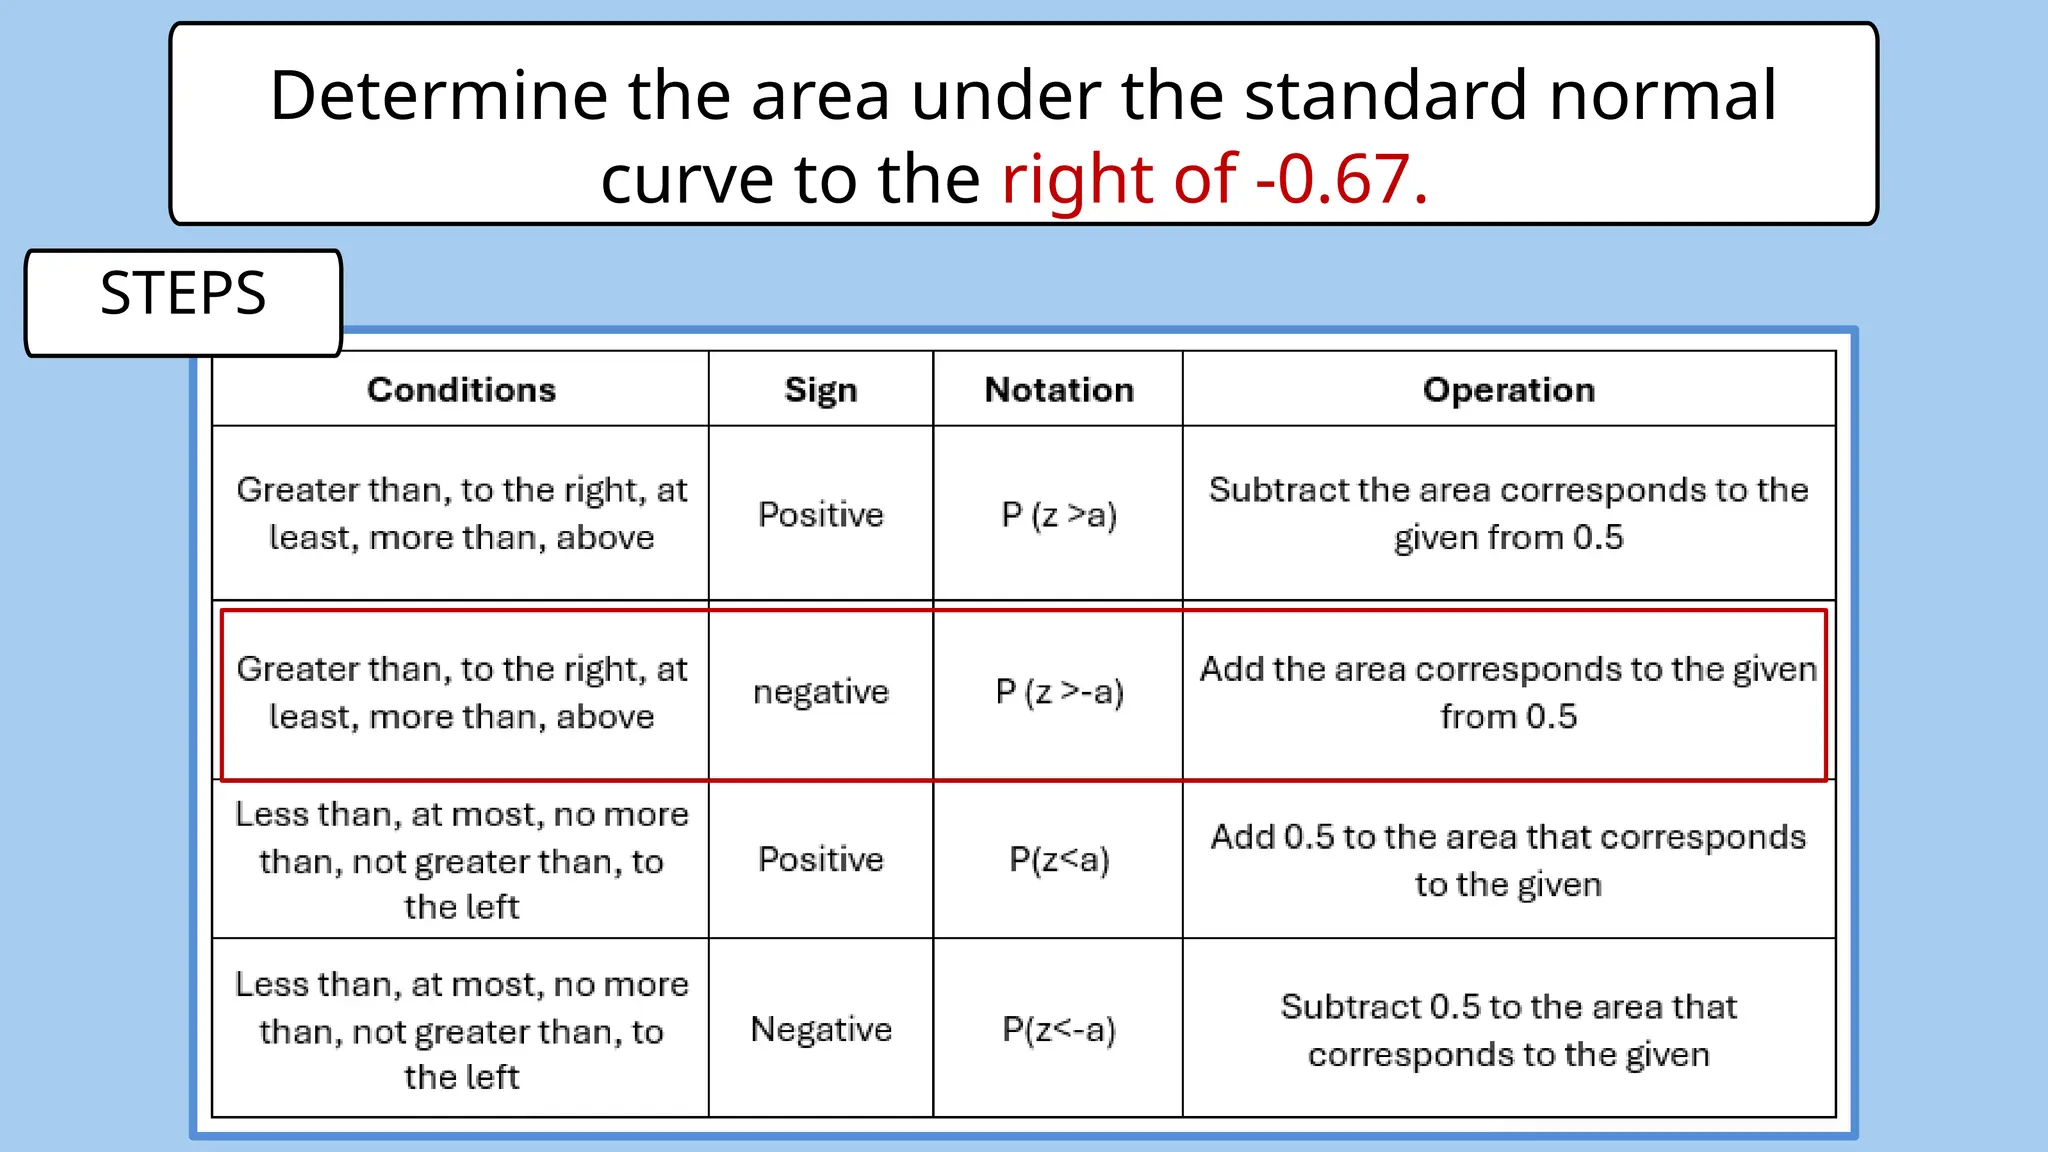
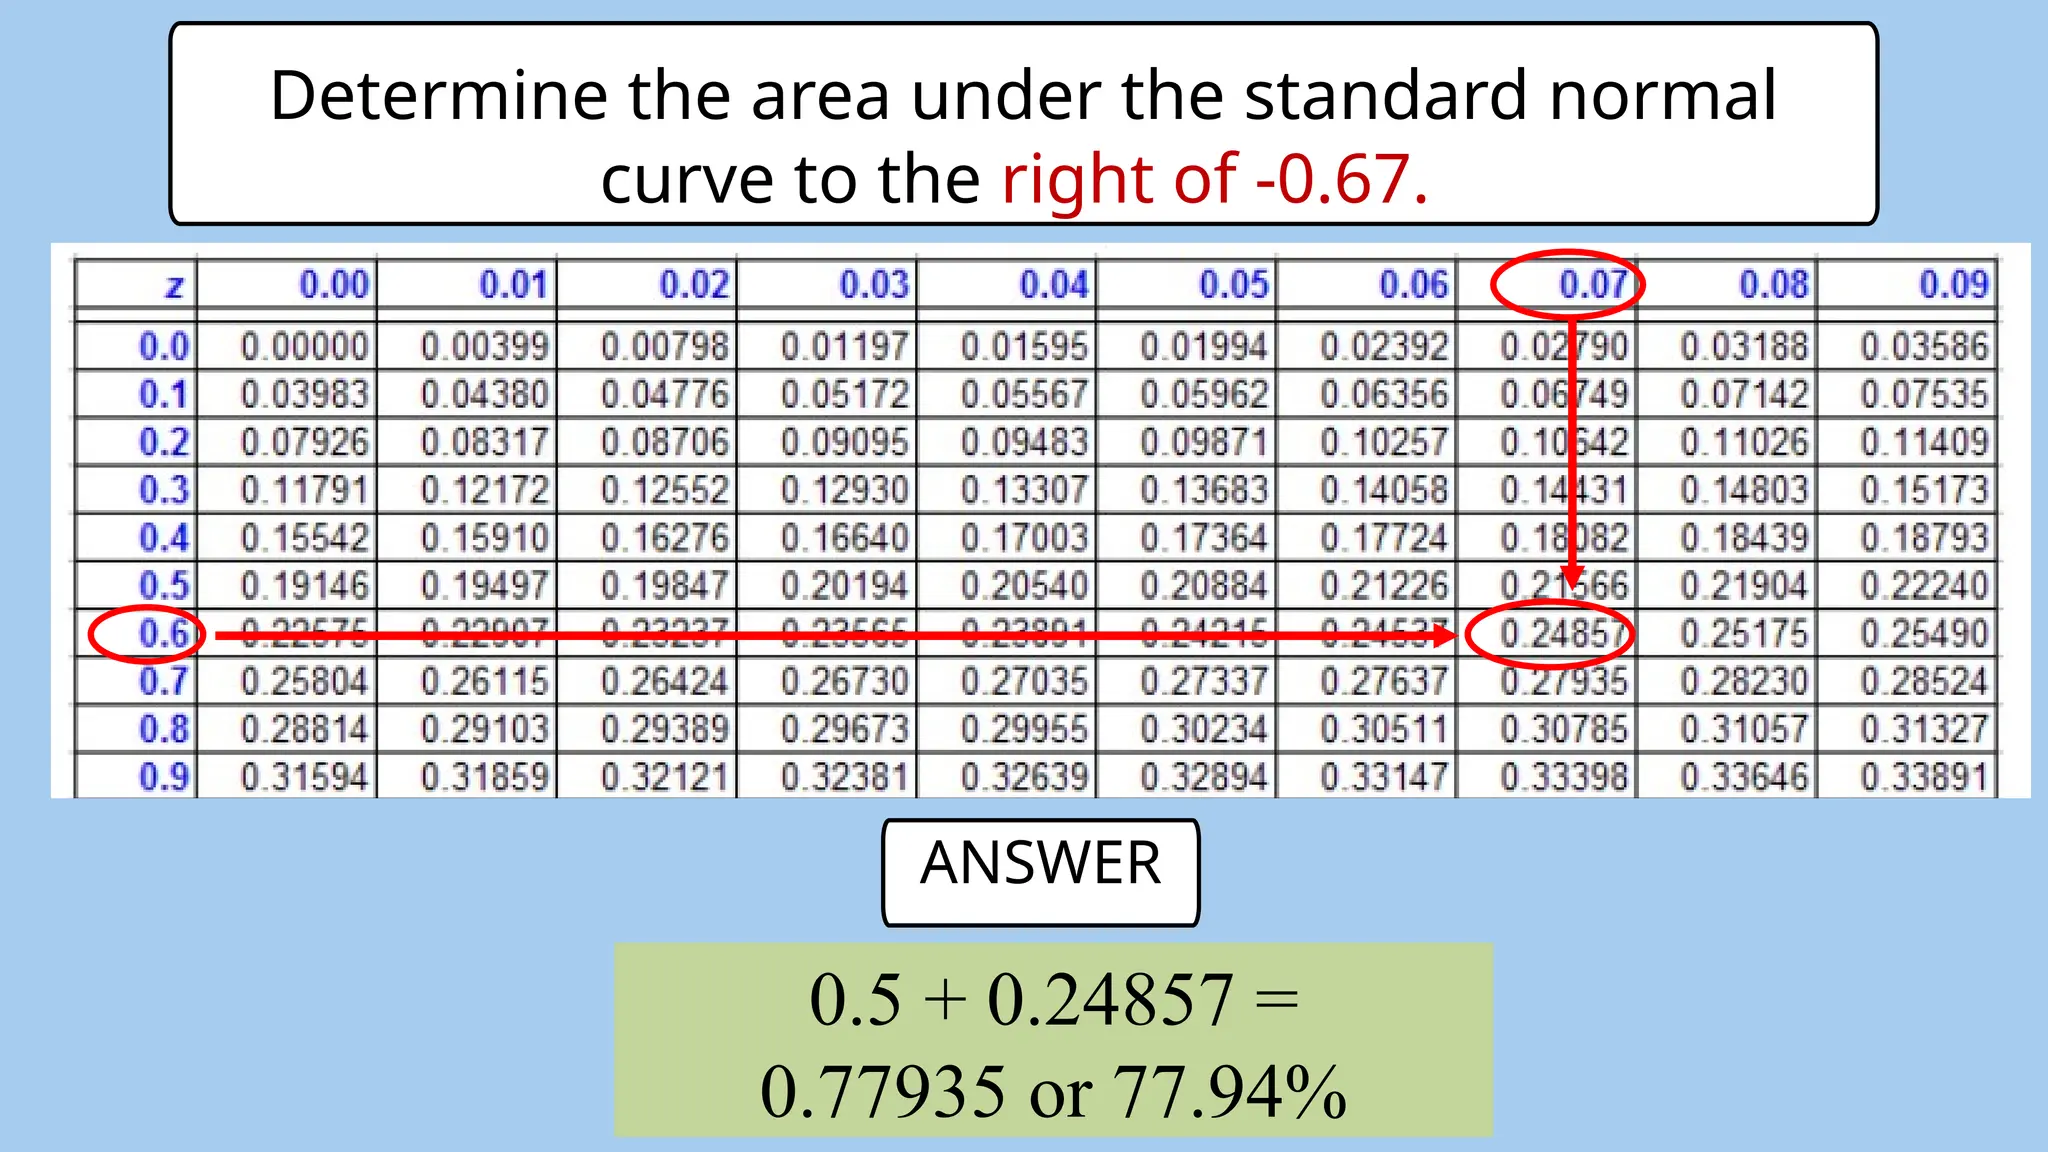
Determine the areaunder the standard normal
curve to the right of -0.67.
STEPS
41.
0.5 + 0.24857=
0.77935 or 77.94%
ANSWER
Determine the area under the standard normal
curve to the right of -0.67.
42.
C O NV E R T I N G T H E V A L U E O F X
I N T O Z - S C O R E S
43.
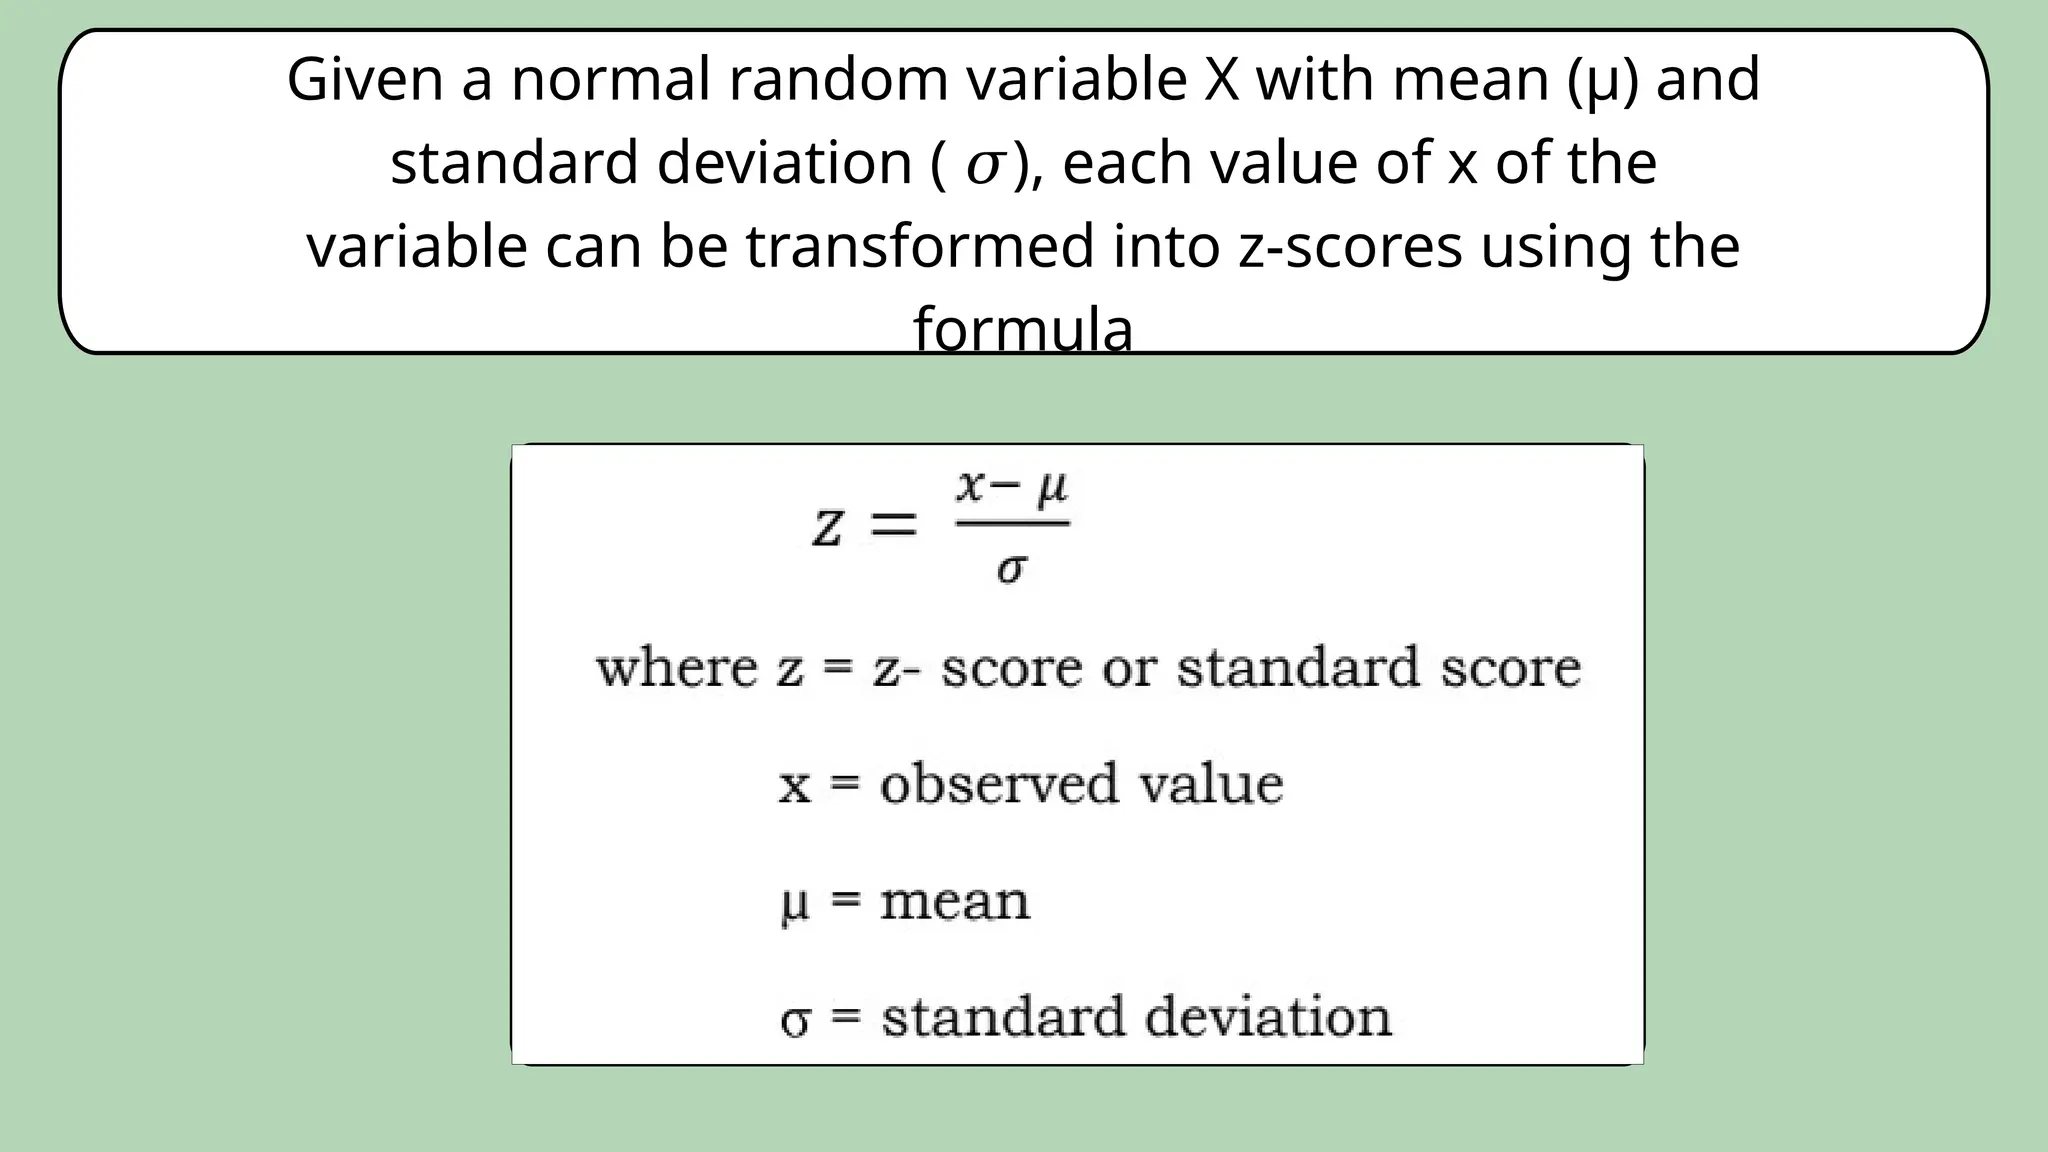
Given a normalrandom variable X with mean (µ) and
standard deviation ( ), each value of x of the
𝜎
variable can be transformed into z-scores using the
formula
44.
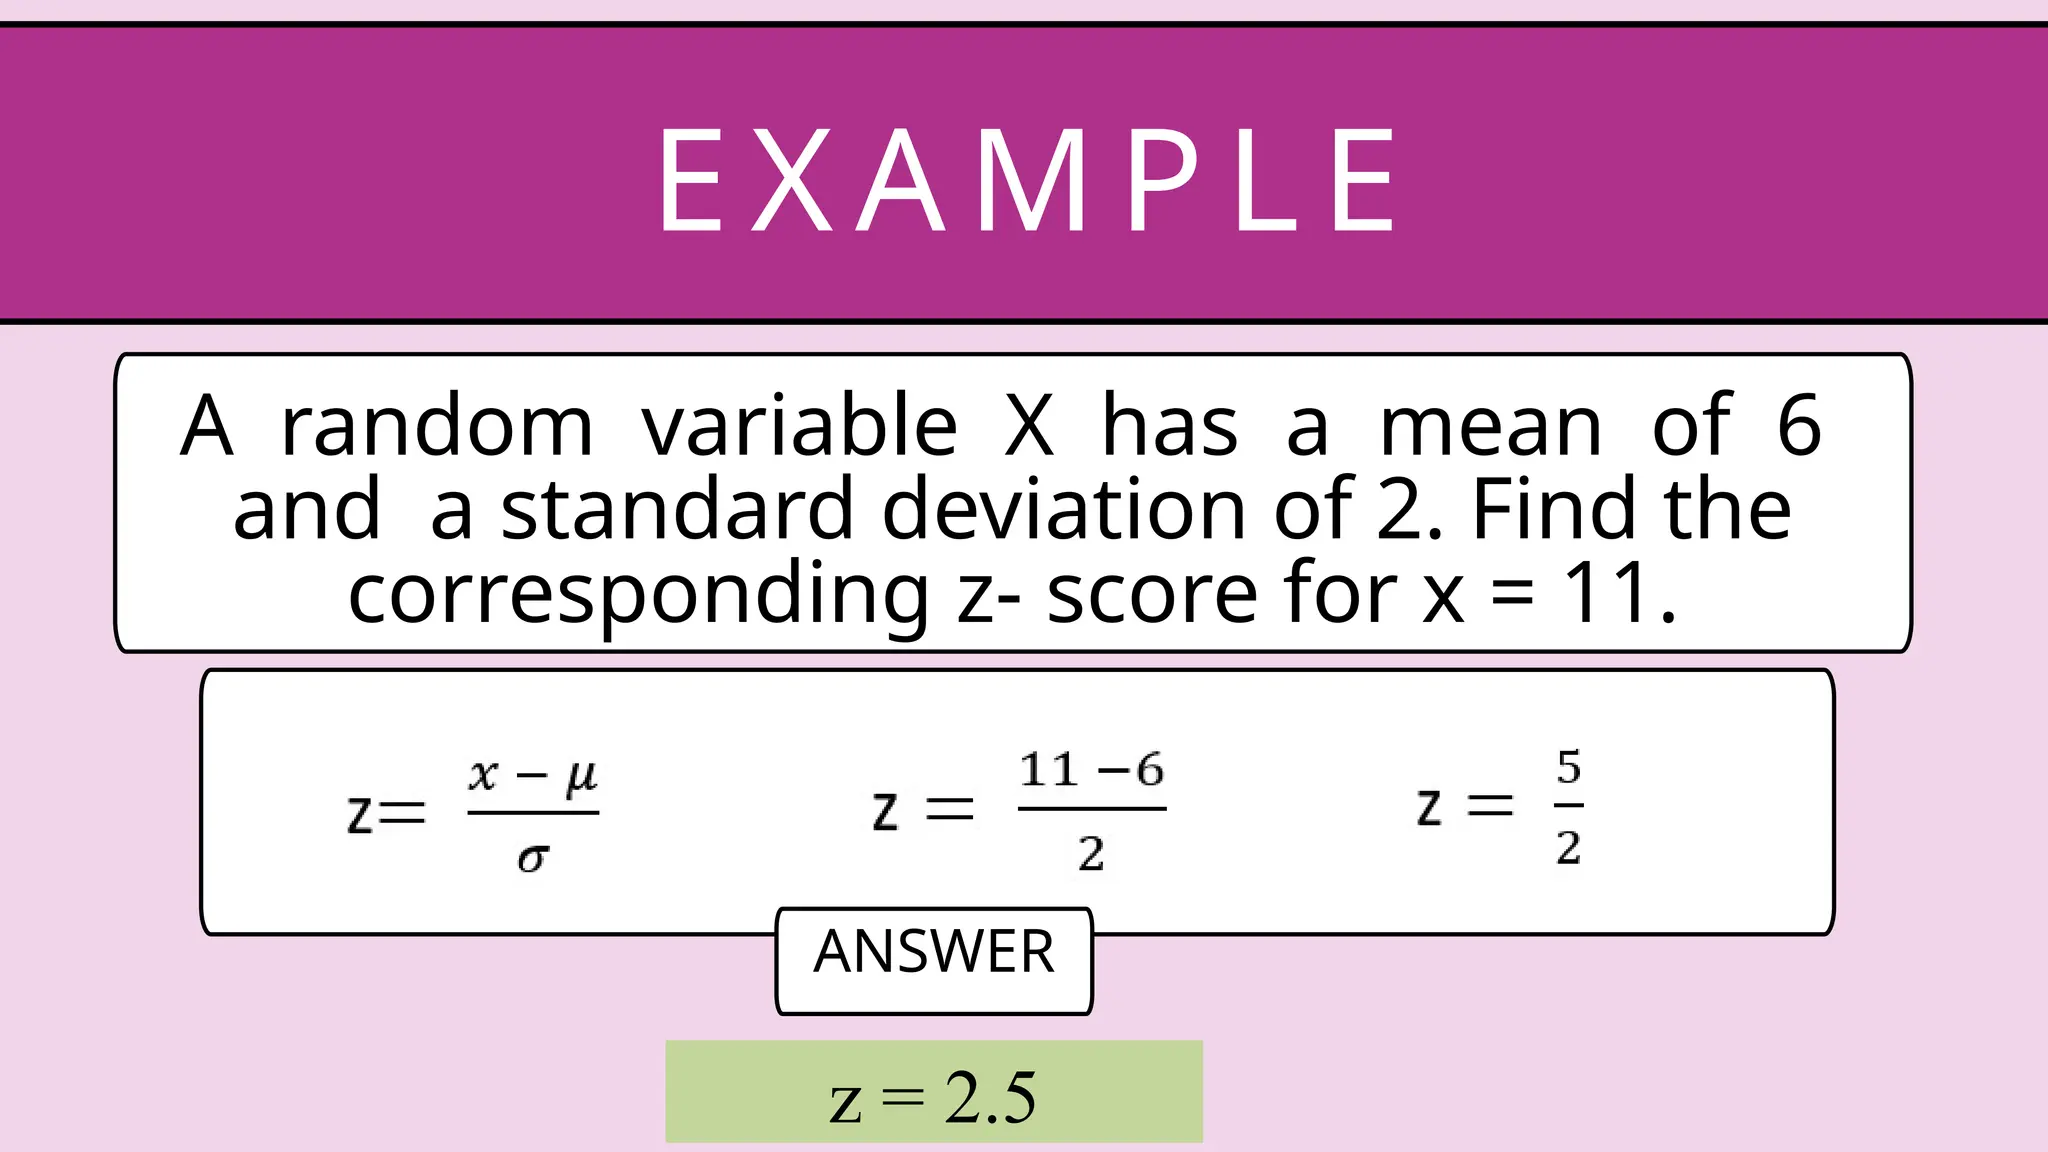
A random variableX has a mean of 6
and a standard deviation of 2. Find the
corresponding z- score for x = 11.
EX AM P LE
ANSWER
z = 2.5
45.
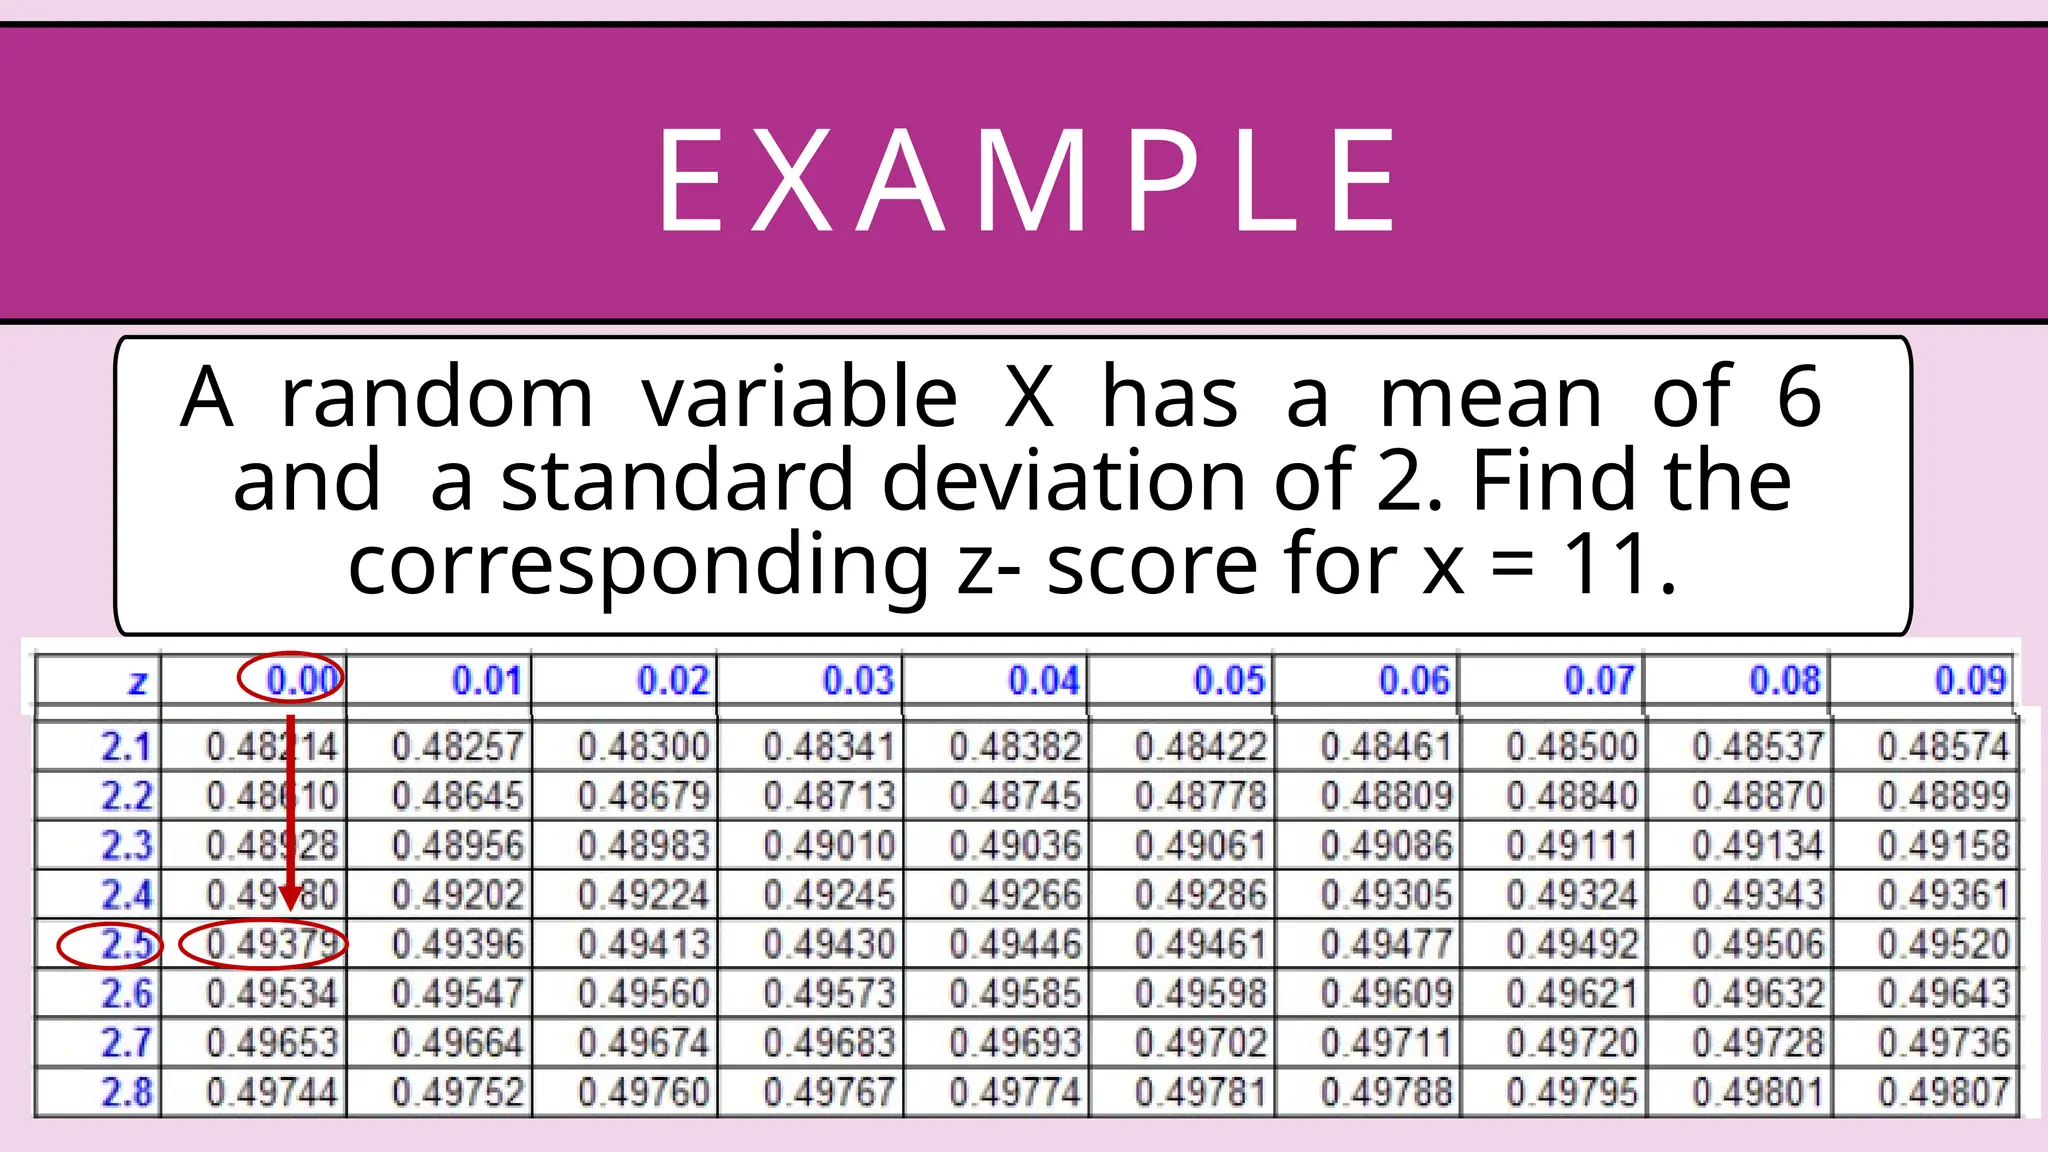
A random variableX has a mean of 6
and a standard deviation of 2. Find the
corresponding z- score for x = 11.
EX AM P LE
46.
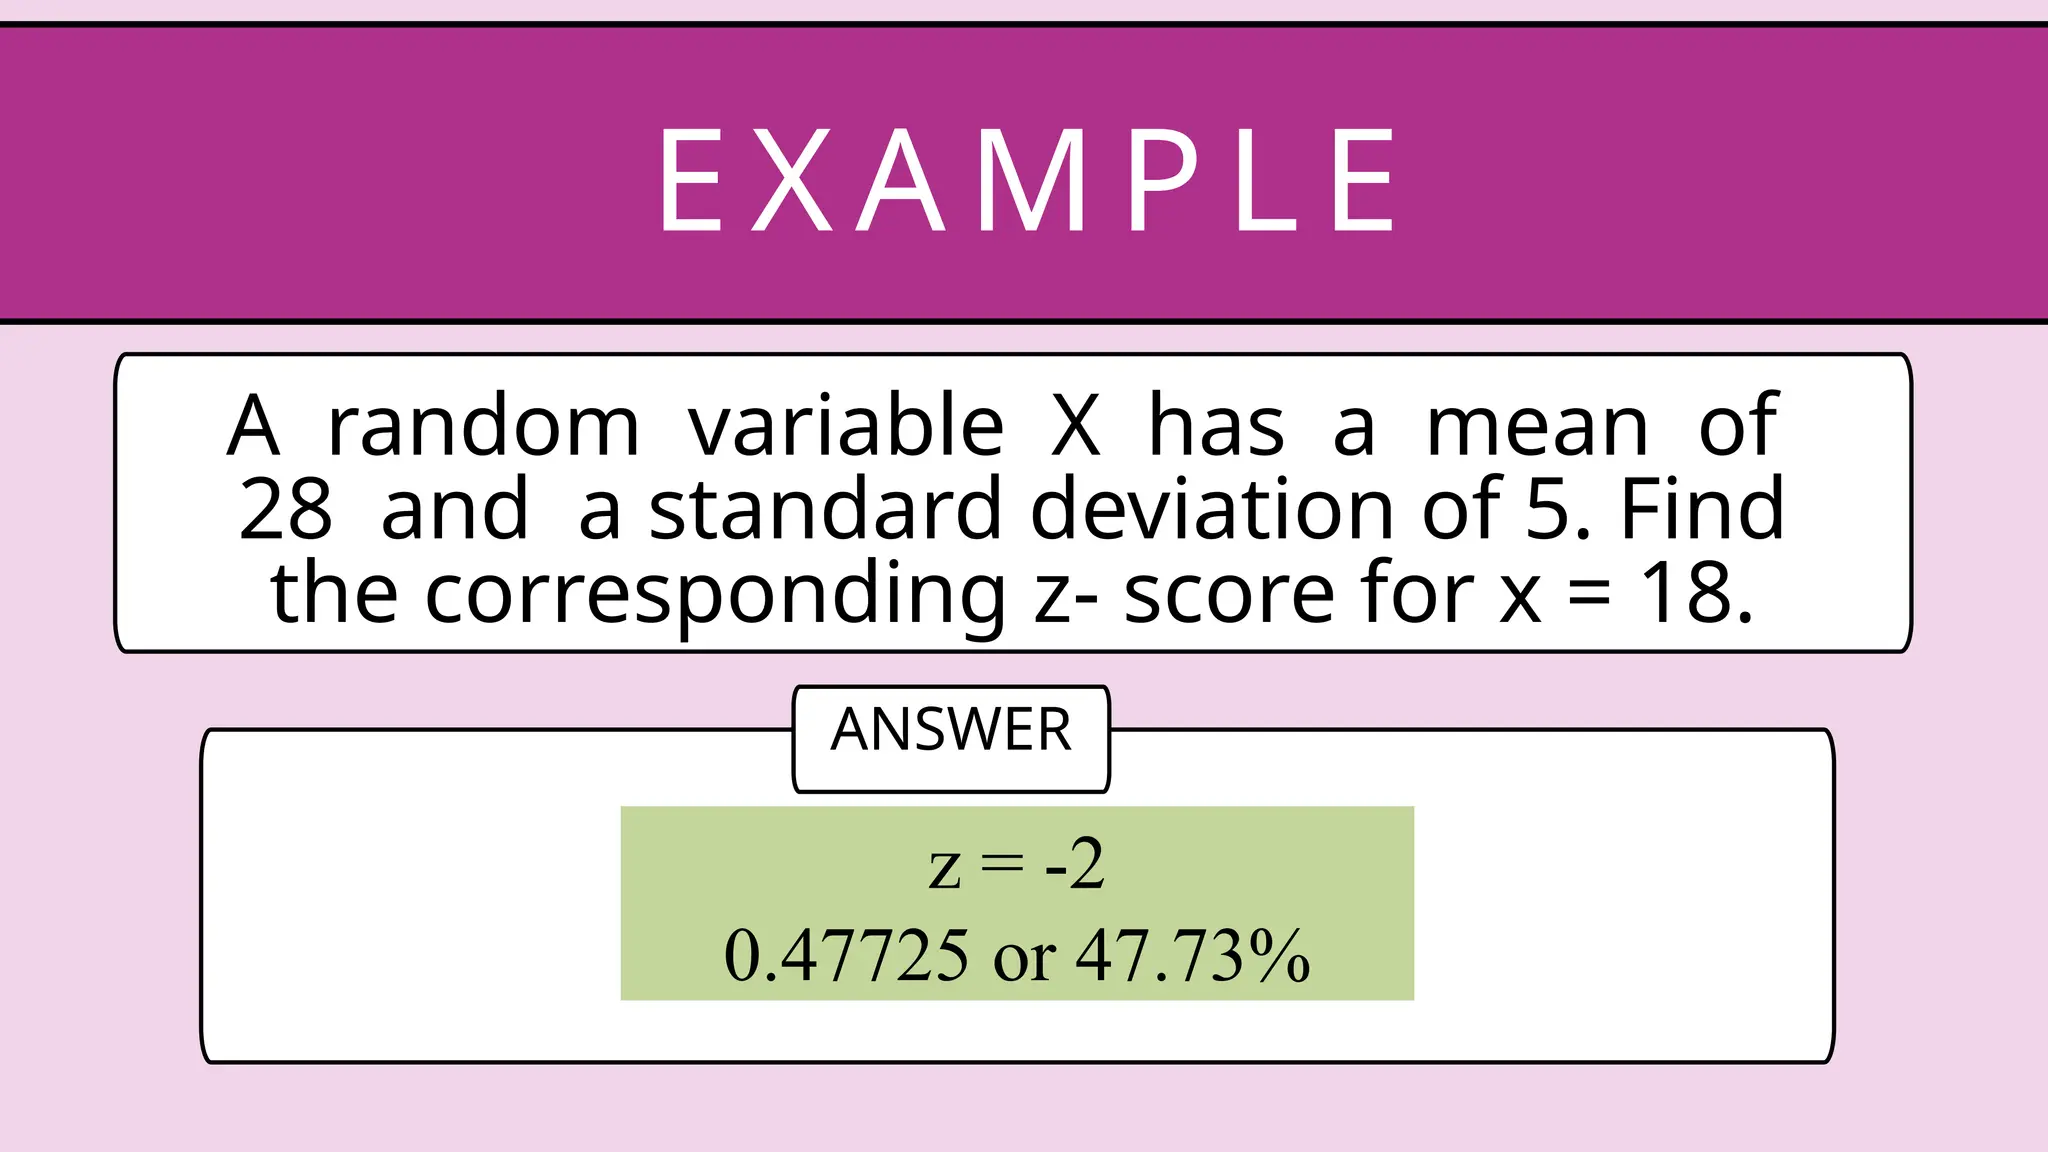
A random variableX has a mean of
28 and a standard deviation of 5. Find
the corresponding z- score for x = 18.
EX AM P LE
ANSWER
z = -2
0.47725 or 47.73%
47.
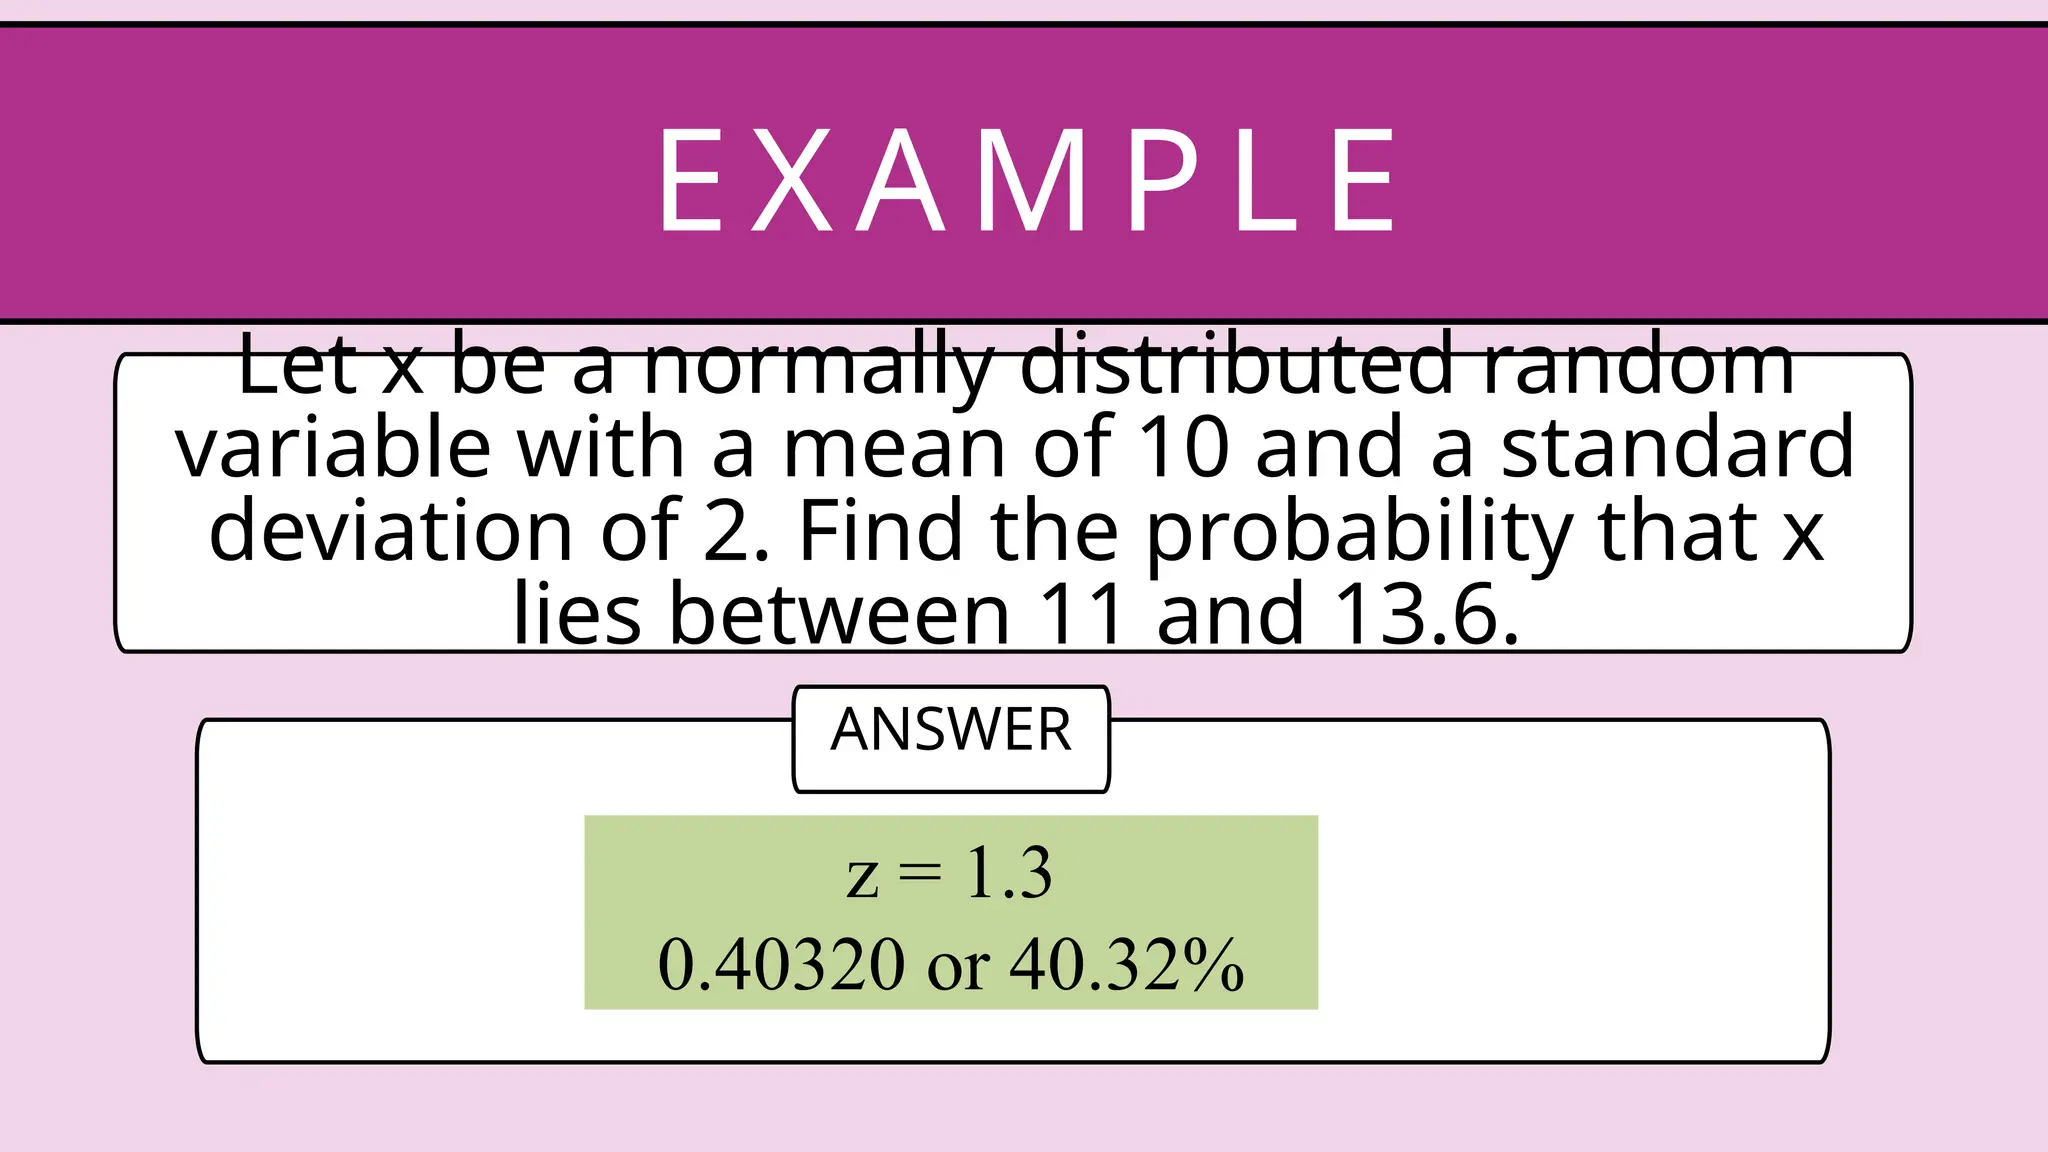
Let x bea normally distributed random
variable with a mean of 10 and a standard
deviation of 2. Find the probability that x
lies between 11 and 13.6.
EX AM P LE
ANSWER
z = 1.3
0.40320 or 40.32%
48.
Directions: complete thegiven diagram
below by filling up the necessary details
about the steps in finding the probability
using the standard normal curve and
finding the z - scores
AC T I V I T Y
Work by pairs
49.
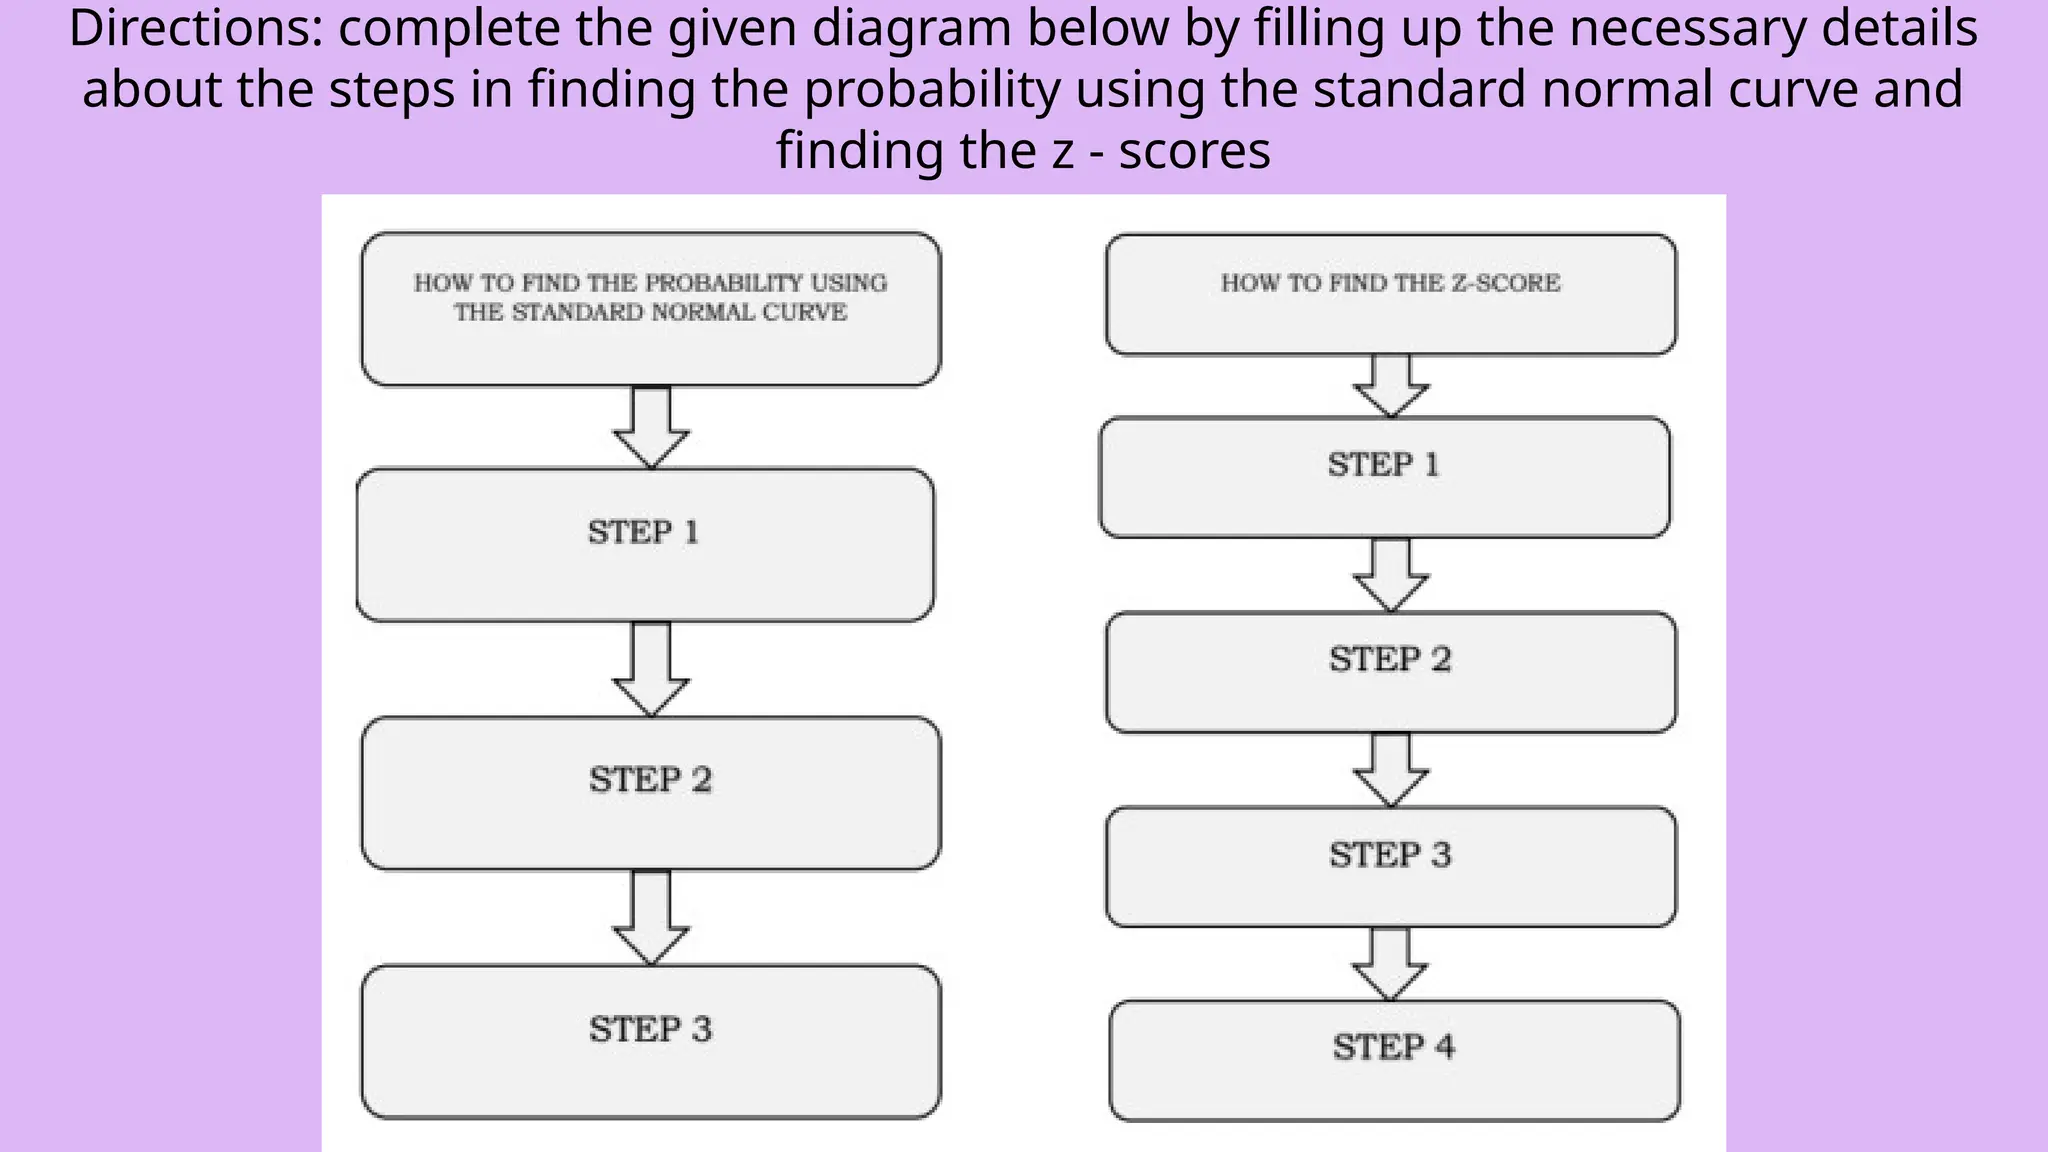
Directions: complete thegiven diagram below by filling up the necessary details
about the steps in finding the probability using the standard normal curve and
finding the z - scores
#29 The z-table is divided into two sections, negative and positive z-scores. Negative z-scores are below the mean, while positive z-scores are above the mean. Row and column headers define the z-score while table cells represent the area.