SlideShare a Scribd company logo
Presented by
Dr. R. RAJA, M.E., Ph.D.,
Assistant Professor, Department of EEE,
Muthayammal Engineering College, (Autonomous)
Namakkal (Dt), Rasipuram – 637408
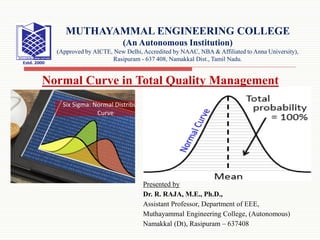
Normal Curve in Total Quality Management
MUTHAYAMMAL ENGINEERING COLLEGE
(An Autonomous Institution)
(Approved by AICTE, New Delhi, Accredited by NAAC, NBA & Affiliated to Anna University),
Rasipuram - 637 408, Namakkal Dist., Tamil Nadu.
Normal Curve
Normal Curve or Normal Distribution (Bell Curve)
What are the properties of the normal distribution?
 The normal distribution is a continuous probability distribution that is symmetrical on
both sides of the mean, so the right side of the center is a mirror image of the left side.
 The area under the normal distribution curve represents probability and the total area
under the curve sums to one.
 Most of the continuous data values in a normal distribution tend to cluster around the
mean, and the further a value is from the mean, the less likely it is to occur. The tails
are asymptotic, which means that they approach but never quite meet the horizon (i.e.
x-axis).
 For a perfectly normal distribution the mean, median and mode will be the same value,
visually represented by the peak of the curve.
11/11/2020 2
Count..
11/11/2020 3
 The normal distribution is often called the bell curve because the graph of its
probability density looks like a bell. It is also known as called Gaussian distribution,
after the German mathematician Carl Gauss who first described it.
Count..
Why is the normal distribution important?
The bell-shaped curve is a common feature of nature and psychology
 The normal distribution is the most important probability distribution in
statistics because many continuous data in nature and psychology displays this
bell-shaped curve when compiled and graphed.
 For example, if we randomly sampled 100 individuals we would expect to see a
normal distribution frequency curve for many continuous variables, such as IQ,
height, weight and blood pressure.
11/11/2020 4
Count..
Parametric significance tests require a normal distribution of the samples' data
points
 The most powerful (parametric) statistical tests used by psychologists require
data to be normally distributed. If the data does not resemble a bell curve
researchers may have to use a less powerful type of statistical test, called non-
parametric statistics.
Converting the raw scores of a normal distribution to z-scores
 We can standardized the values (raw scores) of a normal distribution by
converting them into z-scores.
 This procedure allows researchers to determine the proportion of the values that
fall within a specified number of standard deviations from the mean (i.e.
calculate the empirical rule).
11/11/2020 5
Count..
Probability and the normal curve: What is the empirical rule formula?
 The empirical rule in statistics allows researchers to determine the proportion of
values that fall within certain distances from the mean. The empirical rule is
often referred to as the three-sigma rule or the 68-95-99.7 rule.
11/11/2020 6
Count..
 If the data values in a normal distribution are converted to z-scores in a standard
normal distribution the empirical rule describes the percentage of the data that
fall within specific numbers of standard deviations (σ) from the mean (μ) for
bell-shaped curves.
 The empirical rule allows researchers to calculate the probability of randomly
obtaining a score from a normal distribution.
11/11/2020 7
Count..
11/11/2020 8
 68% of data falls within the first standard deviation from the mean. This means
there is a 68% probability of randomly selecting a score between -1 and +1
standard deviations from the mean.
Count..
11/11/2020 9
 95% of the values fall within two standard deviations from the mean. This means
there is a 95% probability of randomly selecting a score between -2 and +2
standard deviations from the mean.
Count..
 99.7% of data will fall within three standard deviations from the mean. This
means there is a 99.7% probability of randomly selecting a score between -3
and +3 standard deviations from the mean.
11/11/2020 10
Count..
How can I check if my data follows a normal distribution?
 Statistical software (such as SPSS) can be used to check if your dataset is
normally distributed by calculating the three measures of central tendency.
 If the mean, median and mode are very similar values there is a good chance
that the data follows a bell-shaped distribution (SPSS command here).
 It is also advisable to a frequency graph too, so you can check the visual shape
of your data (If your chart is a histogram, you can add a distribution curve using
SPSS: From the menus choose: Elements > Show Distribution Curve).
11/11/2020 11
Count..
11/11/2020 12
Count..
 Normal distributions become more apparent (i.e. perfect) the finer the level of
measurement and the larger the sample from a population.
 You can also calculate coefficients which tell us about the size of the
distribution tails in relation to the bump in the middle of the bell curve. For
example, Kolmogorov Smirnov and Shapiro Wilk tests can be calculated using
SPSS.
 These tests compare your data to a normal distribution and provide a p-value,
which if significant (p < .05) indicates your data is different to a normal
distribution (thus, on this occasion we do not want a significant result and need
a p-value higher than 0.05).
11/11/2020 13
Count..
11/11/2020 14
Thank You
11/11/2020 15

More Related Content

What's hot

Operations research-an-introduction
Operations research-an-introductionOperations research-an-introduction
Operations research-an-introductionManoj Bhambu
 
Operations research - an overview
Operations research -  an overviewOperations research -  an overview
Operations research - an overviewJoseph Konnully
 
Reliability Engineering and Terotechnology
Reliability Engineering and TerotechnologyReliability Engineering and Terotechnology
Reliability Engineering and TerotechnologyChristian Enoval
 
Materials Codification and Classification
Materials Codification and ClassificationMaterials Codification and Classification
Materials Codification and ClassificationRushikesh Kolhe
 
Maintenance management
Maintenance managementMaintenance management
Maintenance managementawantika diwan
 
Reliability and Maintenance in production Management
Reliability and Maintenance in production ManagementReliability and Maintenance in production Management
Reliability and Maintenance in production ManagementNazneen sheikh
 
Quality management principles
Quality management principlesQuality management principles
Quality management principlesMohit Singla
 
Introduction to Bill Of Materials
Introduction to Bill Of MaterialsIntroduction to Bill Of Materials
Introduction to Bill Of MaterialsRajat Singla
 
Simulation Techniques
Simulation TechniquesSimulation Techniques
Simulation Techniquesmailrenuka
 
Modelling process quality
Modelling process qualityModelling process quality
Modelling process qualityZenblade 93
 
Applications of simulation in Business with Example
Applications of simulation in Business with ExampleApplications of simulation in Business with Example
Applications of simulation in Business with ExamplePratima Ray
 
Maintenance management
Maintenance managementMaintenance management
Maintenance managementRajeev Sharan
 
Statistical quality control
Statistical quality controlStatistical quality control
Statistical quality controlIrfan Hussain
 
Introduction to Operations Research
Introduction to Operations ResearchIntroduction to Operations Research
Introduction to Operations ResearchAditya Classes
 

What's hot (20)

Queueing theory
Queueing theoryQueueing theory
Queueing theory
 
Operations research-an-introduction
Operations research-an-introductionOperations research-an-introduction
Operations research-an-introduction
 
Operations research - an overview
Operations research -  an overviewOperations research -  an overview
Operations research - an overview
 
Inventory
InventoryInventory
Inventory
 
Reliability Engineering and Terotechnology
Reliability Engineering and TerotechnologyReliability Engineering and Terotechnology
Reliability Engineering and Terotechnology
 
Reliability
ReliabilityReliability
Reliability
 
Queuing theory
Queuing theoryQueuing theory
Queuing theory
 
Materials Codification and Classification
Materials Codification and ClassificationMaterials Codification and Classification
Materials Codification and Classification
 
Maintenance management
Maintenance managementMaintenance management
Maintenance management
 
Reliability and Maintenance in production Management
Reliability and Maintenance in production ManagementReliability and Maintenance in production Management
Reliability and Maintenance in production Management
 
Quality management principles
Quality management principlesQuality management principles
Quality management principles
 
Introduction to Bill Of Materials
Introduction to Bill Of MaterialsIntroduction to Bill Of Materials
Introduction to Bill Of Materials
 
overview of reliability engineering
overview of reliability engineeringoverview of reliability engineering
overview of reliability engineering
 
Simulation Techniques
Simulation TechniquesSimulation Techniques
Simulation Techniques
 
Modelling process quality
Modelling process qualityModelling process quality
Modelling process quality
 
Applications of simulation in Business with Example
Applications of simulation in Business with ExampleApplications of simulation in Business with Example
Applications of simulation in Business with Example
 
Maintenance management
Maintenance managementMaintenance management
Maintenance management
 
Statistical quality control
Statistical quality controlStatistical quality control
Statistical quality control
 
Reliability
ReliabilityReliability
Reliability
 
Introduction to Operations Research
Introduction to Operations ResearchIntroduction to Operations Research
Introduction to Operations Research
 

Similar to Normal Curve in Total Quality Management

Statistics ppt.ppt
Statistics ppt.pptStatistics ppt.ppt
Statistics ppt.pptHeni524956
 
Sampling distribution
Sampling distributionSampling distribution
Sampling distributionswarna dey
 
Edison S Statistics
Edison S StatisticsEdison S Statistics
Edison S Statisticsteresa_soto
 
A review of statistics
A review of statisticsA review of statistics
A review of statisticsedisonre
 
Edisons Statistics
Edisons StatisticsEdisons Statistics
Edisons Statisticsteresa_soto
 
Sampling_Distribution_stat_of_Mean_New.pptx
Sampling_Distribution_stat_of_Mean_New.pptxSampling_Distribution_stat_of_Mean_New.pptx
Sampling_Distribution_stat_of_Mean_New.pptxRajJirel
 
Statistics in research
Statistics in researchStatistics in research
Statistics in researchBalaji P
 
1 descriptive statistics
1 descriptive statistics1 descriptive statistics
1 descriptive statisticsSanu Kumar
 
Normal curve in Biostatistics data inference and applications
Normal curve in Biostatistics data inference and applicationsNormal curve in Biostatistics data inference and applications
Normal curve in Biostatistics data inference and applicationsBala Vidyadhar
 
Statistical Analysis with R -I
Statistical Analysis with R -IStatistical Analysis with R -I
Statistical Analysis with R -IAkhila Prabhakaran
 
Engineering Statistics
Engineering Statistics Engineering Statistics
Engineering Statistics Bahzad5
 

Similar to Normal Curve in Total Quality Management (20)

Statistics ppt.ppt
Statistics ppt.pptStatistics ppt.ppt
Statistics ppt.ppt
 
Data presenatation
Data presenatationData presenatation
Data presenatation
 
Sampling distribution
Sampling distributionSampling distribution
Sampling distribution
 
Edison S Statistics
Edison S StatisticsEdison S Statistics
Edison S Statistics
 
A review of statistics
A review of statisticsA review of statistics
A review of statistics
 
Edisons Statistics
Edisons StatisticsEdisons Statistics
Edisons Statistics
 
Statistics excellent
Statistics excellentStatistics excellent
Statistics excellent
 
Sampling_Distribution_stat_of_Mean_New.pptx
Sampling_Distribution_stat_of_Mean_New.pptxSampling_Distribution_stat_of_Mean_New.pptx
Sampling_Distribution_stat_of_Mean_New.pptx
 
Statistics in research
Statistics in researchStatistics in research
Statistics in research
 
Basic statistics
Basic statisticsBasic statistics
Basic statistics
 
1 descriptive statistics
1 descriptive statistics1 descriptive statistics
1 descriptive statistics
 
Normal curve in Biostatistics data inference and applications
Normal curve in Biostatistics data inference and applicationsNormal curve in Biostatistics data inference and applications
Normal curve in Biostatistics data inference and applications
 
Statistical Analysis with R -I
Statistical Analysis with R -IStatistical Analysis with R -I
Statistical Analysis with R -I
 
Presentation1
Presentation1Presentation1
Presentation1
 
Descriptive
DescriptiveDescriptive
Descriptive
 
Statistics
StatisticsStatistics
Statistics
 
Statistics
StatisticsStatistics
Statistics
 
template.pptx
template.pptxtemplate.pptx
template.pptx
 
Engineering Statistics
Engineering Statistics Engineering Statistics
Engineering Statistics
 
Statistics
StatisticsStatistics
Statistics
 

More from Dr.Raja R

Advanced Electrical Drive Controls, Types and Implementation”
Advanced Electrical Drive Controls, Types   and Implementation”Advanced Electrical Drive Controls, Types   and Implementation”
Advanced Electrical Drive Controls, Types and Implementation”Dr.Raja R
 
Electrical Drives and Control Heating and Cooling Curves
Electrical Drives and Control Heating and Cooling CurvesElectrical Drives and Control Heating and Cooling Curves
Electrical Drives and Control Heating and Cooling CurvesDr.Raja R
 
Classification of electric drive with advantage and disadvantage
Classification of electric drive with advantage and disadvantageClassification of electric drive with advantage and disadvantage
Classification of electric drive with advantage and disadvantageDr.Raja R
 
Electric Drives and Controls Unit 1 Introduction
Electric Drives and Controls Unit 1 IntroductionElectric Drives and Controls Unit 1 Introduction
Electric Drives and Controls Unit 1 IntroductionDr.Raja R
 
Qualitative study of different renewable energy resources
Qualitative study of different renewable energy resourcesQualitative study of different renewable energy resources
Qualitative study of different renewable energy resourcesDr.Raja R
 
Environmental impacts of renewable energy generation systems (cost ghg emission)
Environmental impacts of renewable energy generation systems (cost ghg emission)Environmental impacts of renewable energy generation systems (cost ghg emission)
Environmental impacts of renewable energy generation systems (cost ghg emission)Dr.Raja R
 
Applications of carbon materials in electrical engineering
Applications of carbon materials in electrical engineeringApplications of carbon materials in electrical engineering
Applications of carbon materials in electrical engineeringDr.Raja R
 
Circuit Theory: Nodes, Branches and Loops of a Circuit
Circuit Theory: Nodes, Branches and Loops of a CircuitCircuit Theory: Nodes, Branches and Loops of a Circuit
Circuit Theory: Nodes, Branches and Loops of a CircuitDr.Raja R
 
High voltage transformers
High voltage transformersHigh voltage transformers
High voltage transformersDr.Raja R
 
Making india non fossil fuel based
Making india non fossil fuel basedMaking india non fossil fuel based
Making india non fossil fuel basedDr.Raja R
 
Stepper motor in industrial applications
Stepper motor in industrial applicationsStepper motor in industrial applications
Stepper motor in industrial applicationsDr.Raja R
 
Advances in Solar Panel Technologies for Efficient Energy Production
Advances in Solar Panel Technologies for  Efficient Energy Production Advances in Solar Panel Technologies for  Efficient Energy Production
Advances in Solar Panel Technologies for Efficient Energy Production Dr.Raja R
 
Introduction to reactive power control in electrical power
Introduction to reactive power control in electrical powerIntroduction to reactive power control in electrical power
Introduction to reactive power control in electrical powerDr.Raja R
 
Basic Difference Between Wires and Cables
Basic Difference Between Wires and CablesBasic Difference Between Wires and Cables
Basic Difference Between Wires and CablesDr.Raja R
 
Residential Electrical Wiring Systems Basics
Residential Electrical Wiring Systems Basics Residential Electrical Wiring Systems Basics
Residential Electrical Wiring Systems Basics Dr.Raja R
 
Renewable energy and sustainable development
Renewable energy and sustainable developmentRenewable energy and sustainable development
Renewable energy and sustainable developmentDr.Raja R
 
NAAC (Criterion-I : Curricular Aspects for Autonomous Engineering Colleges)
NAAC (Criterion-I : Curricular Aspects  for Autonomous Engineering Colleges)NAAC (Criterion-I : Curricular Aspects  for Autonomous Engineering Colleges)
NAAC (Criterion-I : Curricular Aspects for Autonomous Engineering Colleges)Dr.Raja R
 
Benchmarking in Total Quality Management
Benchmarking in Total Quality ManagementBenchmarking in Total Quality Management
Benchmarking in Total Quality ManagementDr.Raja R
 
Types of Benchmarking in Total Quality Management
Types of Benchmarking in Total Quality ManagementTypes of Benchmarking in Total Quality Management
Types of Benchmarking in Total Quality ManagementDr.Raja R
 
Reasons to Benchmark in Total Quality Management
Reasons to Benchmark in Total Quality ManagementReasons to Benchmark in Total Quality Management
Reasons to Benchmark in Total Quality ManagementDr.Raja R
 

More from Dr.Raja R (20)

Advanced Electrical Drive Controls, Types and Implementation”
Advanced Electrical Drive Controls, Types   and Implementation”Advanced Electrical Drive Controls, Types   and Implementation”
Advanced Electrical Drive Controls, Types and Implementation”
 
Electrical Drives and Control Heating and Cooling Curves
Electrical Drives and Control Heating and Cooling CurvesElectrical Drives and Control Heating and Cooling Curves
Electrical Drives and Control Heating and Cooling Curves
 
Classification of electric drive with advantage and disadvantage
Classification of electric drive with advantage and disadvantageClassification of electric drive with advantage and disadvantage
Classification of electric drive with advantage and disadvantage
 
Electric Drives and Controls Unit 1 Introduction
Electric Drives and Controls Unit 1 IntroductionElectric Drives and Controls Unit 1 Introduction
Electric Drives and Controls Unit 1 Introduction
 
Qualitative study of different renewable energy resources
Qualitative study of different renewable energy resourcesQualitative study of different renewable energy resources
Qualitative study of different renewable energy resources
 
Environmental impacts of renewable energy generation systems (cost ghg emission)
Environmental impacts of renewable energy generation systems (cost ghg emission)Environmental impacts of renewable energy generation systems (cost ghg emission)
Environmental impacts of renewable energy generation systems (cost ghg emission)
 
Applications of carbon materials in electrical engineering
Applications of carbon materials in electrical engineeringApplications of carbon materials in electrical engineering
Applications of carbon materials in electrical engineering
 
Circuit Theory: Nodes, Branches and Loops of a Circuit
Circuit Theory: Nodes, Branches and Loops of a CircuitCircuit Theory: Nodes, Branches and Loops of a Circuit
Circuit Theory: Nodes, Branches and Loops of a Circuit
 
High voltage transformers
High voltage transformersHigh voltage transformers
High voltage transformers
 
Making india non fossil fuel based
Making india non fossil fuel basedMaking india non fossil fuel based
Making india non fossil fuel based
 
Stepper motor in industrial applications
Stepper motor in industrial applicationsStepper motor in industrial applications
Stepper motor in industrial applications
 
Advances in Solar Panel Technologies for Efficient Energy Production
Advances in Solar Panel Technologies for  Efficient Energy Production Advances in Solar Panel Technologies for  Efficient Energy Production
Advances in Solar Panel Technologies for Efficient Energy Production
 
Introduction to reactive power control in electrical power
Introduction to reactive power control in electrical powerIntroduction to reactive power control in electrical power
Introduction to reactive power control in electrical power
 
Basic Difference Between Wires and Cables
Basic Difference Between Wires and CablesBasic Difference Between Wires and Cables
Basic Difference Between Wires and Cables
 
Residential Electrical Wiring Systems Basics
Residential Electrical Wiring Systems Basics Residential Electrical Wiring Systems Basics
Residential Electrical Wiring Systems Basics
 
Renewable energy and sustainable development
Renewable energy and sustainable developmentRenewable energy and sustainable development
Renewable energy and sustainable development
 
NAAC (Criterion-I : Curricular Aspects for Autonomous Engineering Colleges)
NAAC (Criterion-I : Curricular Aspects  for Autonomous Engineering Colleges)NAAC (Criterion-I : Curricular Aspects  for Autonomous Engineering Colleges)
NAAC (Criterion-I : Curricular Aspects for Autonomous Engineering Colleges)
 
Benchmarking in Total Quality Management
Benchmarking in Total Quality ManagementBenchmarking in Total Quality Management
Benchmarking in Total Quality Management
 
Types of Benchmarking in Total Quality Management
Types of Benchmarking in Total Quality ManagementTypes of Benchmarking in Total Quality Management
Types of Benchmarking in Total Quality Management
 
Reasons to Benchmark in Total Quality Management
Reasons to Benchmark in Total Quality ManagementReasons to Benchmark in Total Quality Management
Reasons to Benchmark in Total Quality Management
 

Recently uploaded

BRAKING SYSTEM IN INDIAN RAILWAY AutoCAD DRAWING
BRAKING SYSTEM IN INDIAN RAILWAY AutoCAD DRAWINGBRAKING SYSTEM IN INDIAN RAILWAY AutoCAD DRAWING
BRAKING SYSTEM IN INDIAN RAILWAY AutoCAD DRAWINGKOUSTAV SARKAR
 
ASME IX(9) 2007 Full Version .pdf
ASME IX(9)  2007 Full Version       .pdfASME IX(9)  2007 Full Version       .pdf
ASME IX(9) 2007 Full Version .pdfAhmedHussein950959
 
Digital Signal Processing Lecture notes n.pdf
Digital Signal Processing Lecture notes n.pdfDigital Signal Processing Lecture notes n.pdf
Digital Signal Processing Lecture notes n.pdfAbrahamGadissa
 
NO1 Pandit Amil Baba In Bahawalpur, Sargodha, Sialkot, Sheikhupura, Rahim Yar...
NO1 Pandit Amil Baba In Bahawalpur, Sargodha, Sialkot, Sheikhupura, Rahim Yar...NO1 Pandit Amil Baba In Bahawalpur, Sargodha, Sialkot, Sheikhupura, Rahim Yar...
NO1 Pandit Amil Baba In Bahawalpur, Sargodha, Sialkot, Sheikhupura, Rahim Yar...Amil baba
 
Courier management system project report.pdf
Courier management system project report.pdfCourier management system project report.pdf
Courier management system project report.pdfKamal Acharya
 
Laundry management system project report.pdf
Laundry management system project report.pdfLaundry management system project report.pdf
Laundry management system project report.pdfKamal Acharya
 
Introduction to Machine Learning Unit-4 Notes for II-II Mechanical Engineering
Introduction to Machine Learning Unit-4 Notes for II-II Mechanical EngineeringIntroduction to Machine Learning Unit-4 Notes for II-II Mechanical Engineering
Introduction to Machine Learning Unit-4 Notes for II-II Mechanical EngineeringC Sai Kiran
 
Cloud-Computing_CSE311_Computer-Networking CSE GUB BD - Shahidul.pptx
Cloud-Computing_CSE311_Computer-Networking CSE GUB BD - Shahidul.pptxCloud-Computing_CSE311_Computer-Networking CSE GUB BD - Shahidul.pptx
Cloud-Computing_CSE311_Computer-Networking CSE GUB BD - Shahidul.pptxMd. Shahidul Islam Prodhan
 
Construction method of steel structure space frame .pptx
Construction method of steel structure space frame .pptxConstruction method of steel structure space frame .pptx
Construction method of steel structure space frame .pptxwendy cai
 
CFD Simulation of By-pass Flow in a HRSG module by R&R Consult.pptx
CFD Simulation of By-pass Flow in a HRSG module by R&R Consult.pptxCFD Simulation of By-pass Flow in a HRSG module by R&R Consult.pptx
CFD Simulation of By-pass Flow in a HRSG module by R&R Consult.pptxR&R Consult
 
NO1 Pandit Black Magic Removal in Uk kala jadu Specialist kala jadu for Love ...
NO1 Pandit Black Magic Removal in Uk kala jadu Specialist kala jadu for Love ...NO1 Pandit Black Magic Removal in Uk kala jadu Specialist kala jadu for Love ...
NO1 Pandit Black Magic Removal in Uk kala jadu Specialist kala jadu for Love ...Amil baba
 
Event Management System Vb Net Project Report.pdf
Event Management System Vb Net  Project Report.pdfEvent Management System Vb Net  Project Report.pdf
Event Management System Vb Net Project Report.pdfKamal Acharya
 
Top 13 Famous Civil Engineering Scientist
Top 13 Famous Civil Engineering ScientistTop 13 Famous Civil Engineering Scientist
Top 13 Famous Civil Engineering Scientistgettygaming1
 
retail automation billing system ppt.pptx
retail automation billing system ppt.pptxretail automation billing system ppt.pptx
retail automation billing system ppt.pptxfaamieahmd
 
2024 DevOps Pro Europe - Growing at the edge
2024 DevOps Pro Europe - Growing at the edge2024 DevOps Pro Europe - Growing at the edge
2024 DevOps Pro Europe - Growing at the edgePaco Orozco
 
Online resume builder management system project report.pdf
Online resume builder management system project report.pdfOnline resume builder management system project report.pdf
Online resume builder management system project report.pdfKamal Acharya
 
Introduction to Casting Processes in Manufacturing
Introduction to Casting Processes in ManufacturingIntroduction to Casting Processes in Manufacturing
Introduction to Casting Processes in Manufacturingssuser0811ec
 
shape functions of 1D and 2 D rectangular elements.pptx
shape functions of 1D and 2 D rectangular elements.pptxshape functions of 1D and 2 D rectangular elements.pptx
shape functions of 1D and 2 D rectangular elements.pptxVishalDeshpande27
 
Halogenation process of chemical process industries
Halogenation process of chemical process industriesHalogenation process of chemical process industries
Halogenation process of chemical process industriesMuhammadTufail242431
 
A case study of cinema management system project report..pdf
A case study of cinema management system project report..pdfA case study of cinema management system project report..pdf
A case study of cinema management system project report..pdfKamal Acharya
 

Recently uploaded (20)

BRAKING SYSTEM IN INDIAN RAILWAY AutoCAD DRAWING
BRAKING SYSTEM IN INDIAN RAILWAY AutoCAD DRAWINGBRAKING SYSTEM IN INDIAN RAILWAY AutoCAD DRAWING
BRAKING SYSTEM IN INDIAN RAILWAY AutoCAD DRAWING
 
ASME IX(9) 2007 Full Version .pdf
ASME IX(9)  2007 Full Version       .pdfASME IX(9)  2007 Full Version       .pdf
ASME IX(9) 2007 Full Version .pdf
 
Digital Signal Processing Lecture notes n.pdf
Digital Signal Processing Lecture notes n.pdfDigital Signal Processing Lecture notes n.pdf
Digital Signal Processing Lecture notes n.pdf
 
NO1 Pandit Amil Baba In Bahawalpur, Sargodha, Sialkot, Sheikhupura, Rahim Yar...
NO1 Pandit Amil Baba In Bahawalpur, Sargodha, Sialkot, Sheikhupura, Rahim Yar...NO1 Pandit Amil Baba In Bahawalpur, Sargodha, Sialkot, Sheikhupura, Rahim Yar...
NO1 Pandit Amil Baba In Bahawalpur, Sargodha, Sialkot, Sheikhupura, Rahim Yar...
 
Courier management system project report.pdf
Courier management system project report.pdfCourier management system project report.pdf
Courier management system project report.pdf
 
Laundry management system project report.pdf
Laundry management system project report.pdfLaundry management system project report.pdf
Laundry management system project report.pdf
 
Introduction to Machine Learning Unit-4 Notes for II-II Mechanical Engineering
Introduction to Machine Learning Unit-4 Notes for II-II Mechanical EngineeringIntroduction to Machine Learning Unit-4 Notes for II-II Mechanical Engineering
Introduction to Machine Learning Unit-4 Notes for II-II Mechanical Engineering
 
Cloud-Computing_CSE311_Computer-Networking CSE GUB BD - Shahidul.pptx
Cloud-Computing_CSE311_Computer-Networking CSE GUB BD - Shahidul.pptxCloud-Computing_CSE311_Computer-Networking CSE GUB BD - Shahidul.pptx
Cloud-Computing_CSE311_Computer-Networking CSE GUB BD - Shahidul.pptx
 
Construction method of steel structure space frame .pptx
Construction method of steel structure space frame .pptxConstruction method of steel structure space frame .pptx
Construction method of steel structure space frame .pptx
 
CFD Simulation of By-pass Flow in a HRSG module by R&R Consult.pptx
CFD Simulation of By-pass Flow in a HRSG module by R&R Consult.pptxCFD Simulation of By-pass Flow in a HRSG module by R&R Consult.pptx
CFD Simulation of By-pass Flow in a HRSG module by R&R Consult.pptx
 
NO1 Pandit Black Magic Removal in Uk kala jadu Specialist kala jadu for Love ...
NO1 Pandit Black Magic Removal in Uk kala jadu Specialist kala jadu for Love ...NO1 Pandit Black Magic Removal in Uk kala jadu Specialist kala jadu for Love ...
NO1 Pandit Black Magic Removal in Uk kala jadu Specialist kala jadu for Love ...
 
Event Management System Vb Net Project Report.pdf
Event Management System Vb Net  Project Report.pdfEvent Management System Vb Net  Project Report.pdf
Event Management System Vb Net Project Report.pdf
 
Top 13 Famous Civil Engineering Scientist
Top 13 Famous Civil Engineering ScientistTop 13 Famous Civil Engineering Scientist
Top 13 Famous Civil Engineering Scientist
 
retail automation billing system ppt.pptx
retail automation billing system ppt.pptxretail automation billing system ppt.pptx
retail automation billing system ppt.pptx
 
2024 DevOps Pro Europe - Growing at the edge
2024 DevOps Pro Europe - Growing at the edge2024 DevOps Pro Europe - Growing at the edge
2024 DevOps Pro Europe - Growing at the edge
 
Online resume builder management system project report.pdf
Online resume builder management system project report.pdfOnline resume builder management system project report.pdf
Online resume builder management system project report.pdf
 
Introduction to Casting Processes in Manufacturing
Introduction to Casting Processes in ManufacturingIntroduction to Casting Processes in Manufacturing
Introduction to Casting Processes in Manufacturing
 
shape functions of 1D and 2 D rectangular elements.pptx
shape functions of 1D and 2 D rectangular elements.pptxshape functions of 1D and 2 D rectangular elements.pptx
shape functions of 1D and 2 D rectangular elements.pptx
 
Halogenation process of chemical process industries
Halogenation process of chemical process industriesHalogenation process of chemical process industries
Halogenation process of chemical process industries
 
A case study of cinema management system project report..pdf
A case study of cinema management system project report..pdfA case study of cinema management system project report..pdf
A case study of cinema management system project report..pdf
 

Normal Curve in Total Quality Management

  • 1. Presented by Dr. R. RAJA, M.E., Ph.D., Assistant Professor, Department of EEE, Muthayammal Engineering College, (Autonomous) Namakkal (Dt), Rasipuram – 637408 Normal Curve in Total Quality Management MUTHAYAMMAL ENGINEERING COLLEGE (An Autonomous Institution) (Approved by AICTE, New Delhi, Accredited by NAAC, NBA & Affiliated to Anna University), Rasipuram - 637 408, Namakkal Dist., Tamil Nadu.
  • 2. Normal Curve Normal Curve or Normal Distribution (Bell Curve) What are the properties of the normal distribution?  The normal distribution is a continuous probability distribution that is symmetrical on both sides of the mean, so the right side of the center is a mirror image of the left side.  The area under the normal distribution curve represents probability and the total area under the curve sums to one.  Most of the continuous data values in a normal distribution tend to cluster around the mean, and the further a value is from the mean, the less likely it is to occur. The tails are asymptotic, which means that they approach but never quite meet the horizon (i.e. x-axis).  For a perfectly normal distribution the mean, median and mode will be the same value, visually represented by the peak of the curve. 11/11/2020 2
  • 3. Count.. 11/11/2020 3  The normal distribution is often called the bell curve because the graph of its probability density looks like a bell. It is also known as called Gaussian distribution, after the German mathematician Carl Gauss who first described it.
  • 4. Count.. Why is the normal distribution important? The bell-shaped curve is a common feature of nature and psychology  The normal distribution is the most important probability distribution in statistics because many continuous data in nature and psychology displays this bell-shaped curve when compiled and graphed.  For example, if we randomly sampled 100 individuals we would expect to see a normal distribution frequency curve for many continuous variables, such as IQ, height, weight and blood pressure. 11/11/2020 4
  • 5. Count.. Parametric significance tests require a normal distribution of the samples' data points  The most powerful (parametric) statistical tests used by psychologists require data to be normally distributed. If the data does not resemble a bell curve researchers may have to use a less powerful type of statistical test, called non- parametric statistics. Converting the raw scores of a normal distribution to z-scores  We can standardized the values (raw scores) of a normal distribution by converting them into z-scores.  This procedure allows researchers to determine the proportion of the values that fall within a specified number of standard deviations from the mean (i.e. calculate the empirical rule). 11/11/2020 5
  • 6. Count.. Probability and the normal curve: What is the empirical rule formula?  The empirical rule in statistics allows researchers to determine the proportion of values that fall within certain distances from the mean. The empirical rule is often referred to as the three-sigma rule or the 68-95-99.7 rule. 11/11/2020 6
  • 7. Count..  If the data values in a normal distribution are converted to z-scores in a standard normal distribution the empirical rule describes the percentage of the data that fall within specific numbers of standard deviations (σ) from the mean (μ) for bell-shaped curves.  The empirical rule allows researchers to calculate the probability of randomly obtaining a score from a normal distribution. 11/11/2020 7
  • 8. Count.. 11/11/2020 8  68% of data falls within the first standard deviation from the mean. This means there is a 68% probability of randomly selecting a score between -1 and +1 standard deviations from the mean.
  • 9. Count.. 11/11/2020 9  95% of the values fall within two standard deviations from the mean. This means there is a 95% probability of randomly selecting a score between -2 and +2 standard deviations from the mean.
  • 10. Count..  99.7% of data will fall within three standard deviations from the mean. This means there is a 99.7% probability of randomly selecting a score between -3 and +3 standard deviations from the mean. 11/11/2020 10
  • 11. Count.. How can I check if my data follows a normal distribution?  Statistical software (such as SPSS) can be used to check if your dataset is normally distributed by calculating the three measures of central tendency.  If the mean, median and mode are very similar values there is a good chance that the data follows a bell-shaped distribution (SPSS command here).  It is also advisable to a frequency graph too, so you can check the visual shape of your data (If your chart is a histogram, you can add a distribution curve using SPSS: From the menus choose: Elements > Show Distribution Curve). 11/11/2020 11
  • 13. Count..  Normal distributions become more apparent (i.e. perfect) the finer the level of measurement and the larger the sample from a population.  You can also calculate coefficients which tell us about the size of the distribution tails in relation to the bump in the middle of the bell curve. For example, Kolmogorov Smirnov and Shapiro Wilk tests can be calculated using SPSS.  These tests compare your data to a normal distribution and provide a p-value, which if significant (p < .05) indicates your data is different to a normal distribution (thus, on this occasion we do not want a significant result and need a p-value higher than 0.05). 11/11/2020 13