Downloaded 378 times


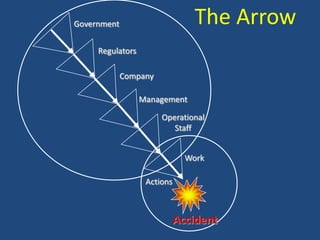


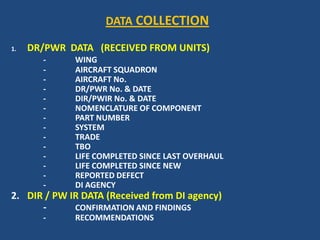

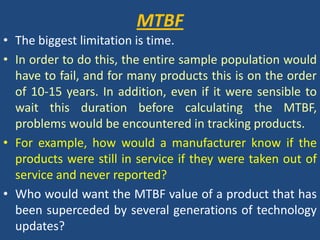
![ReliabilityReliabilityReliability is the ability of a system or component to perform its required functions under stated conditions for a specified period of time [IEEE 90].In other words, it is the likelihood that the system or component will succeed within its identified mission time, with no failures. An aircraft mission is the perfect example to illustrate this concept. When an aircraft takes off for its mission, there is one goal in mind: complete the flight, as intended, safely (with no catastrophic failures).](https://image.slidesharecdn.com/reliabilityrev-12709624406094-phpapp02/85/Reliability-21-320.jpg)

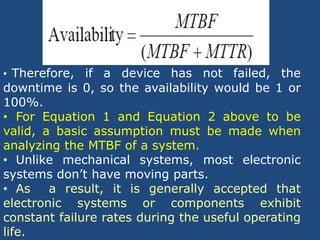
![AvailabilityAvailability, on the other hand, is the degree to which a system or component is operational and accessible when required for use [IEEE 90].Availability is often looked at because, when a failure does occur, the critical variable now becomes how quickly the system can be recovered.](https://image.slidesharecdn.com/reliabilityrev-12709624406094-phpapp02/85/Reliability-39-320.jpg)
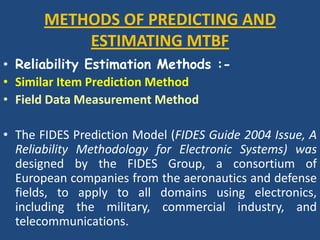


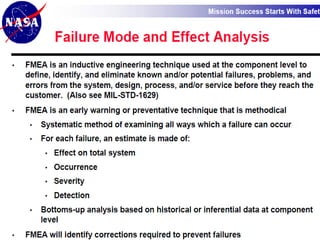
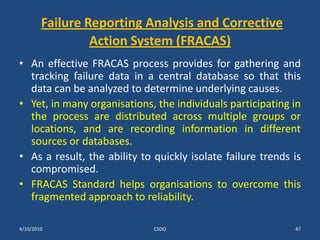
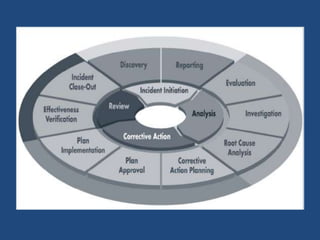


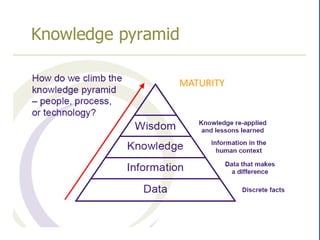
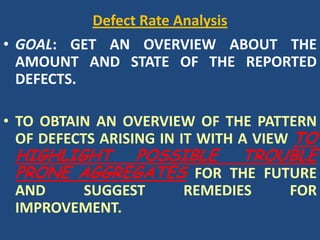
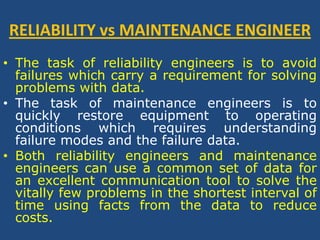
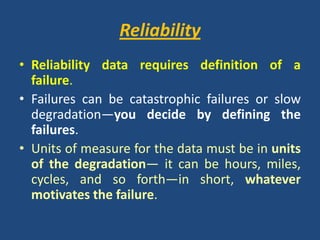
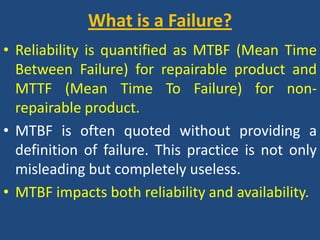
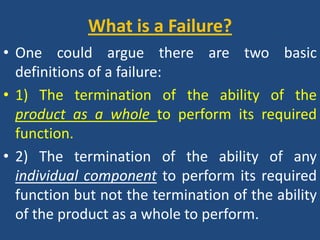
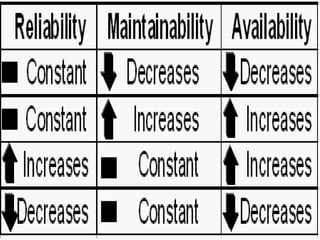
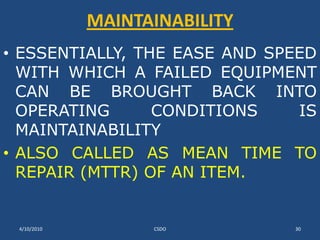
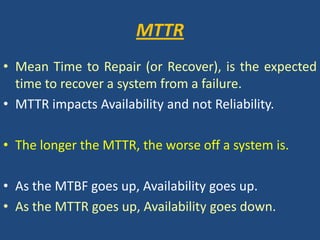
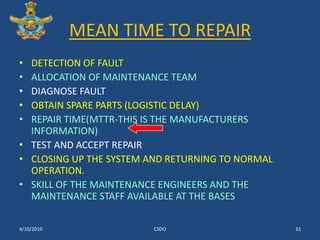
The document discusses reliability management and the integration of data collection to analyze defects in operational systems, highlighting the role of engineers in understanding and utilizing reliability data to prevent failures. It emphasizes the definitions of reliability, maintainability, and failure metrics, including mean time between failure (MTBF) and mean time to repair (MTTR), as critical indicators of system performance. Additionally, it advocates for a standardized approach to failure reporting and corrective action to improve organizational reliability practices.