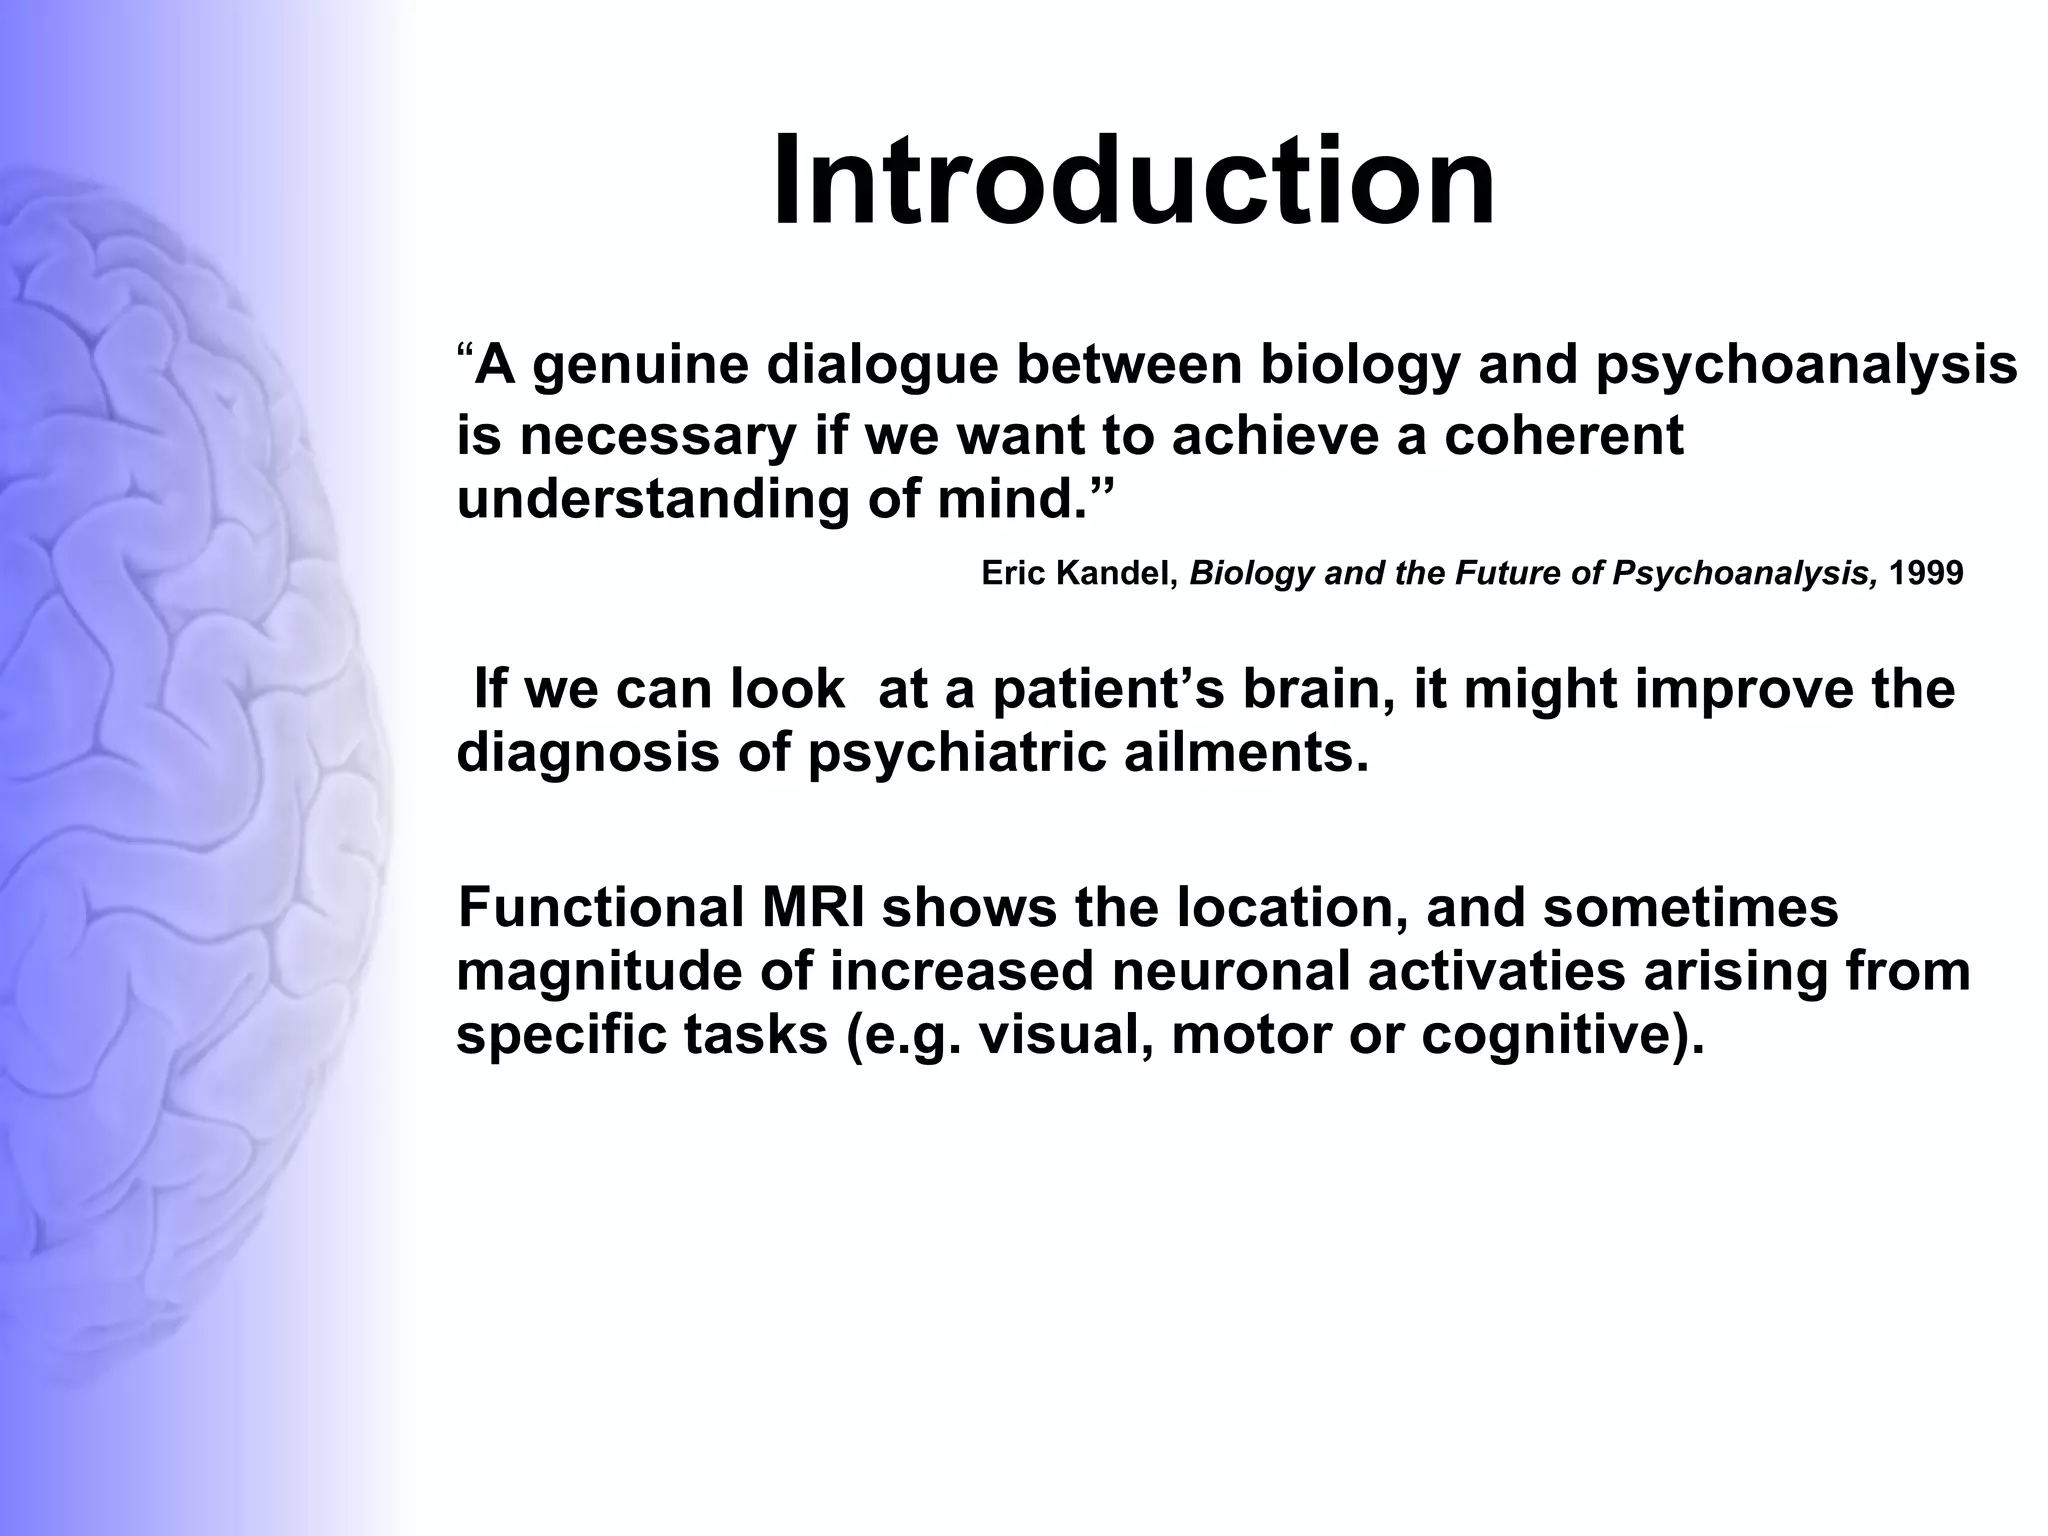
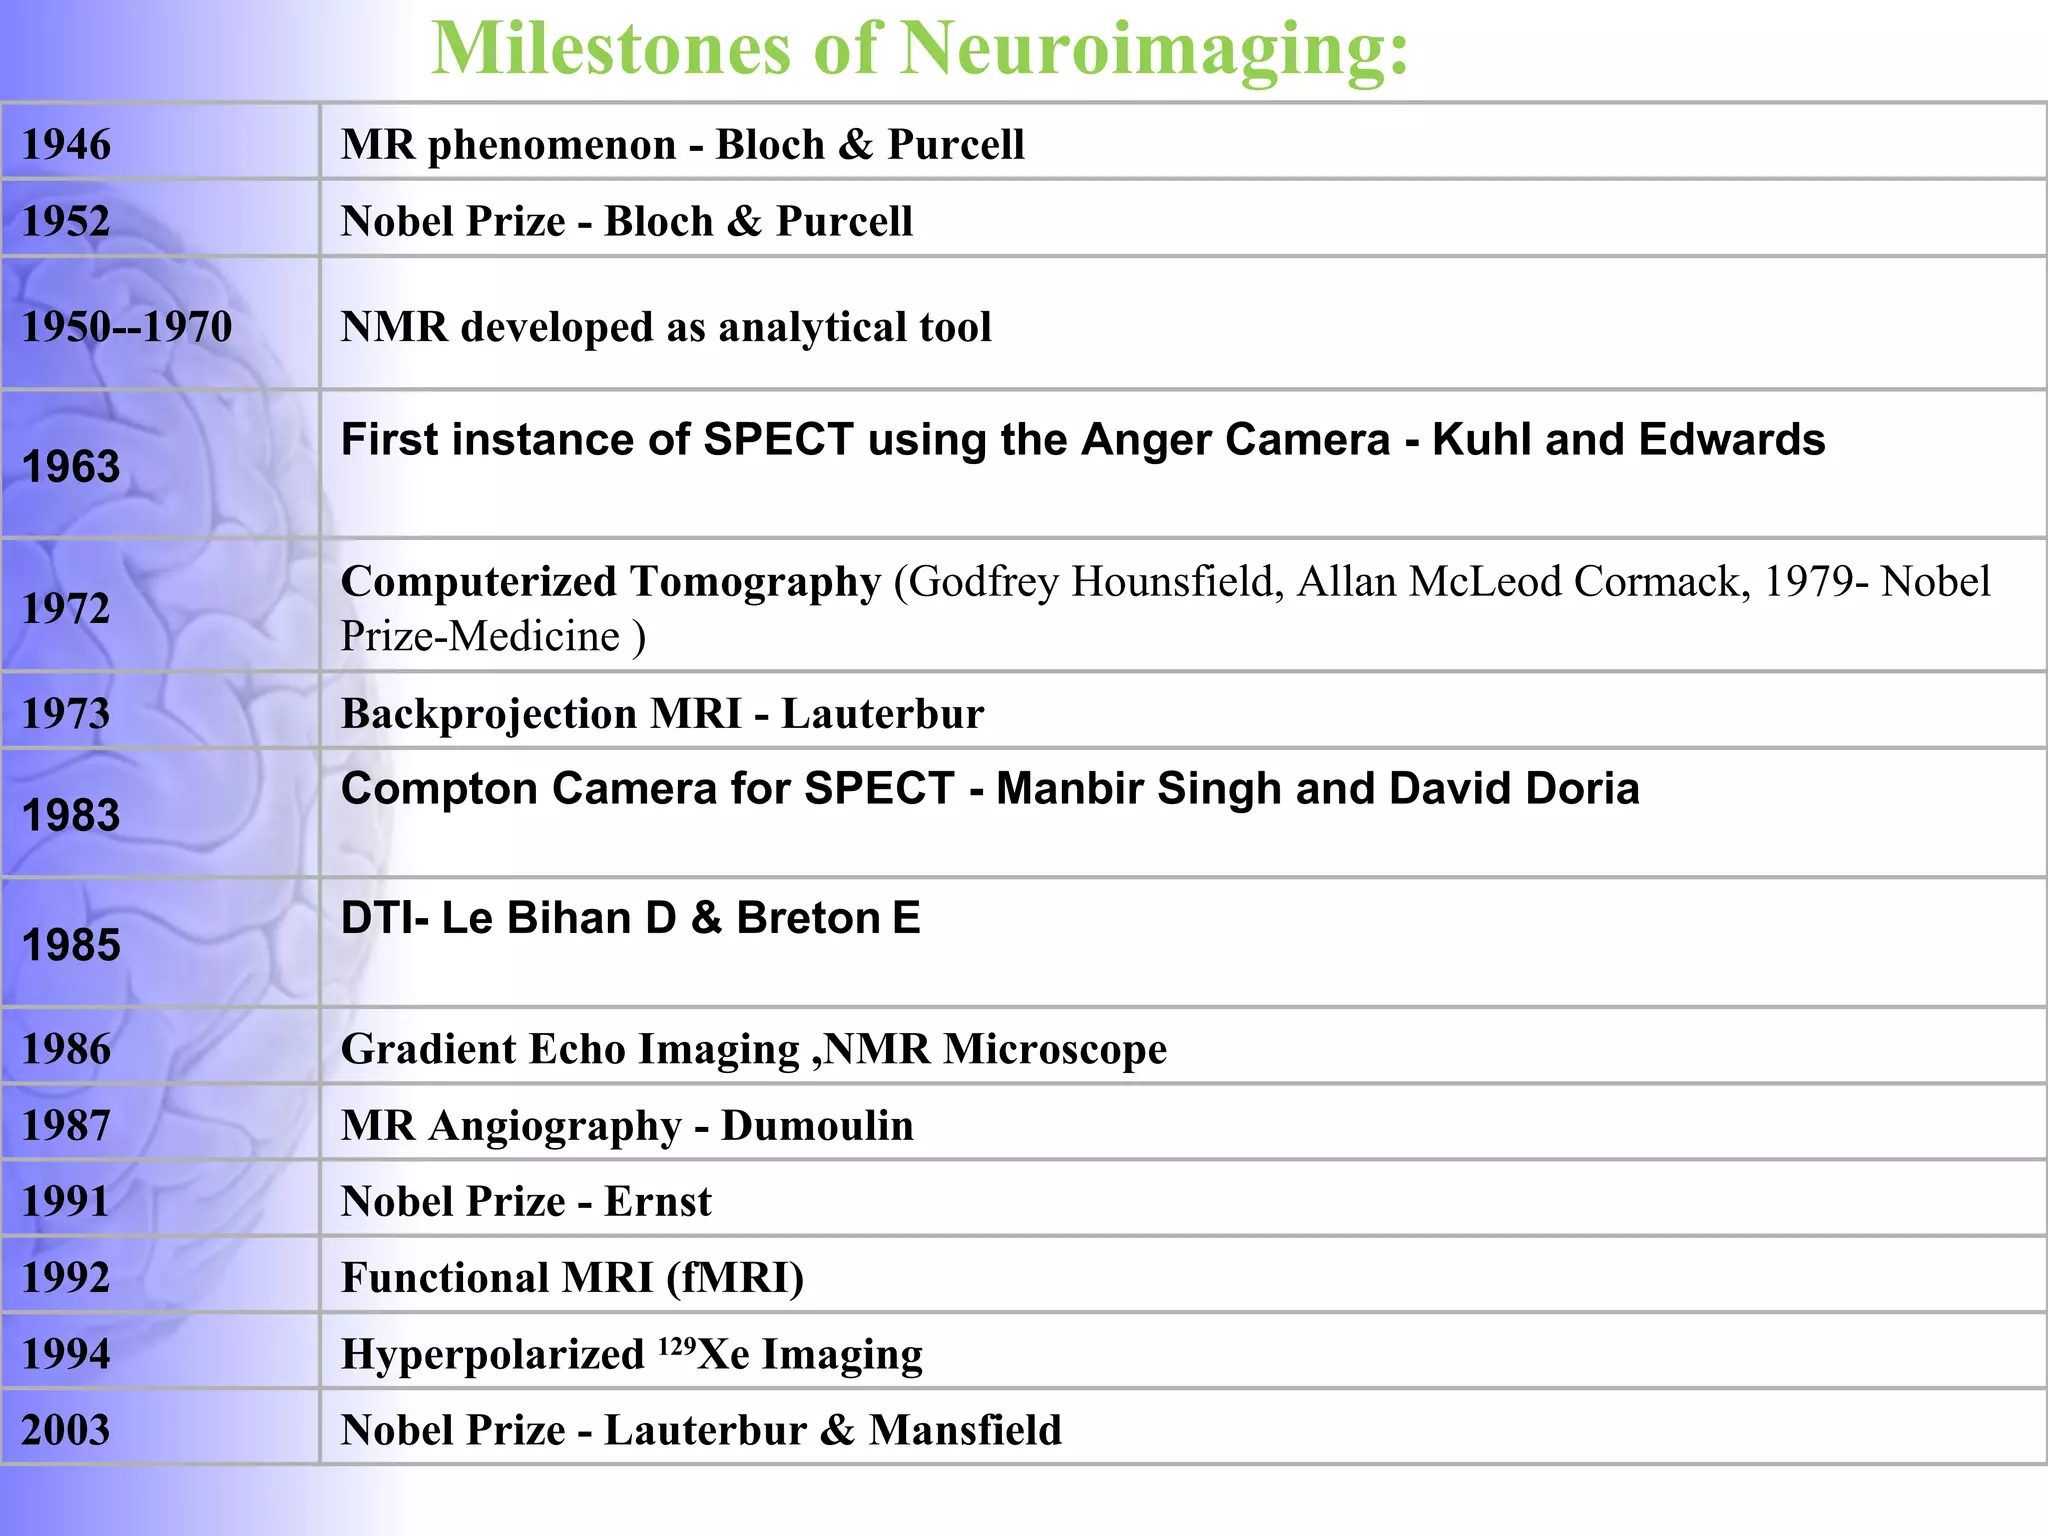
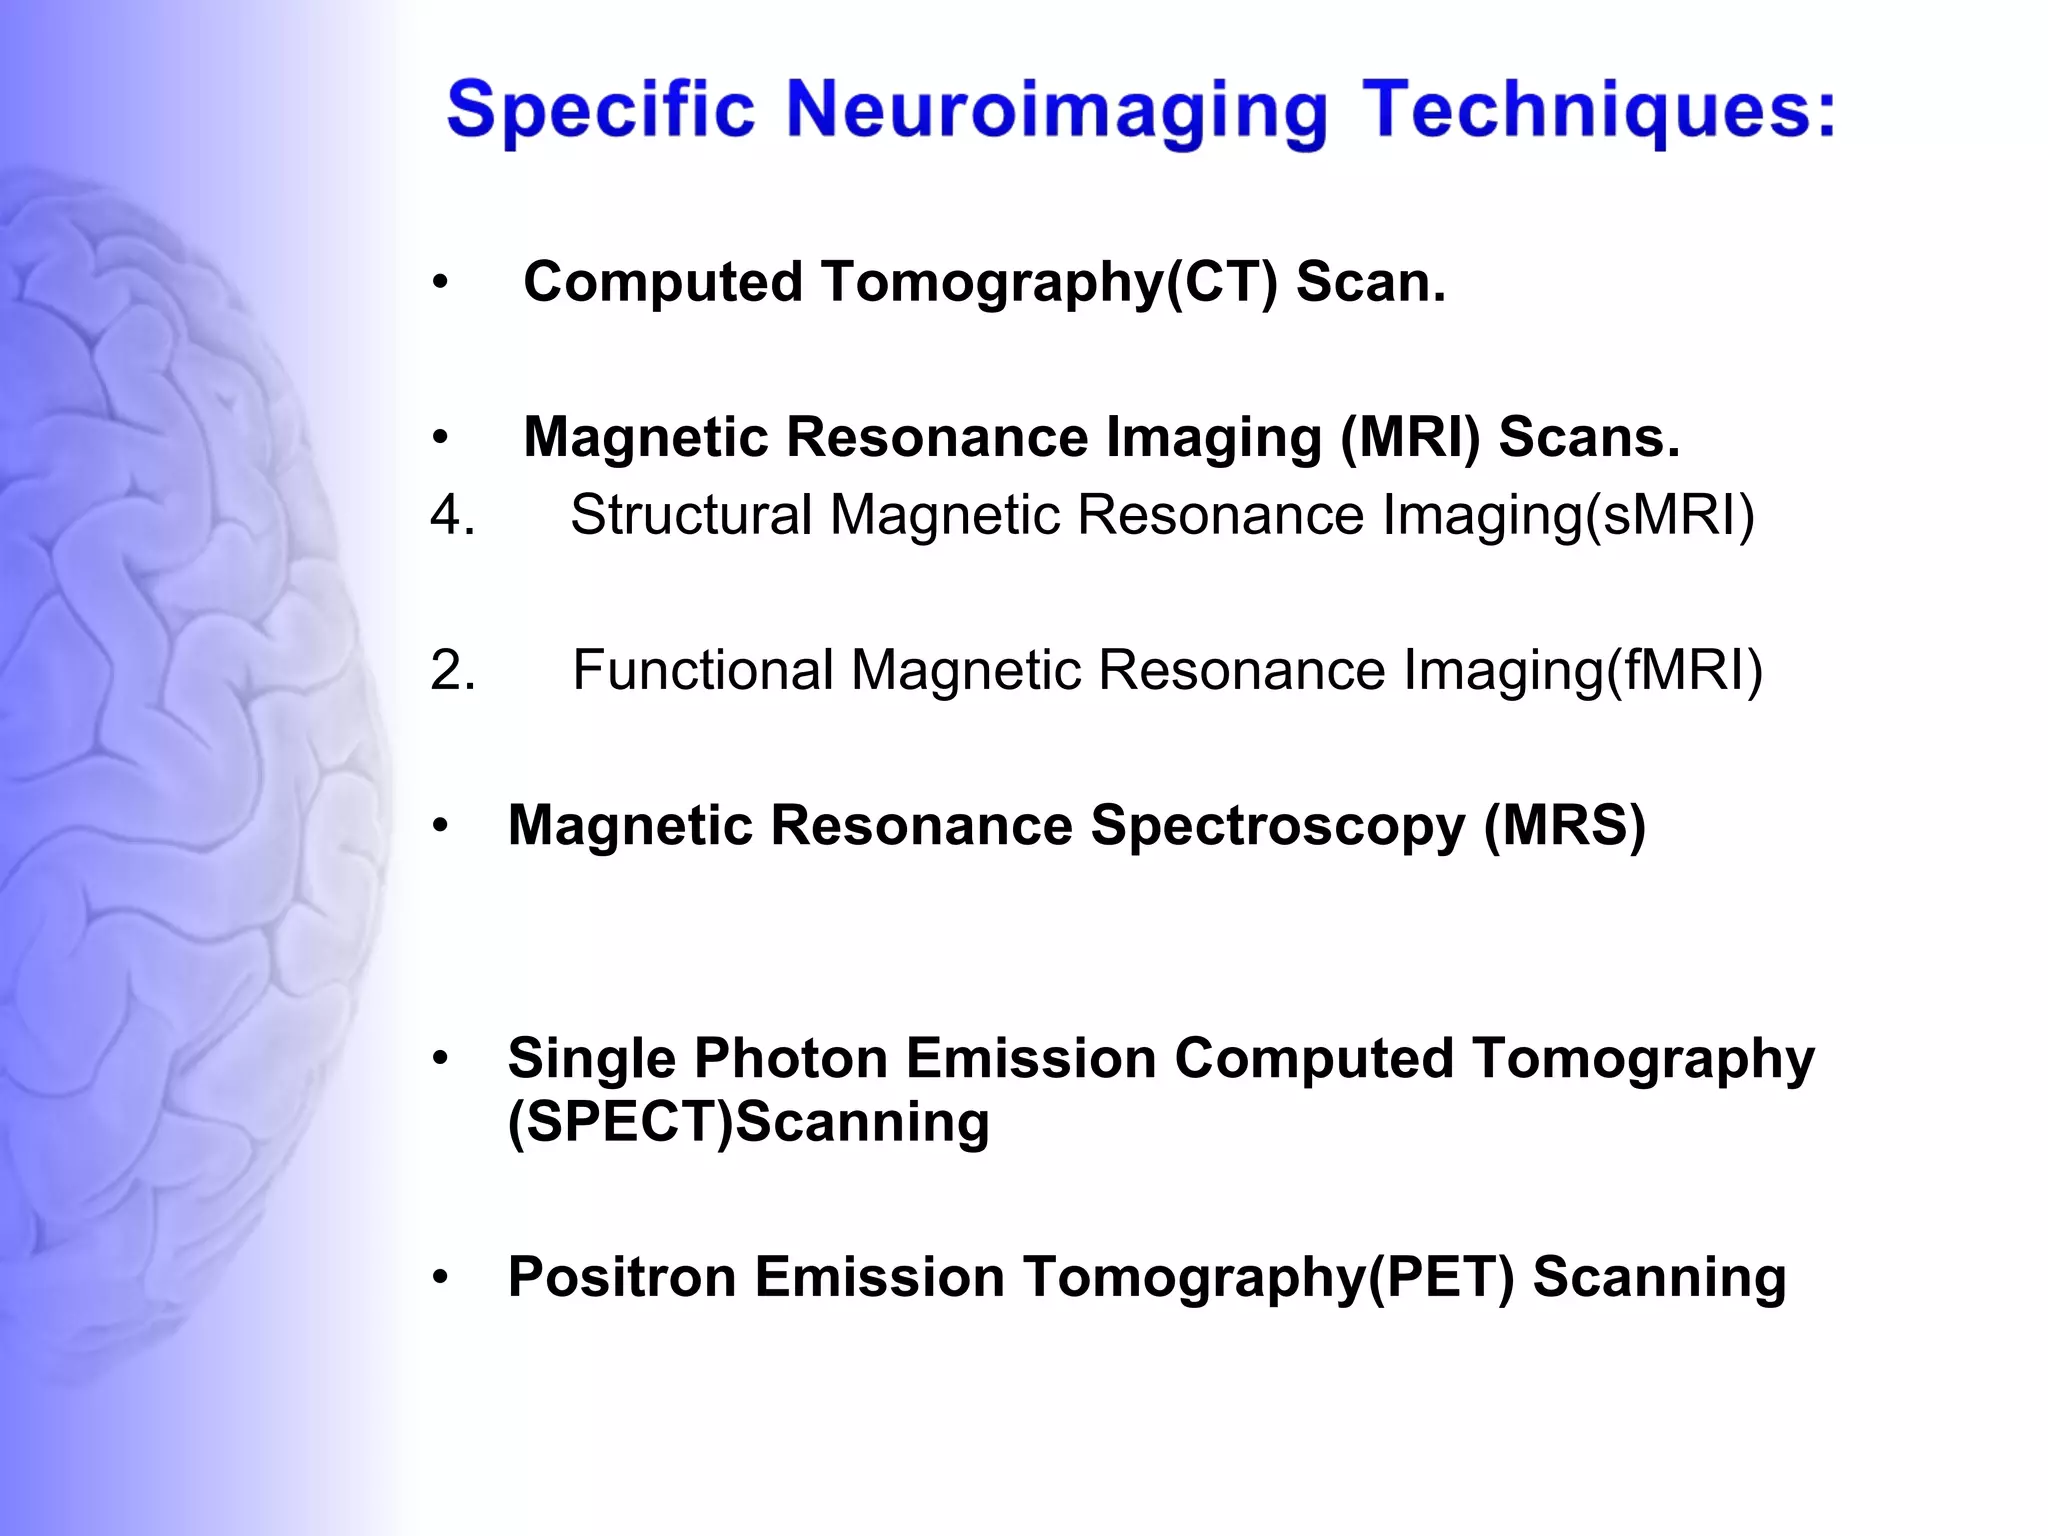
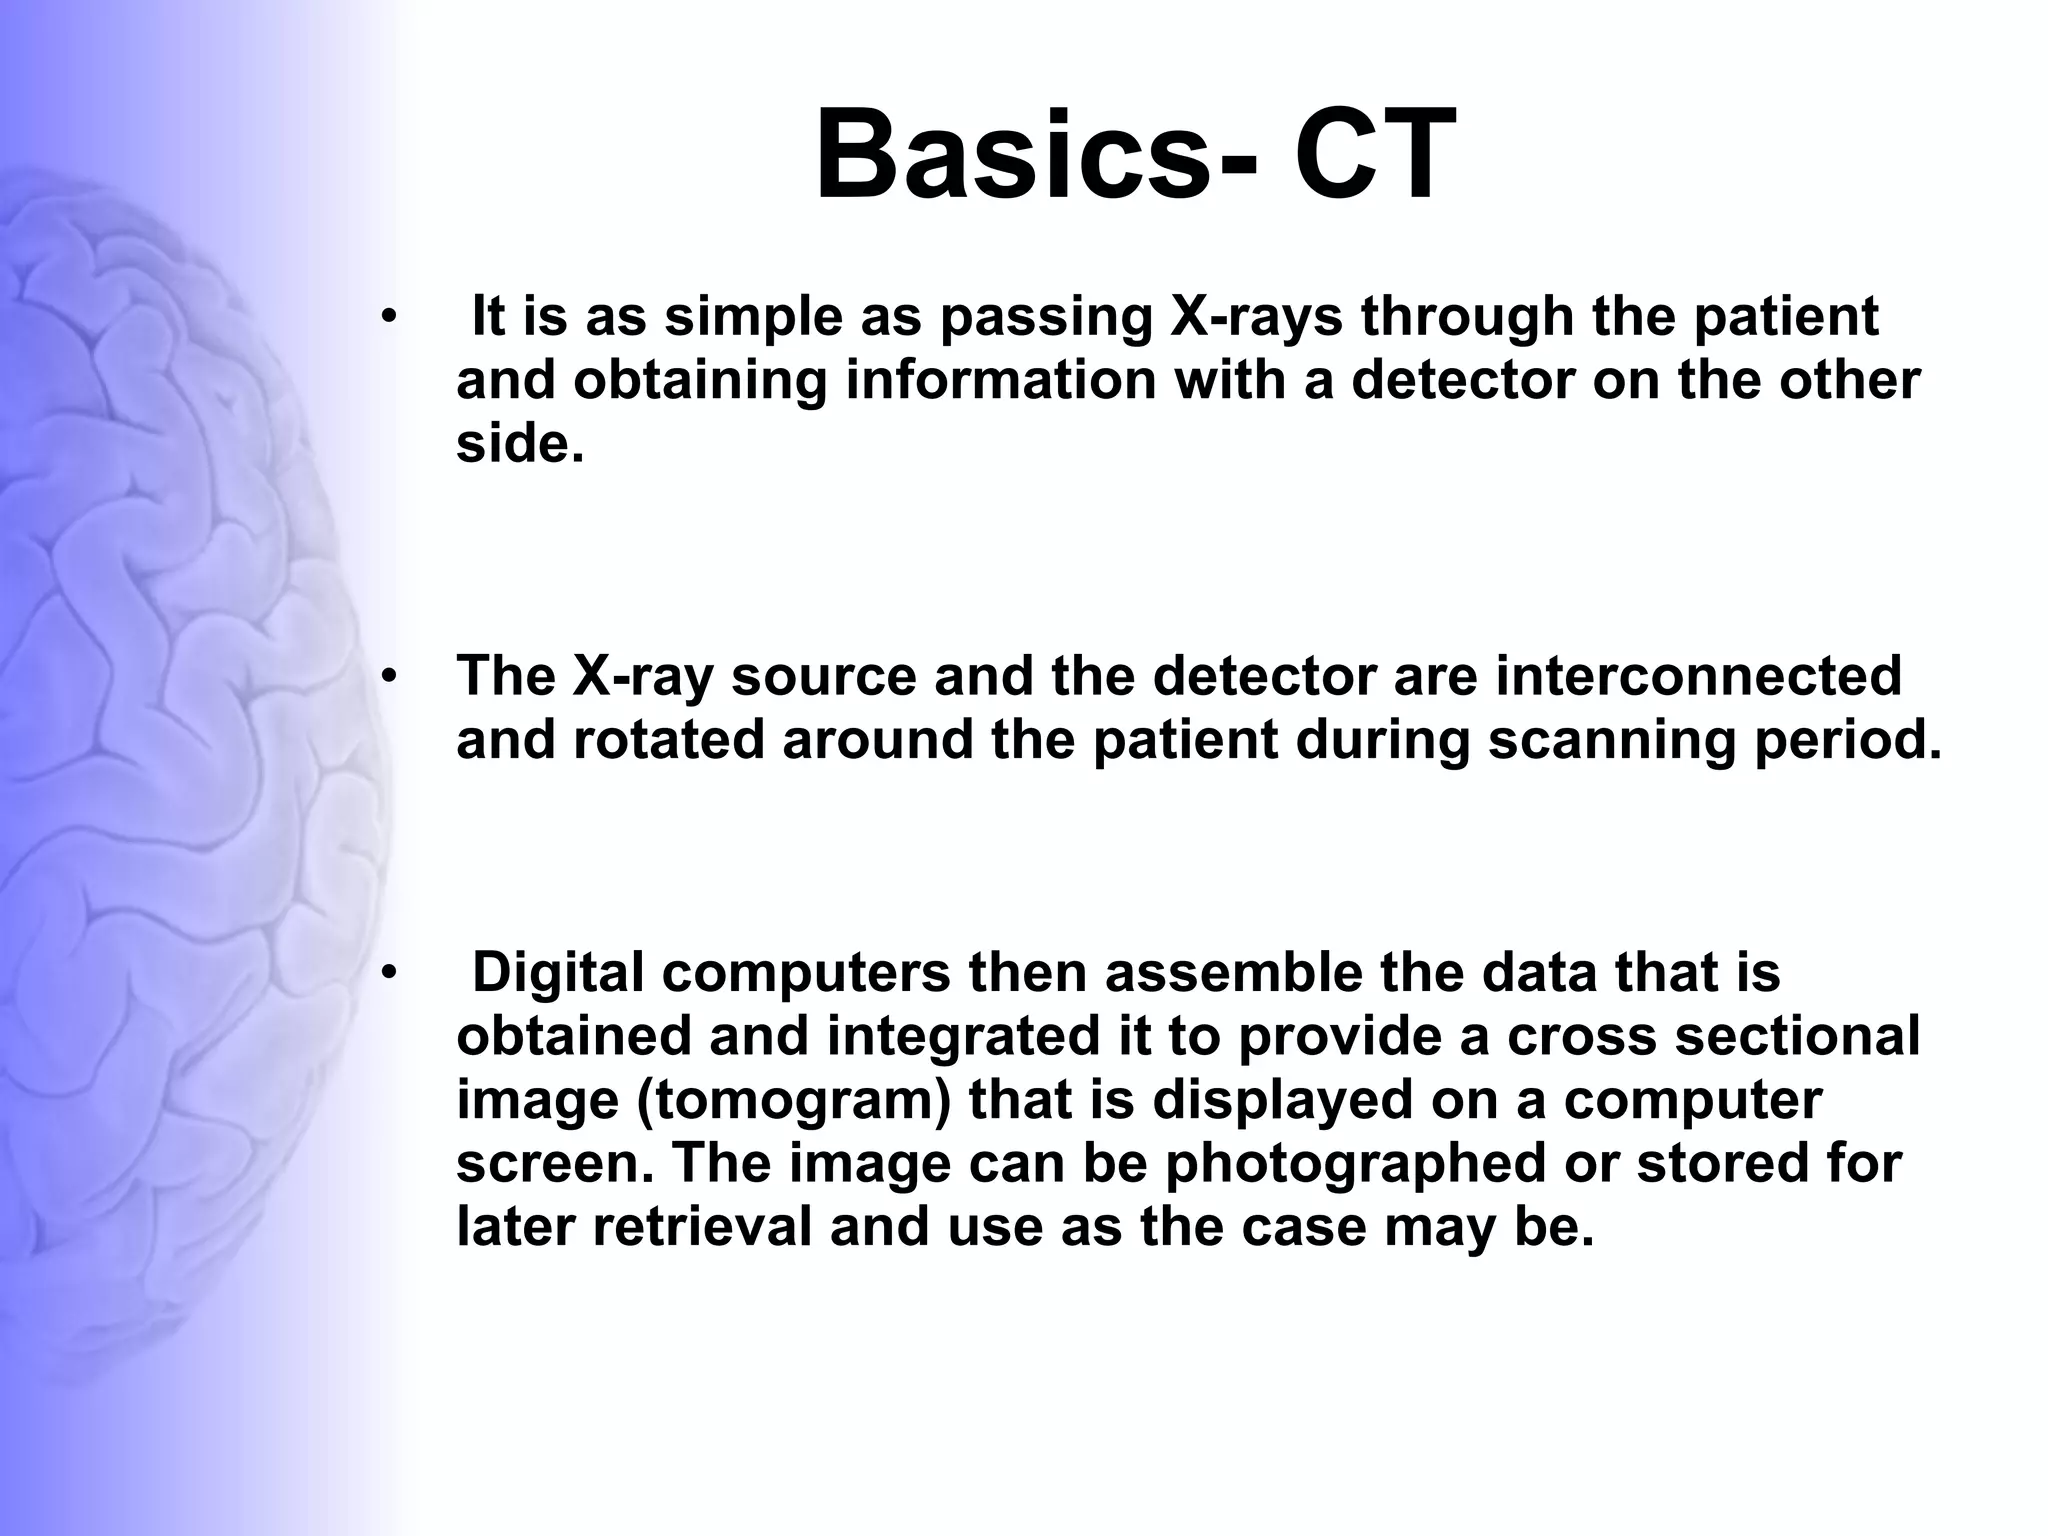
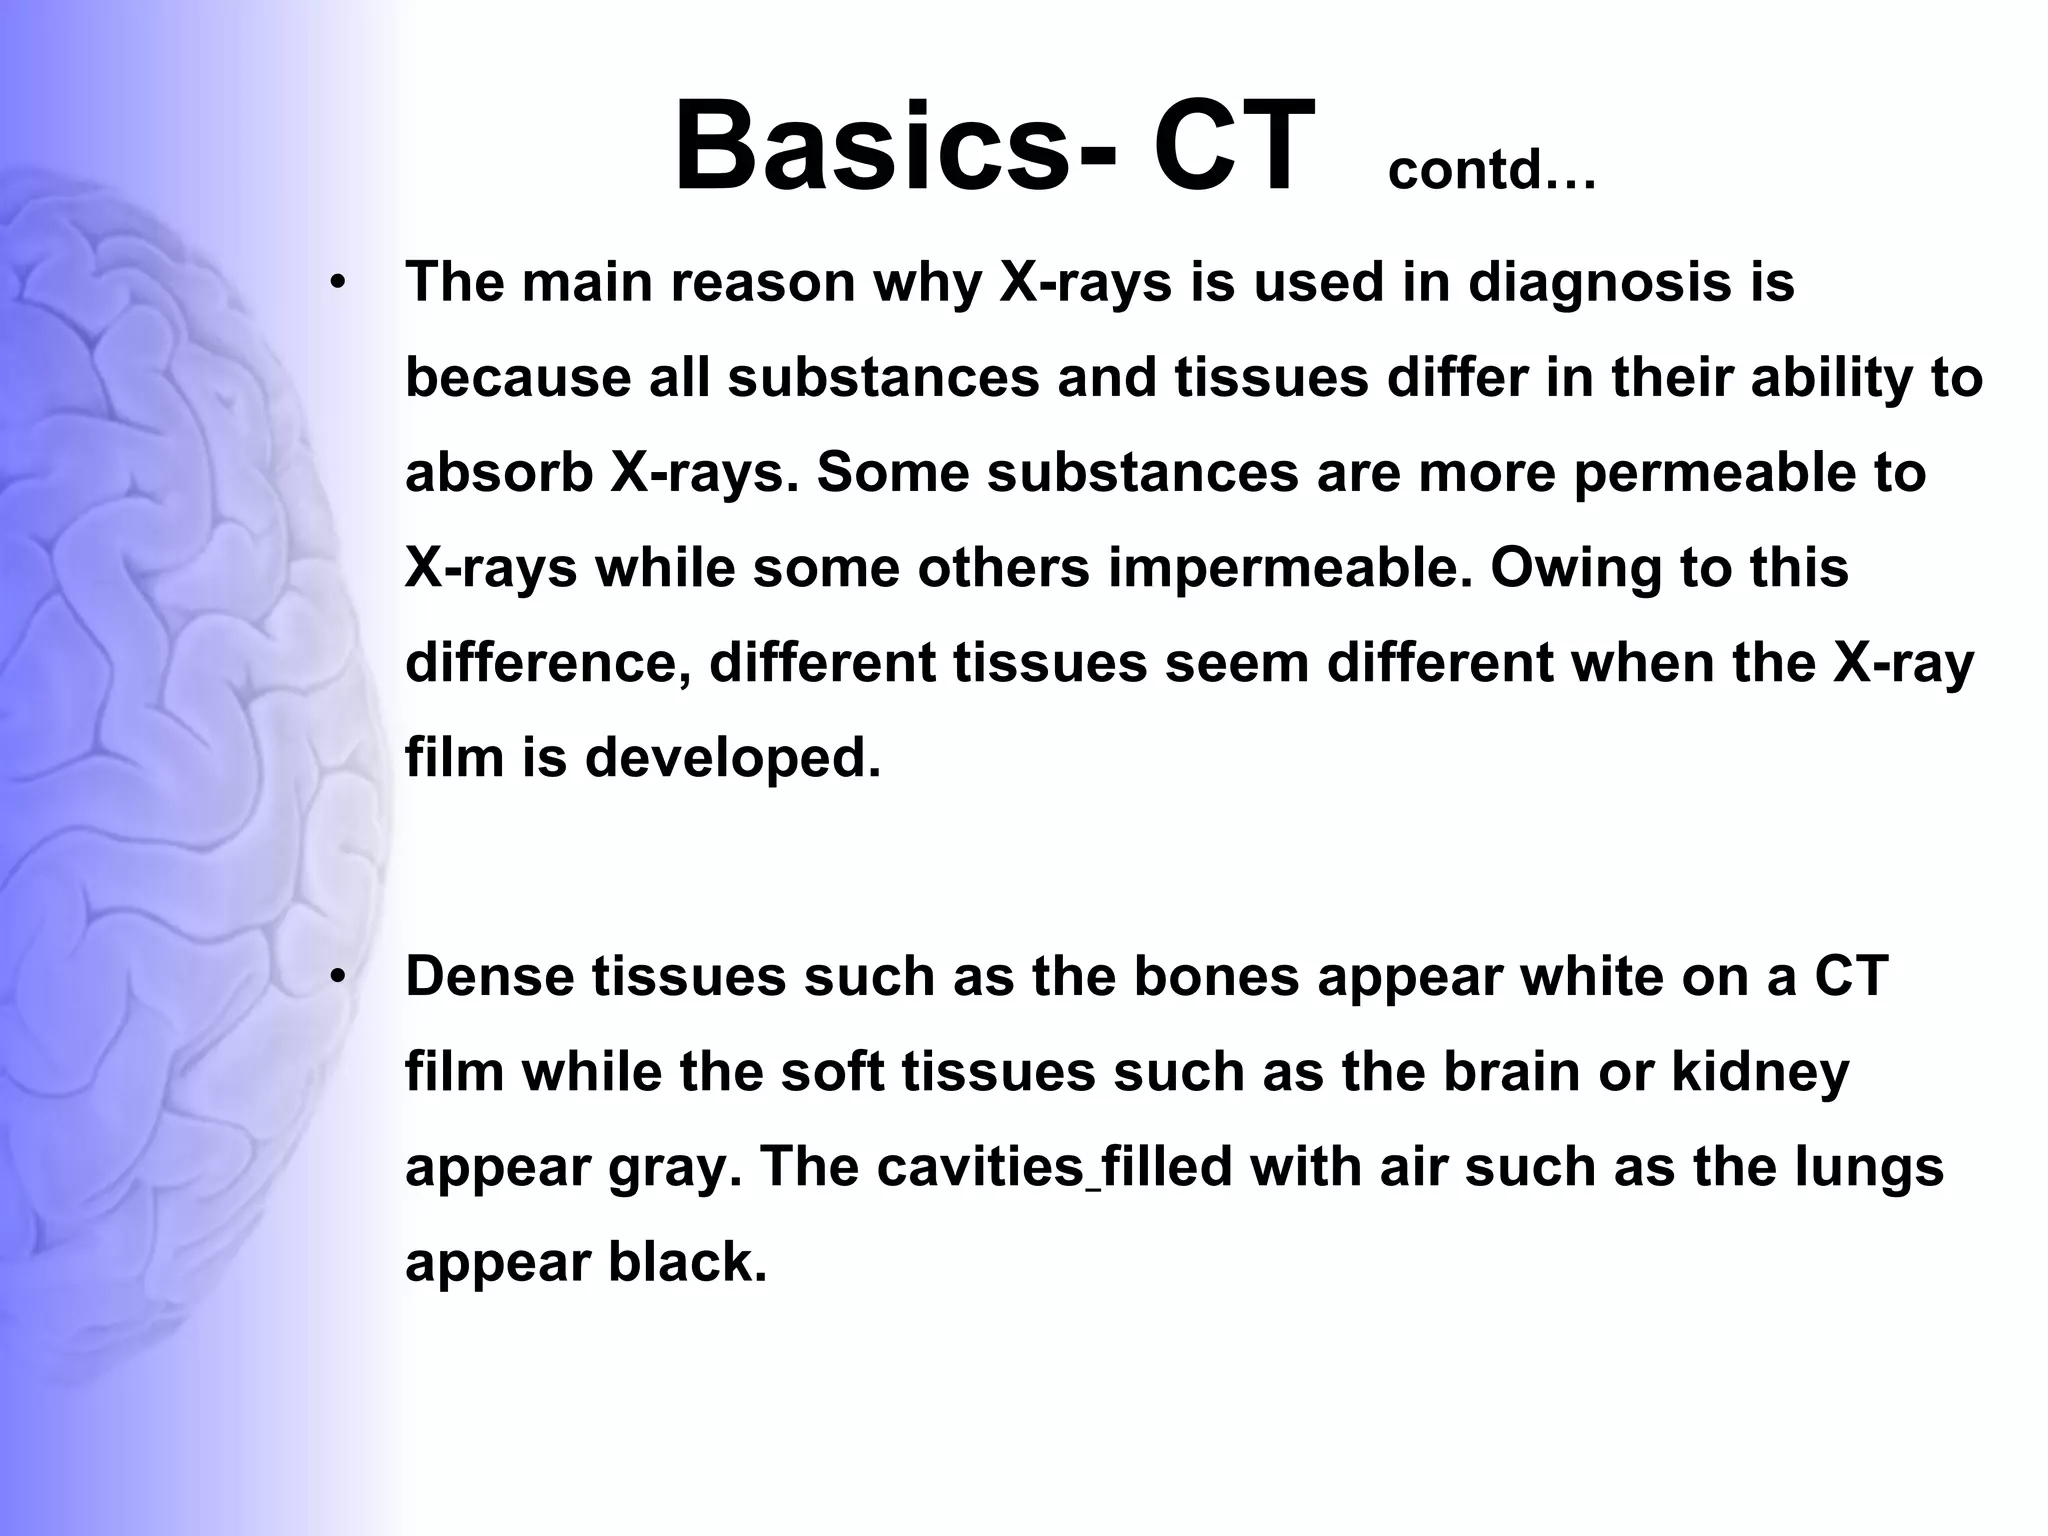
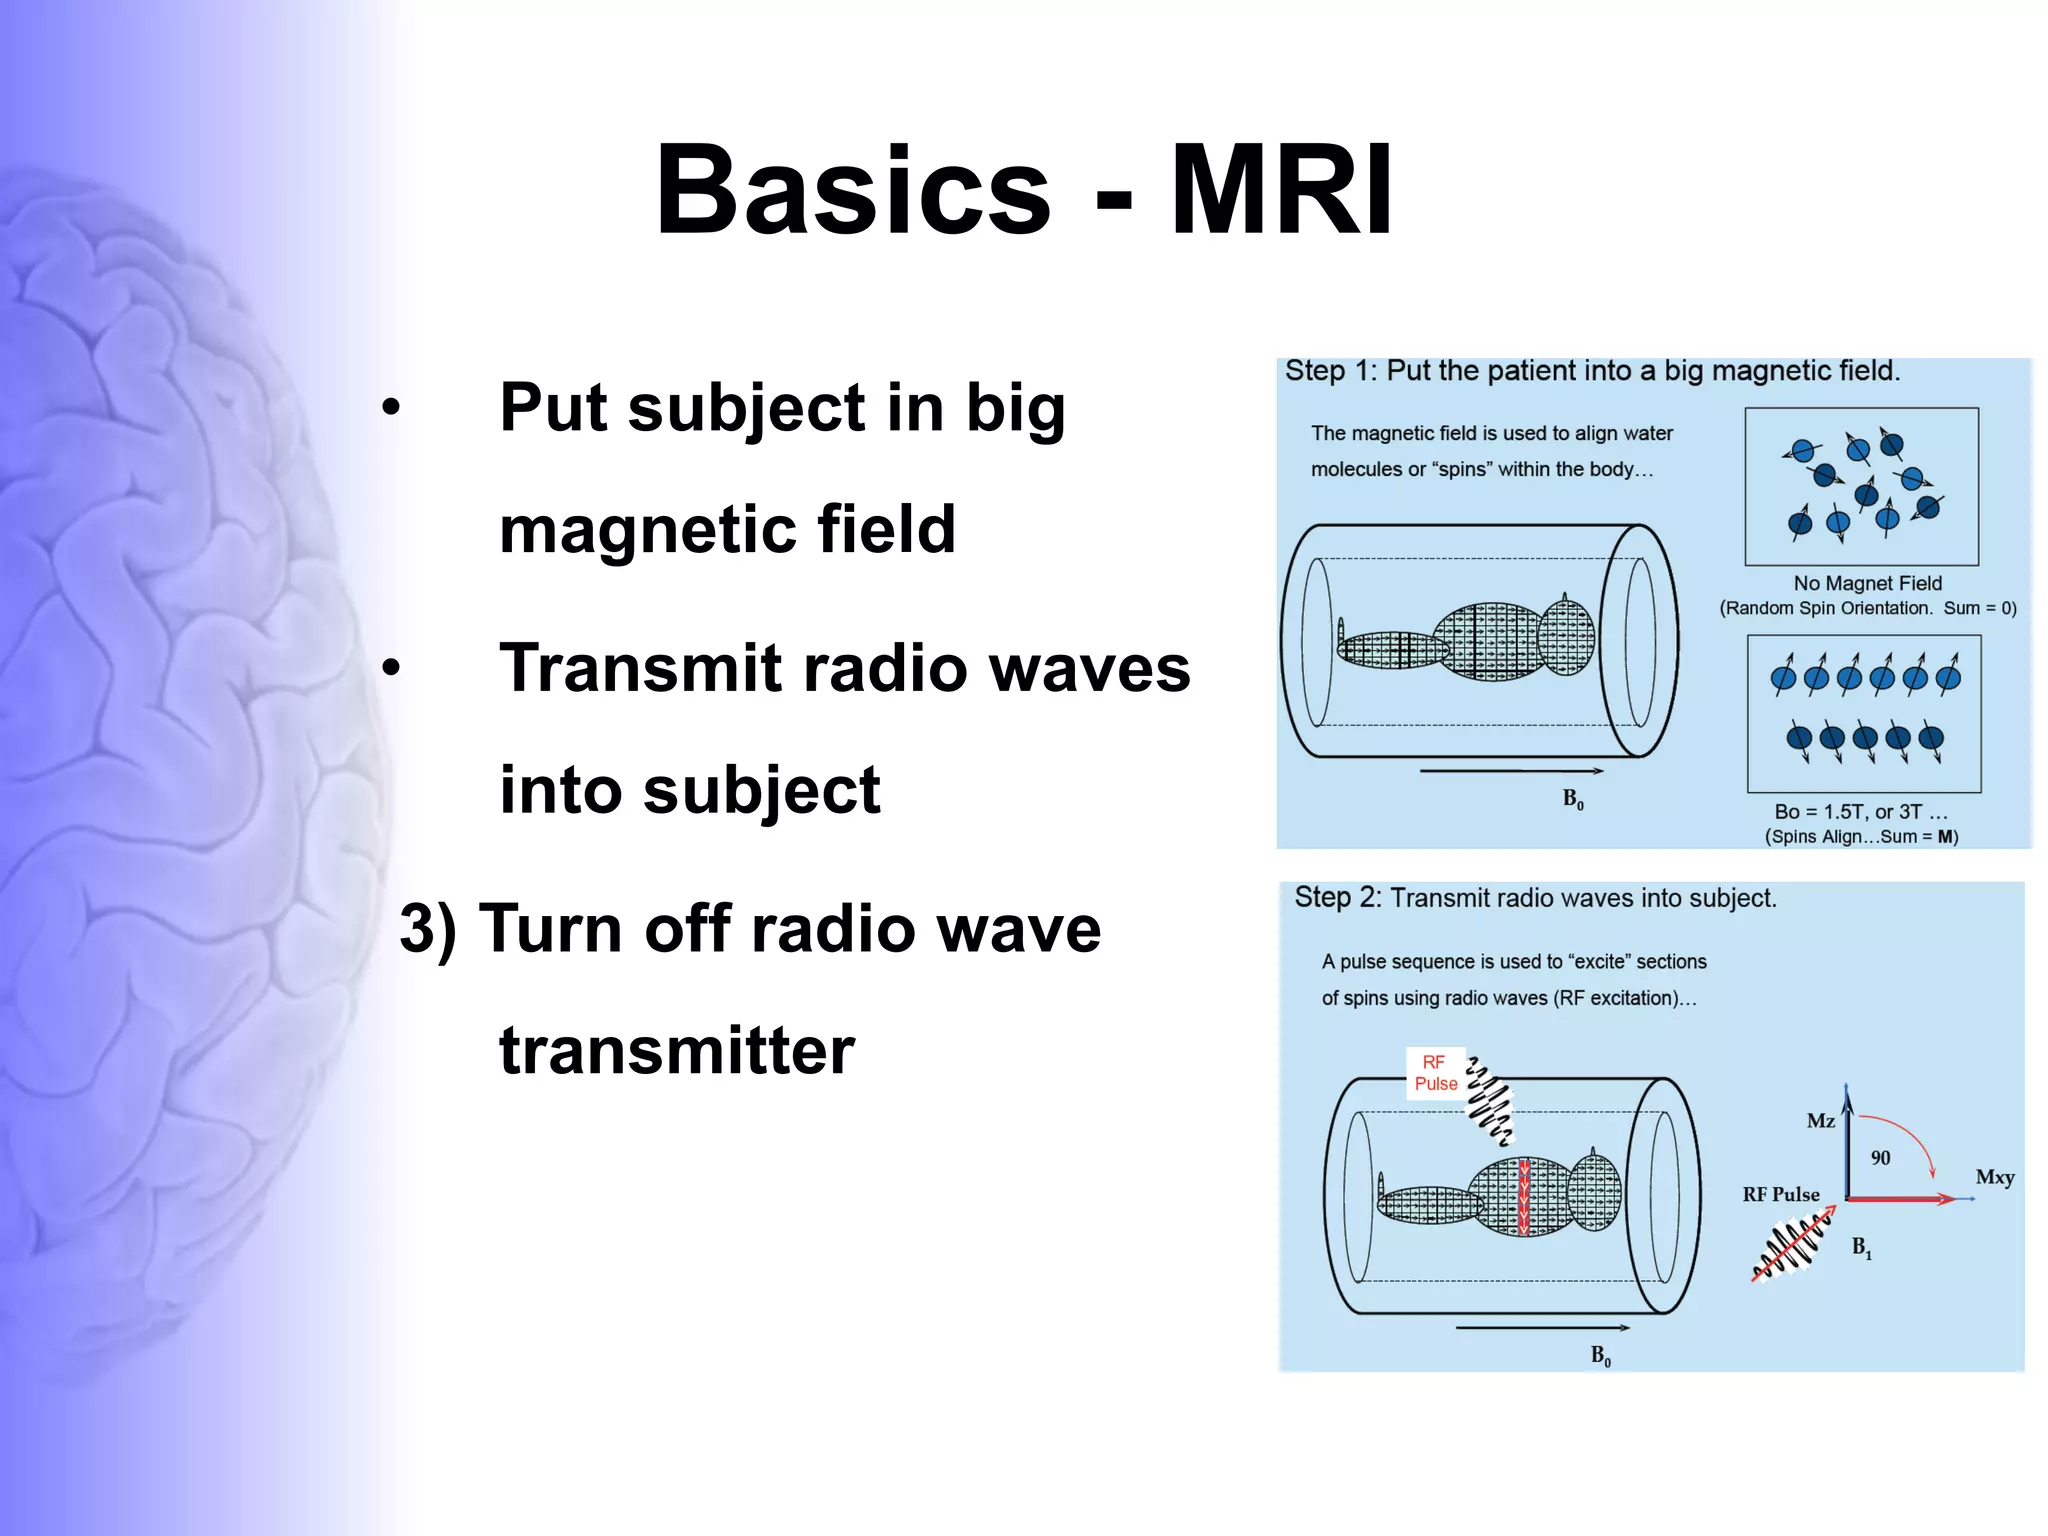
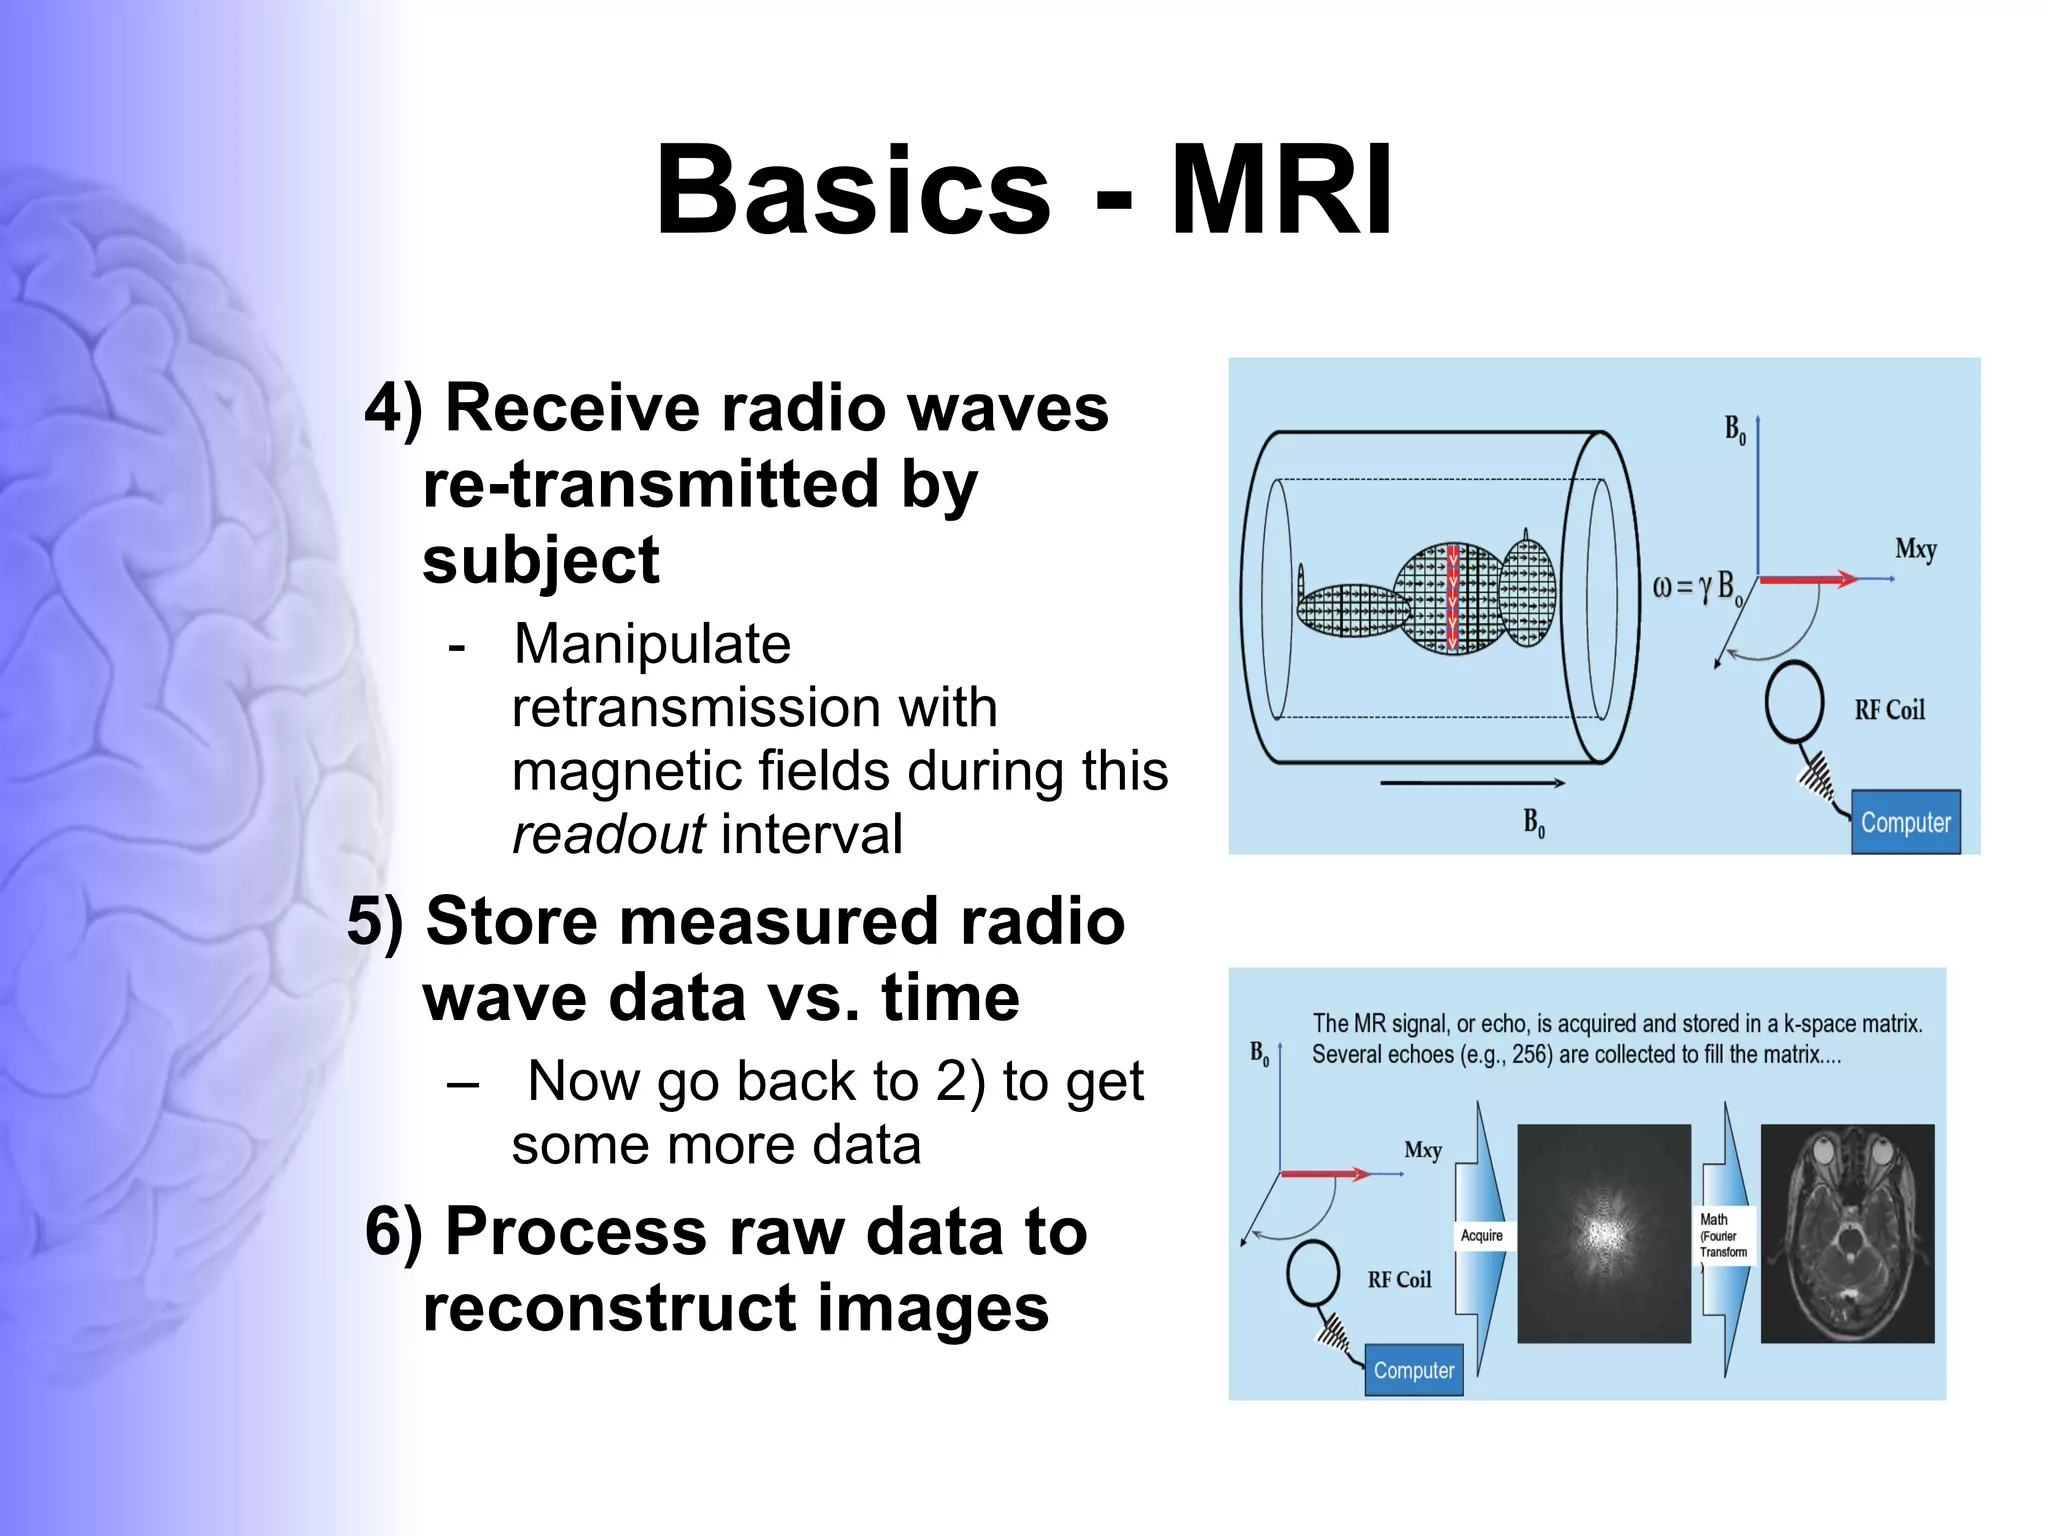
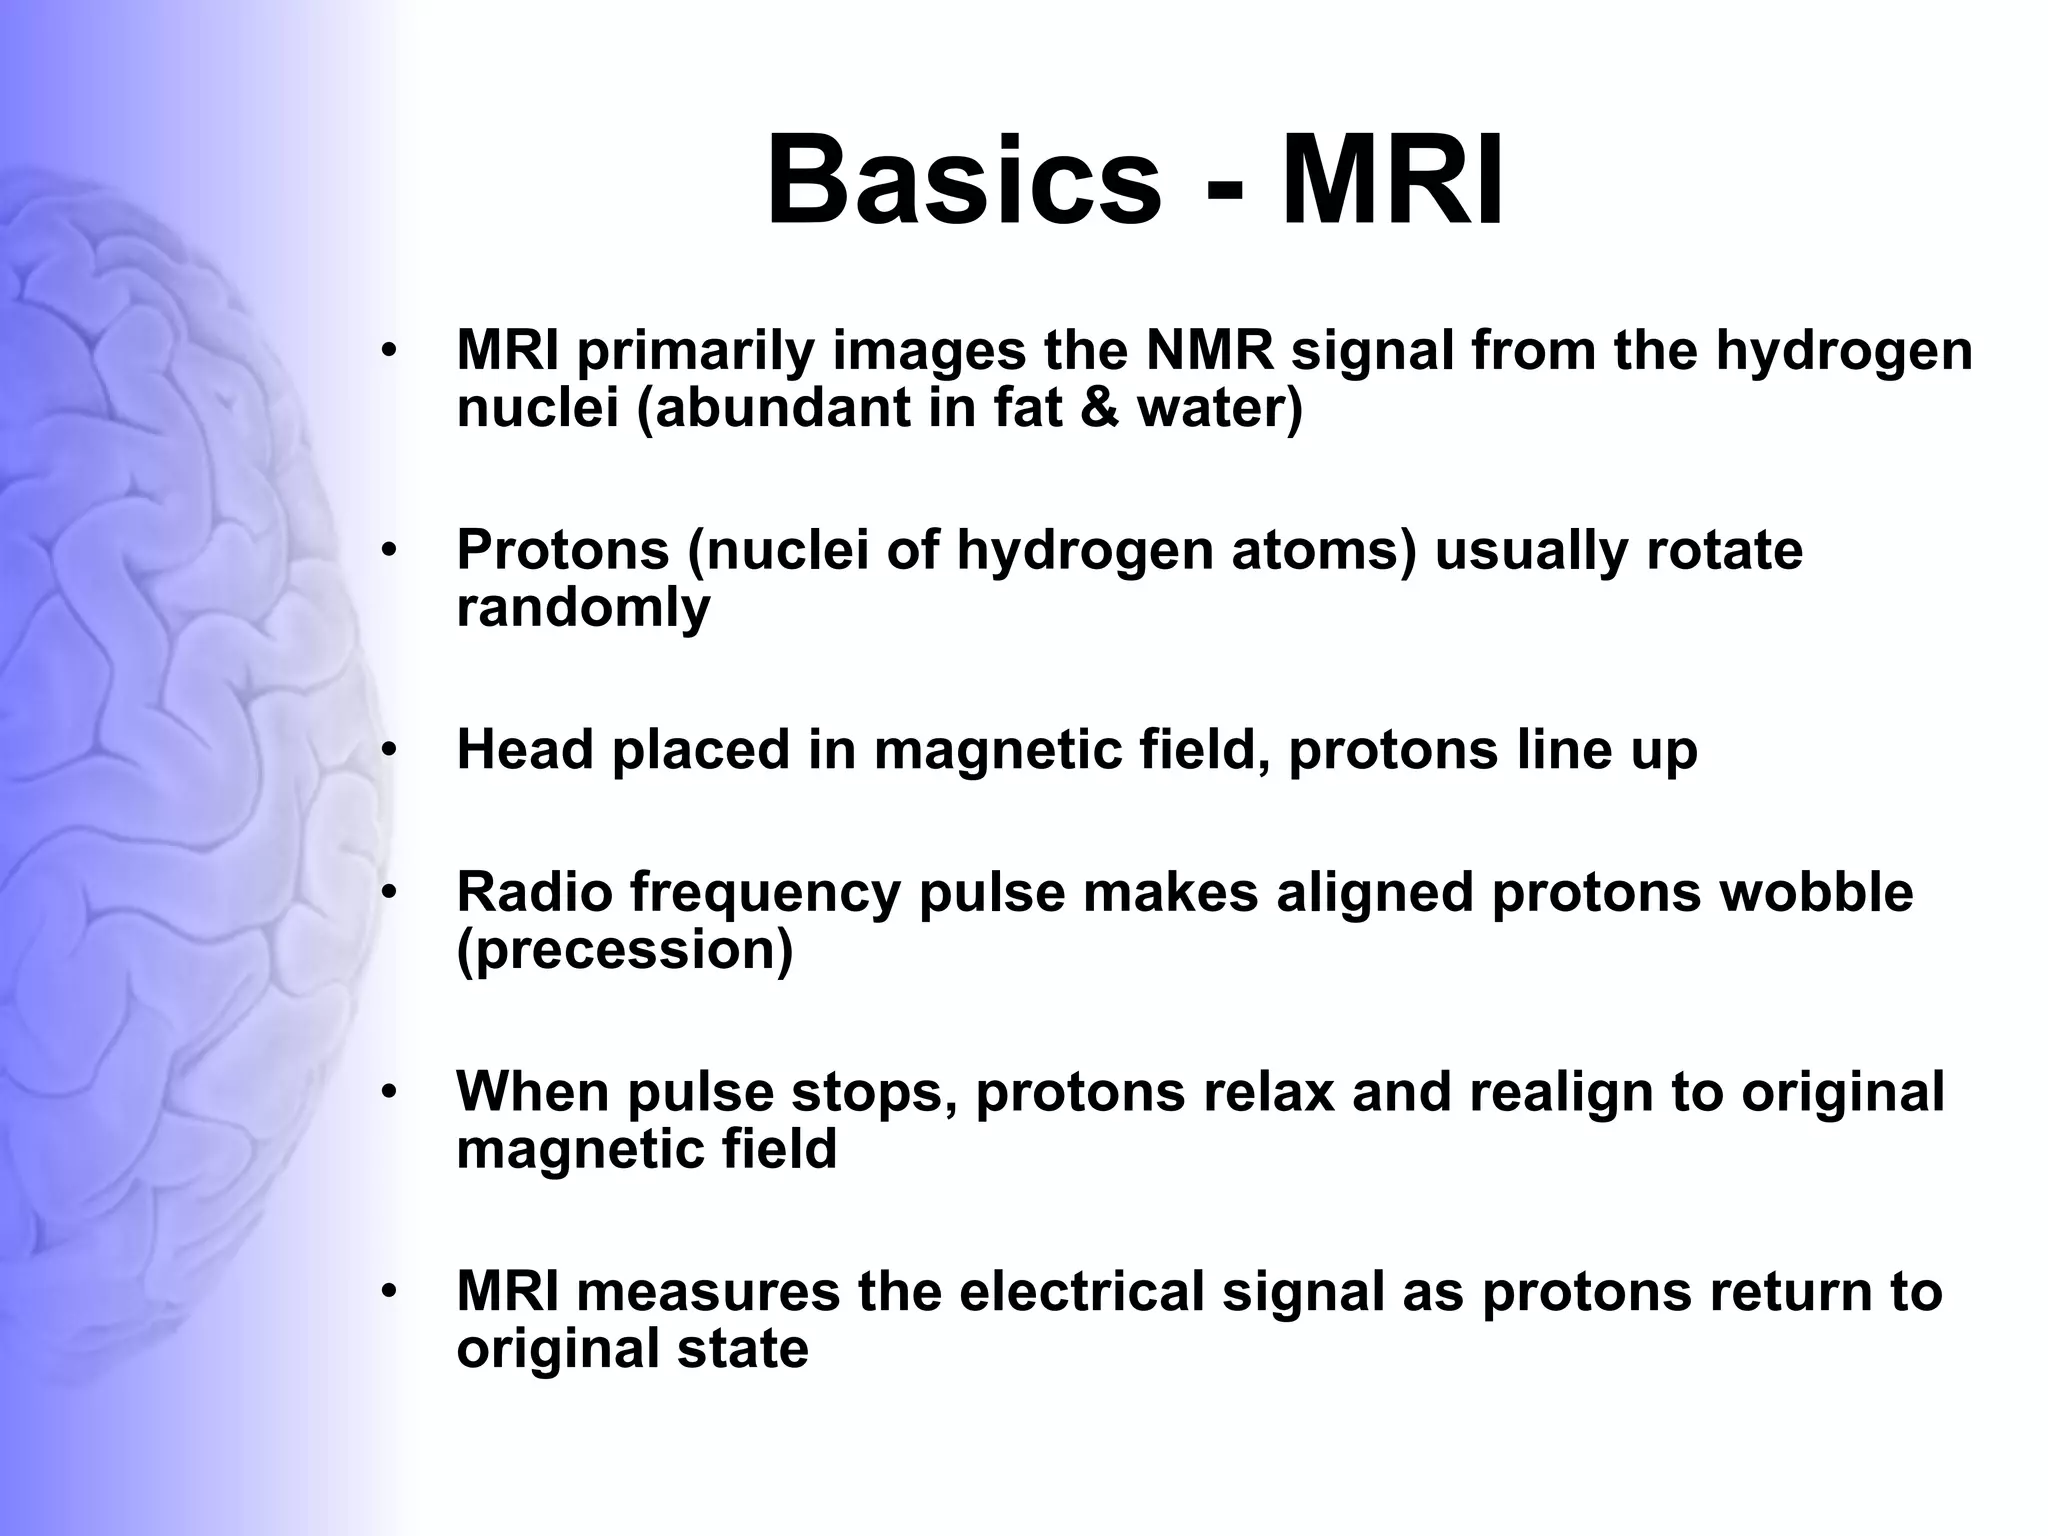
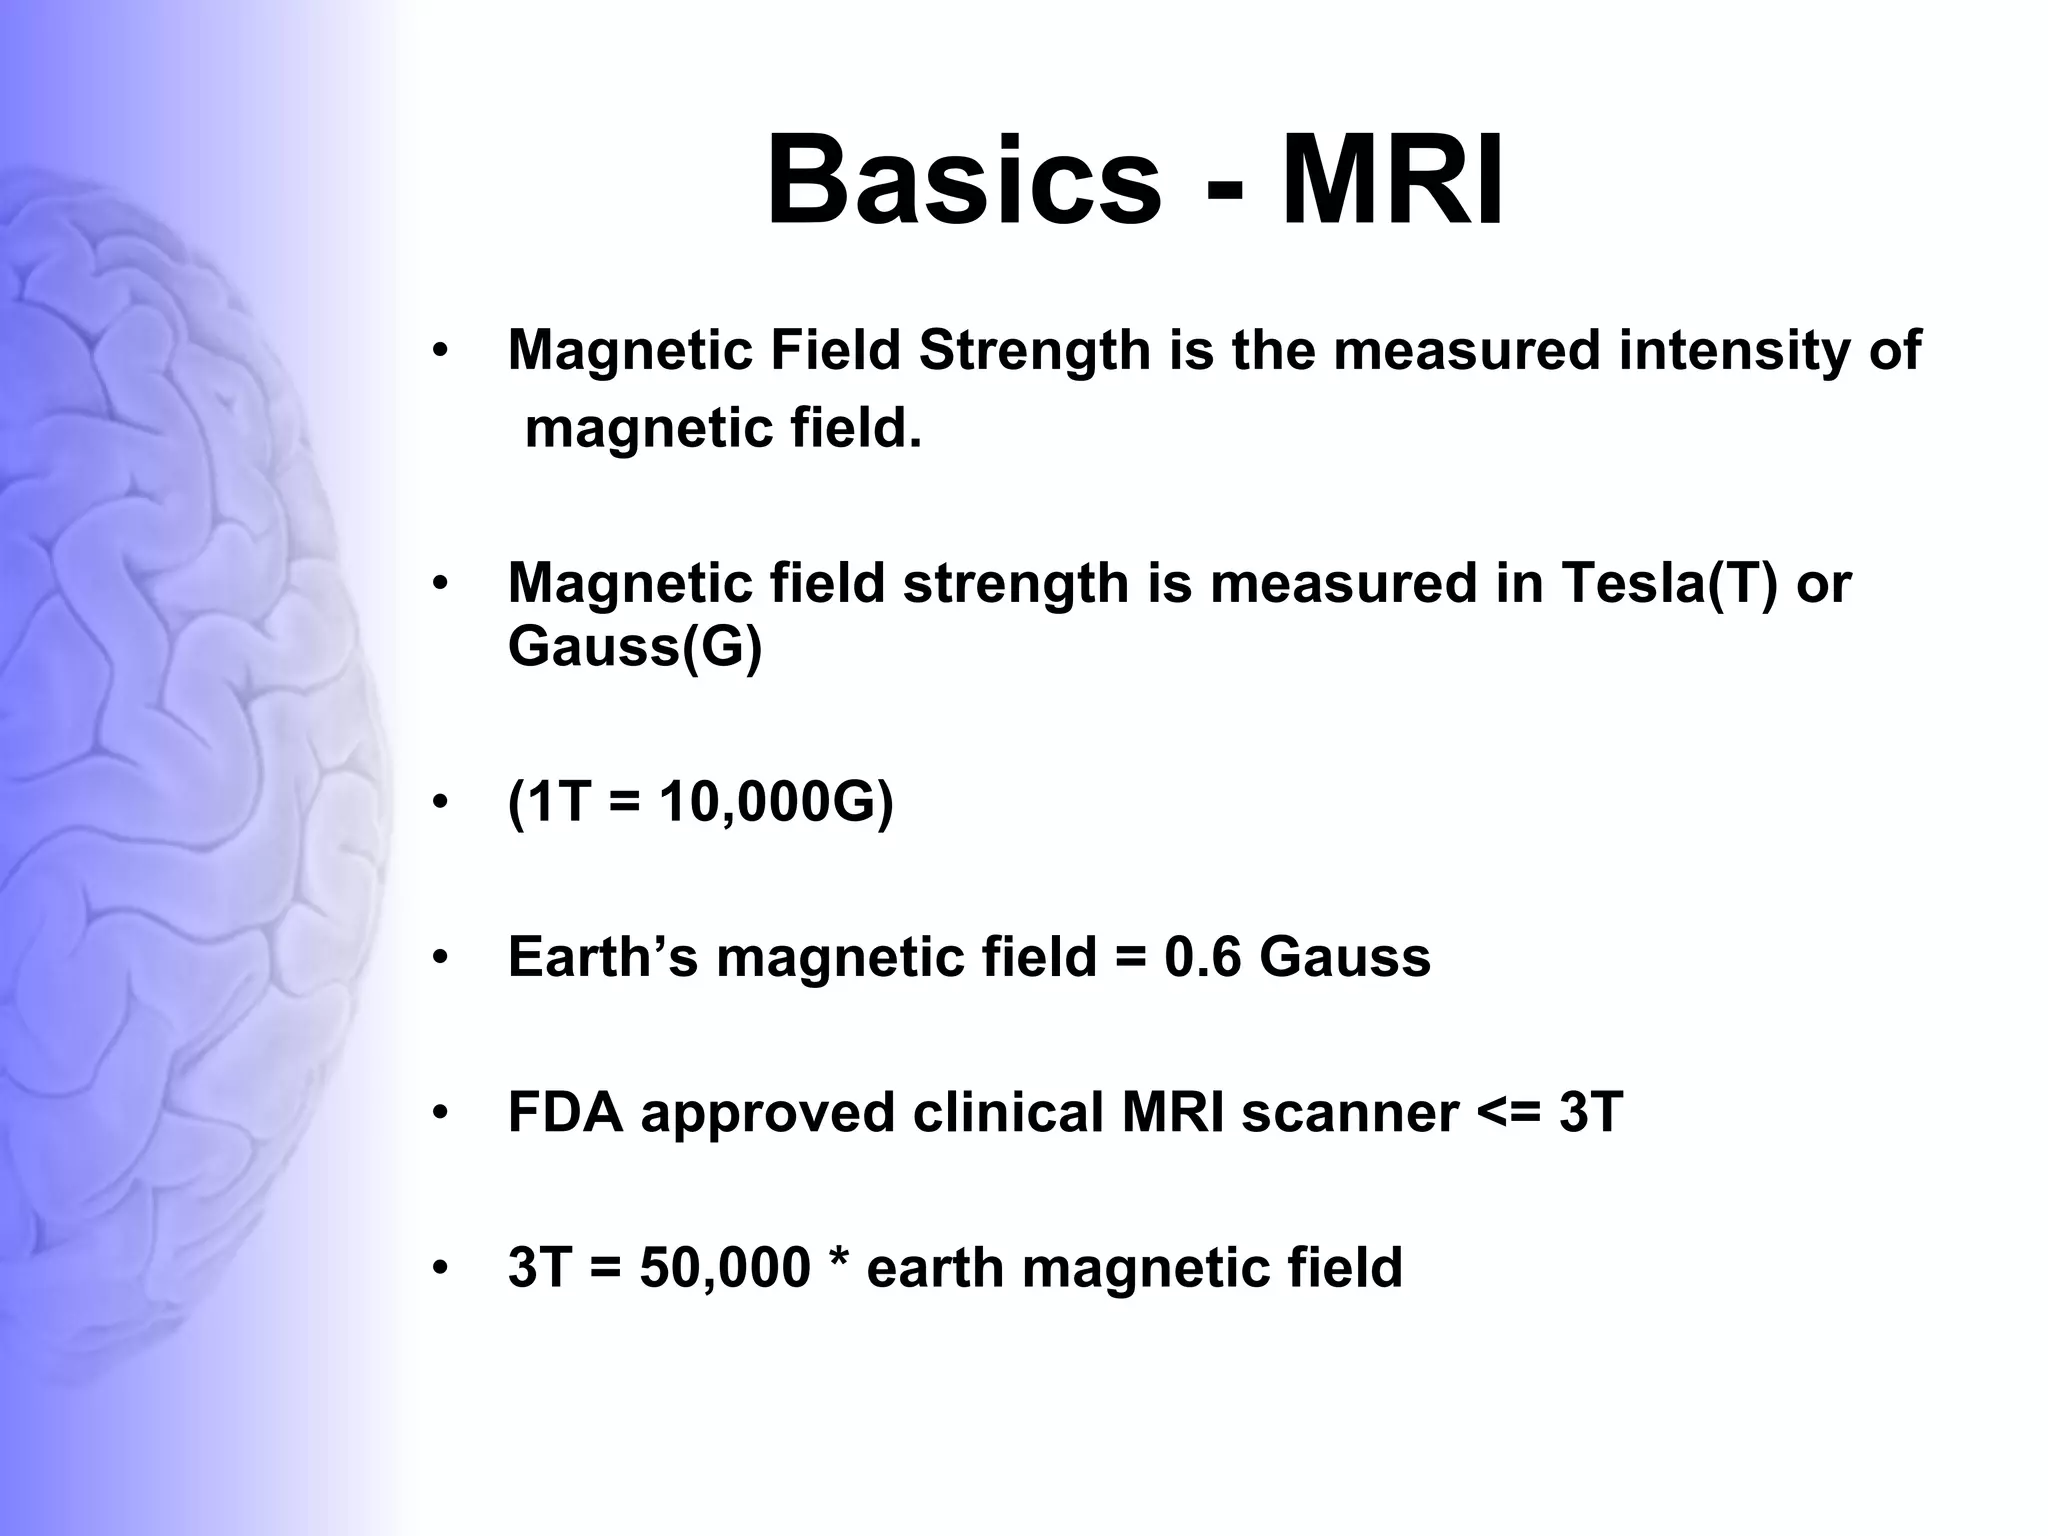
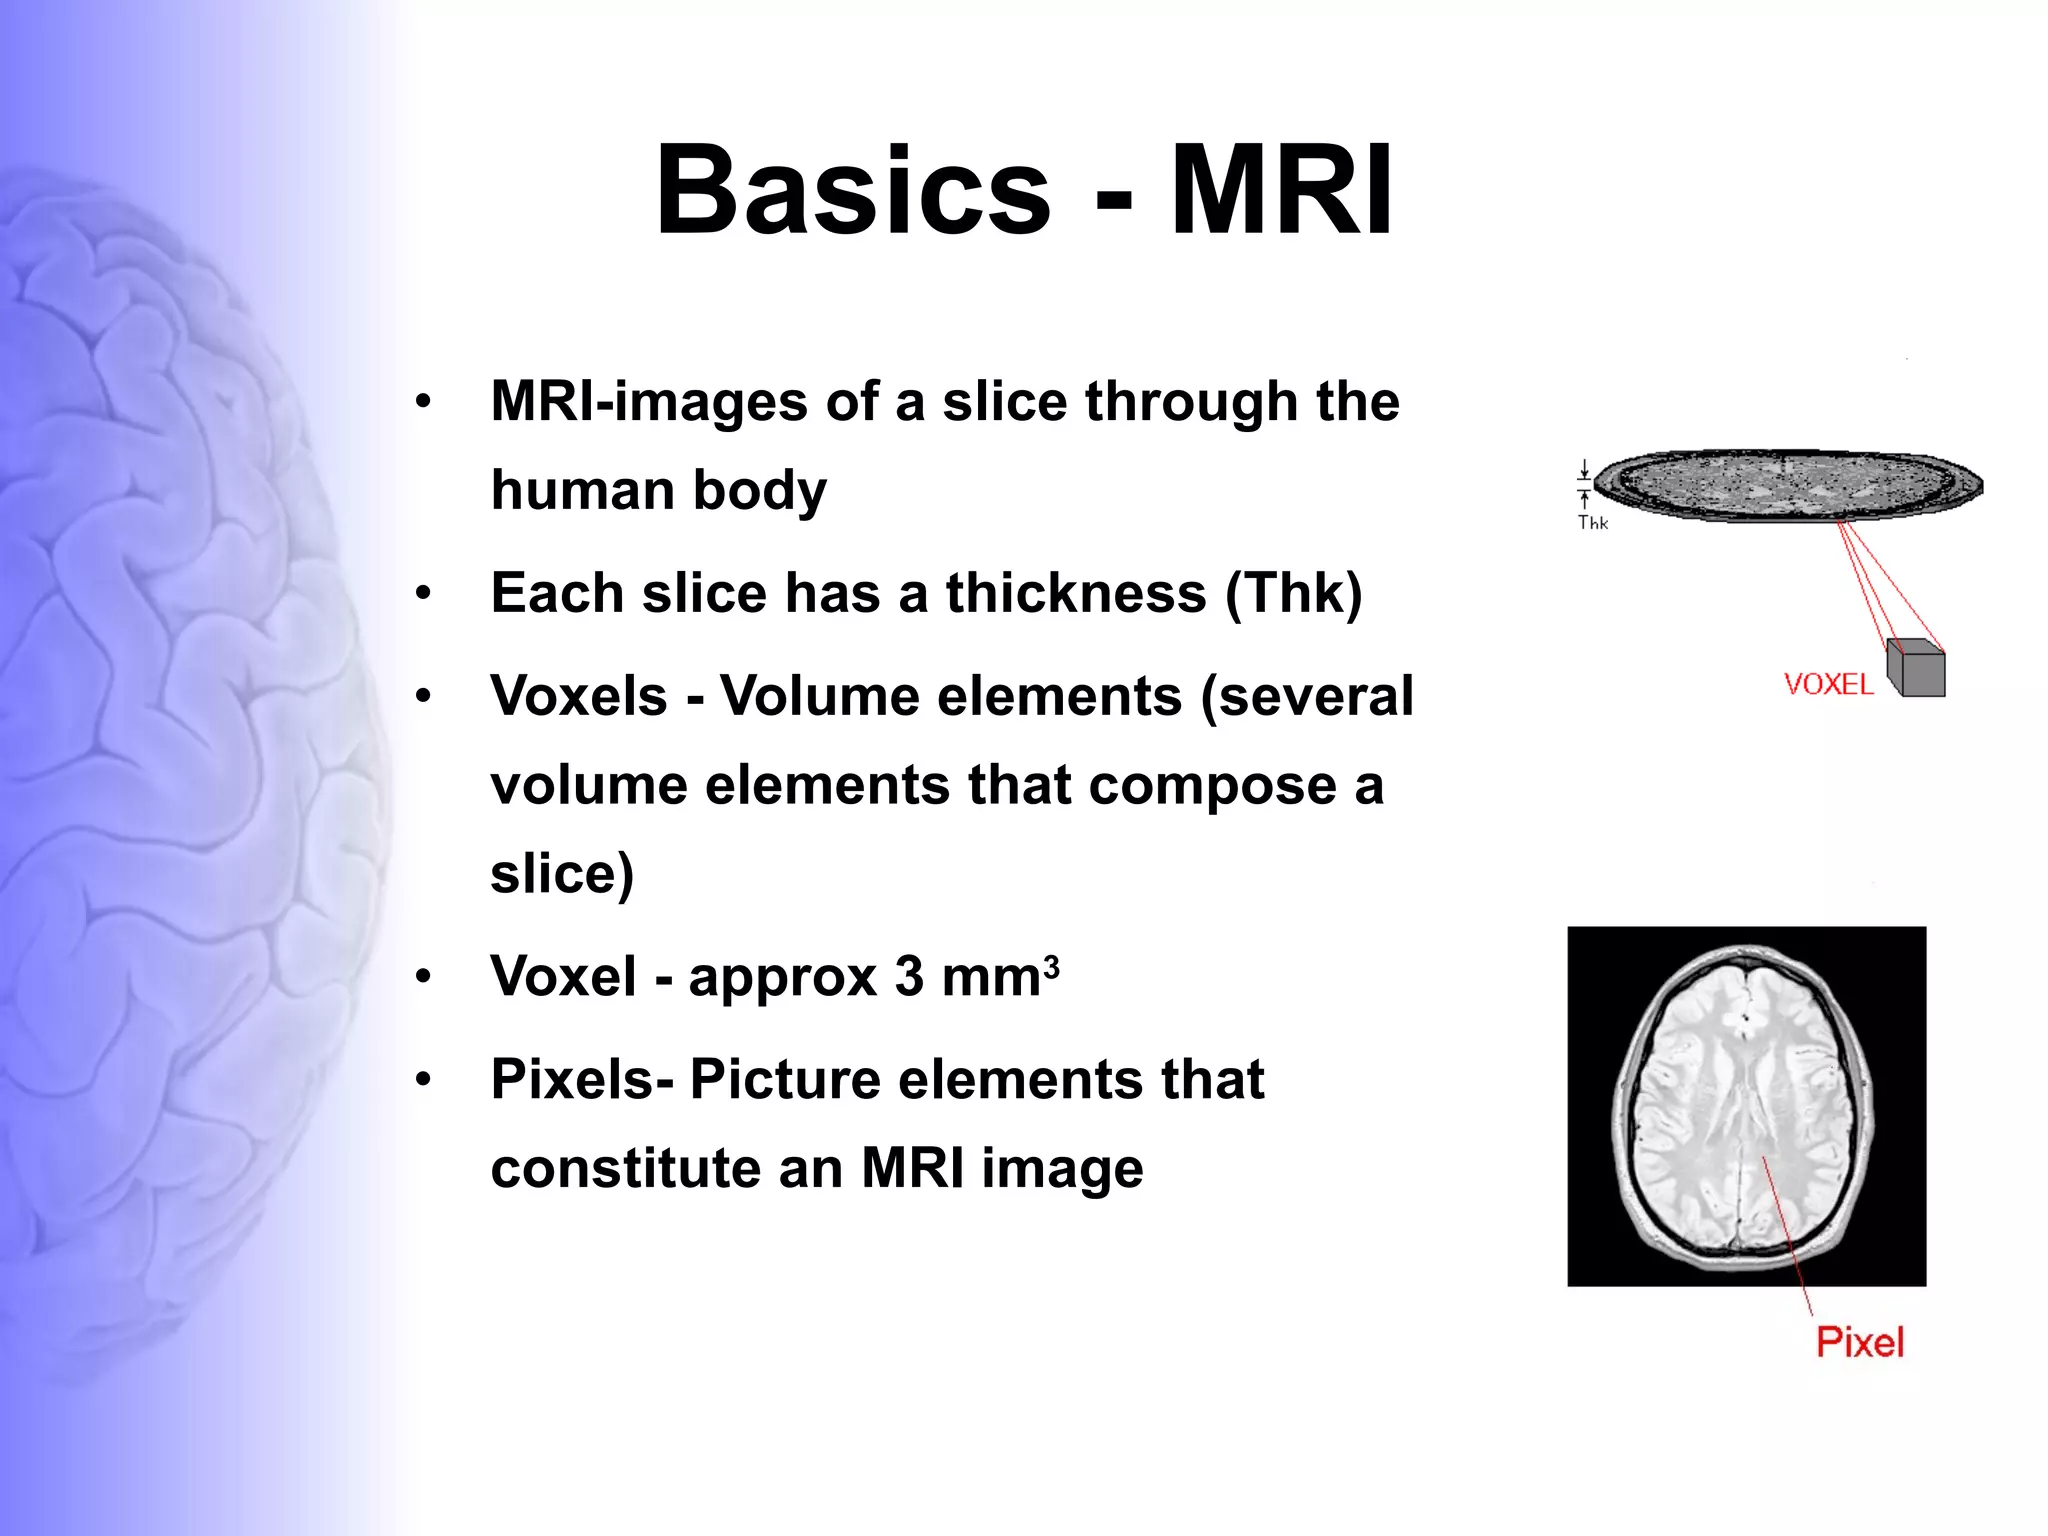
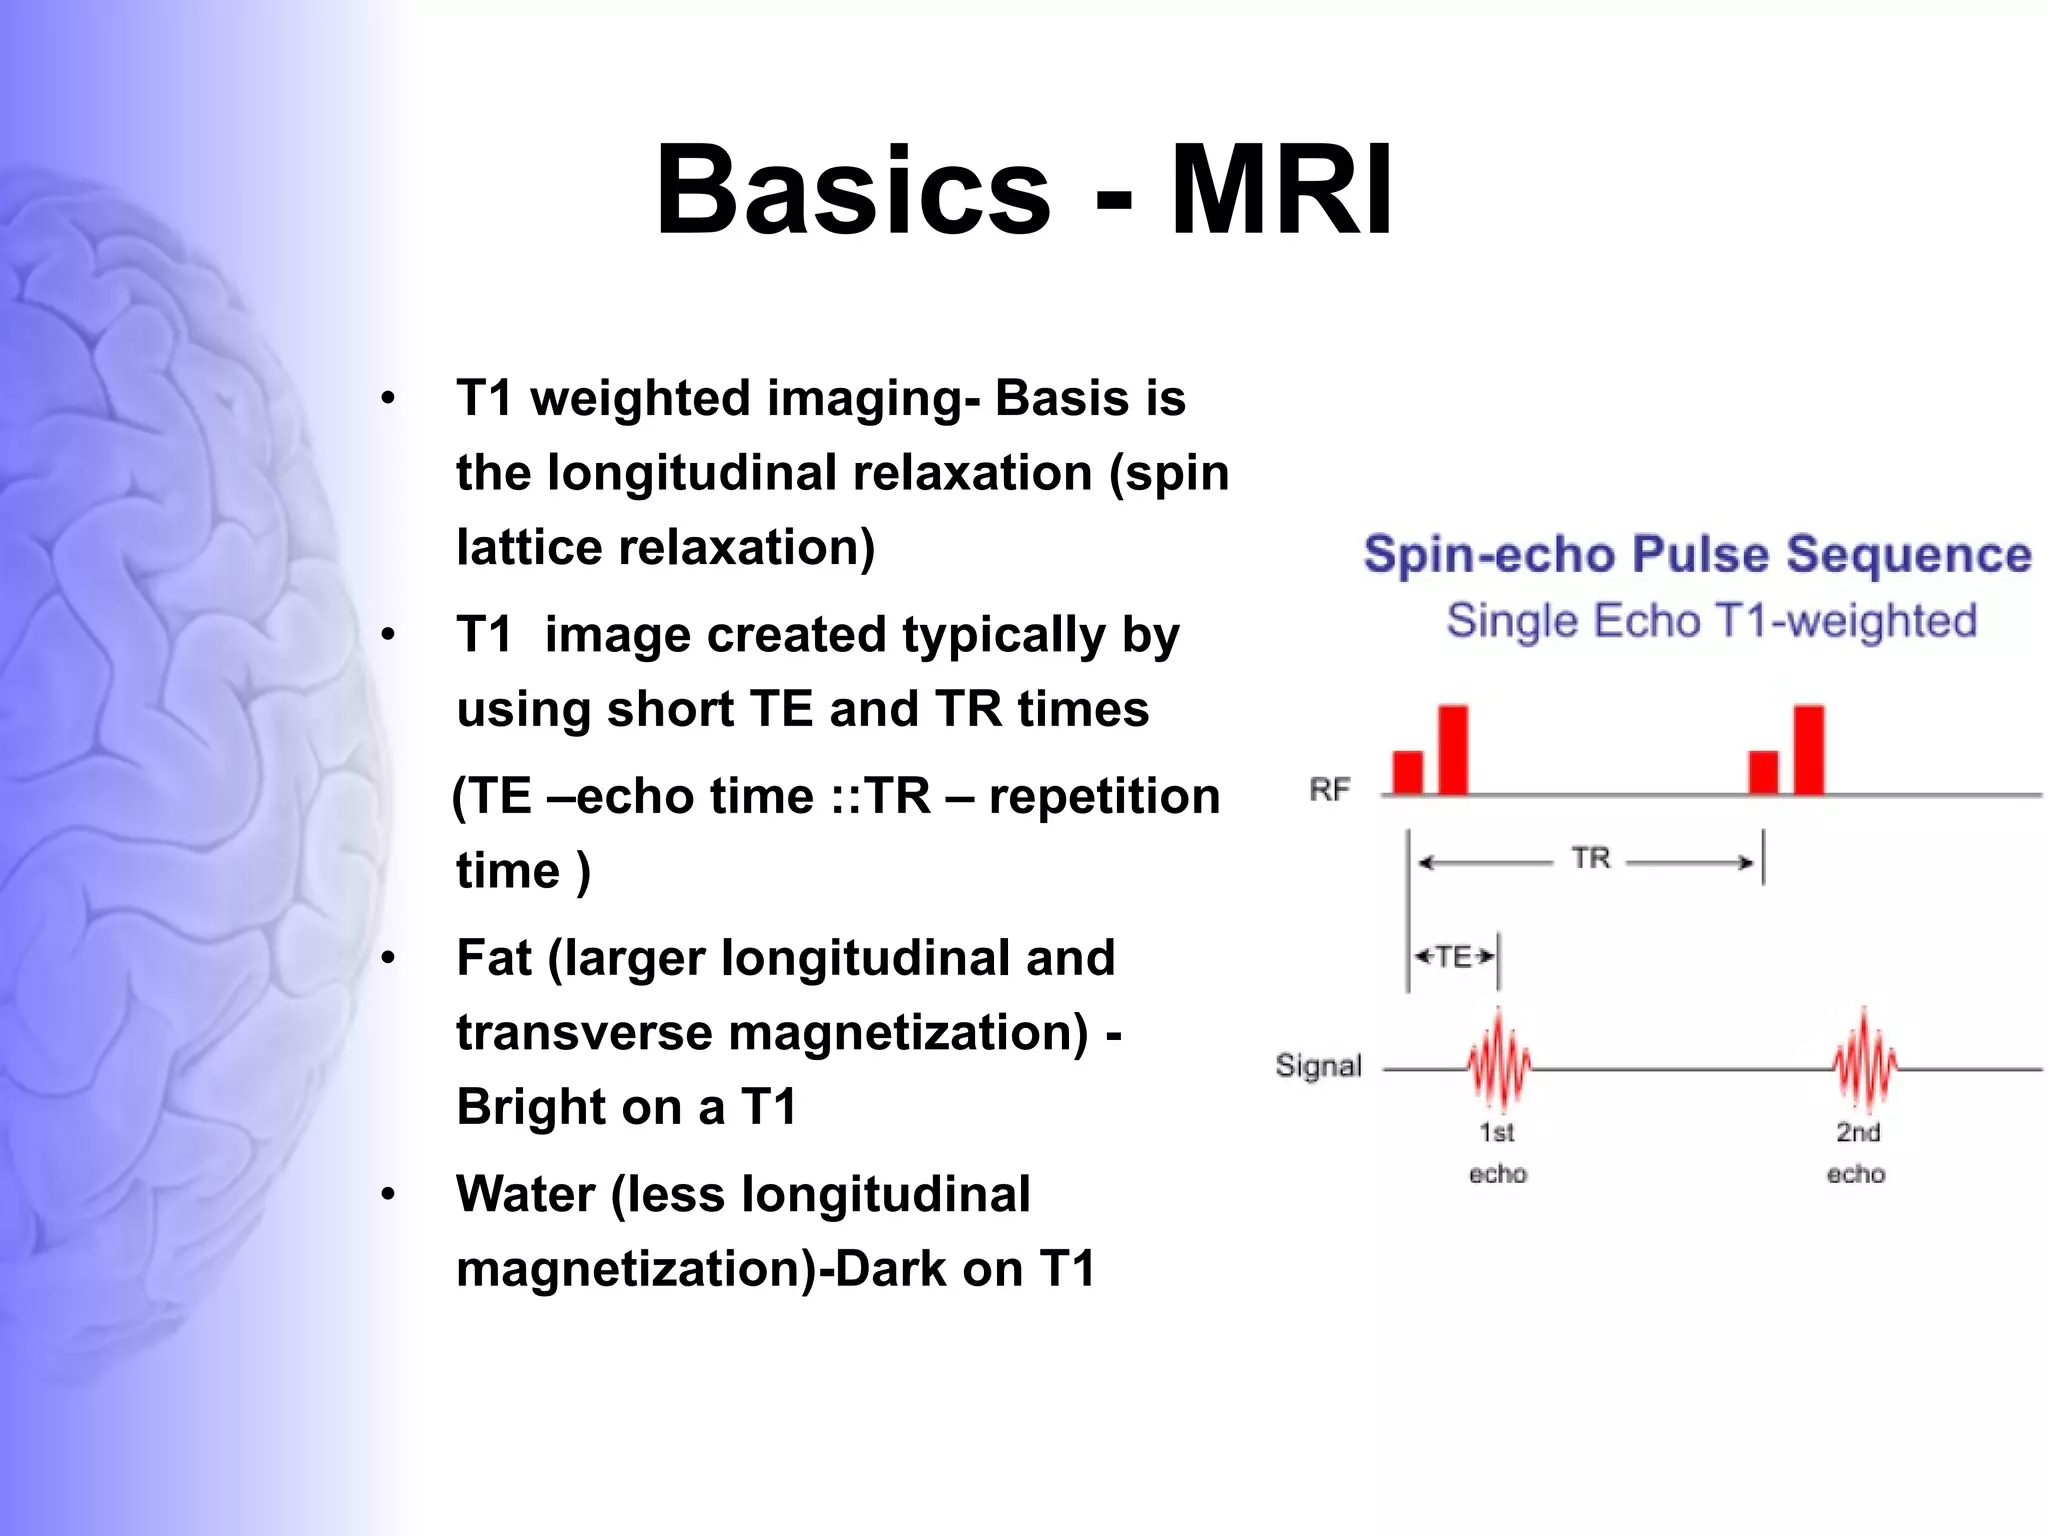
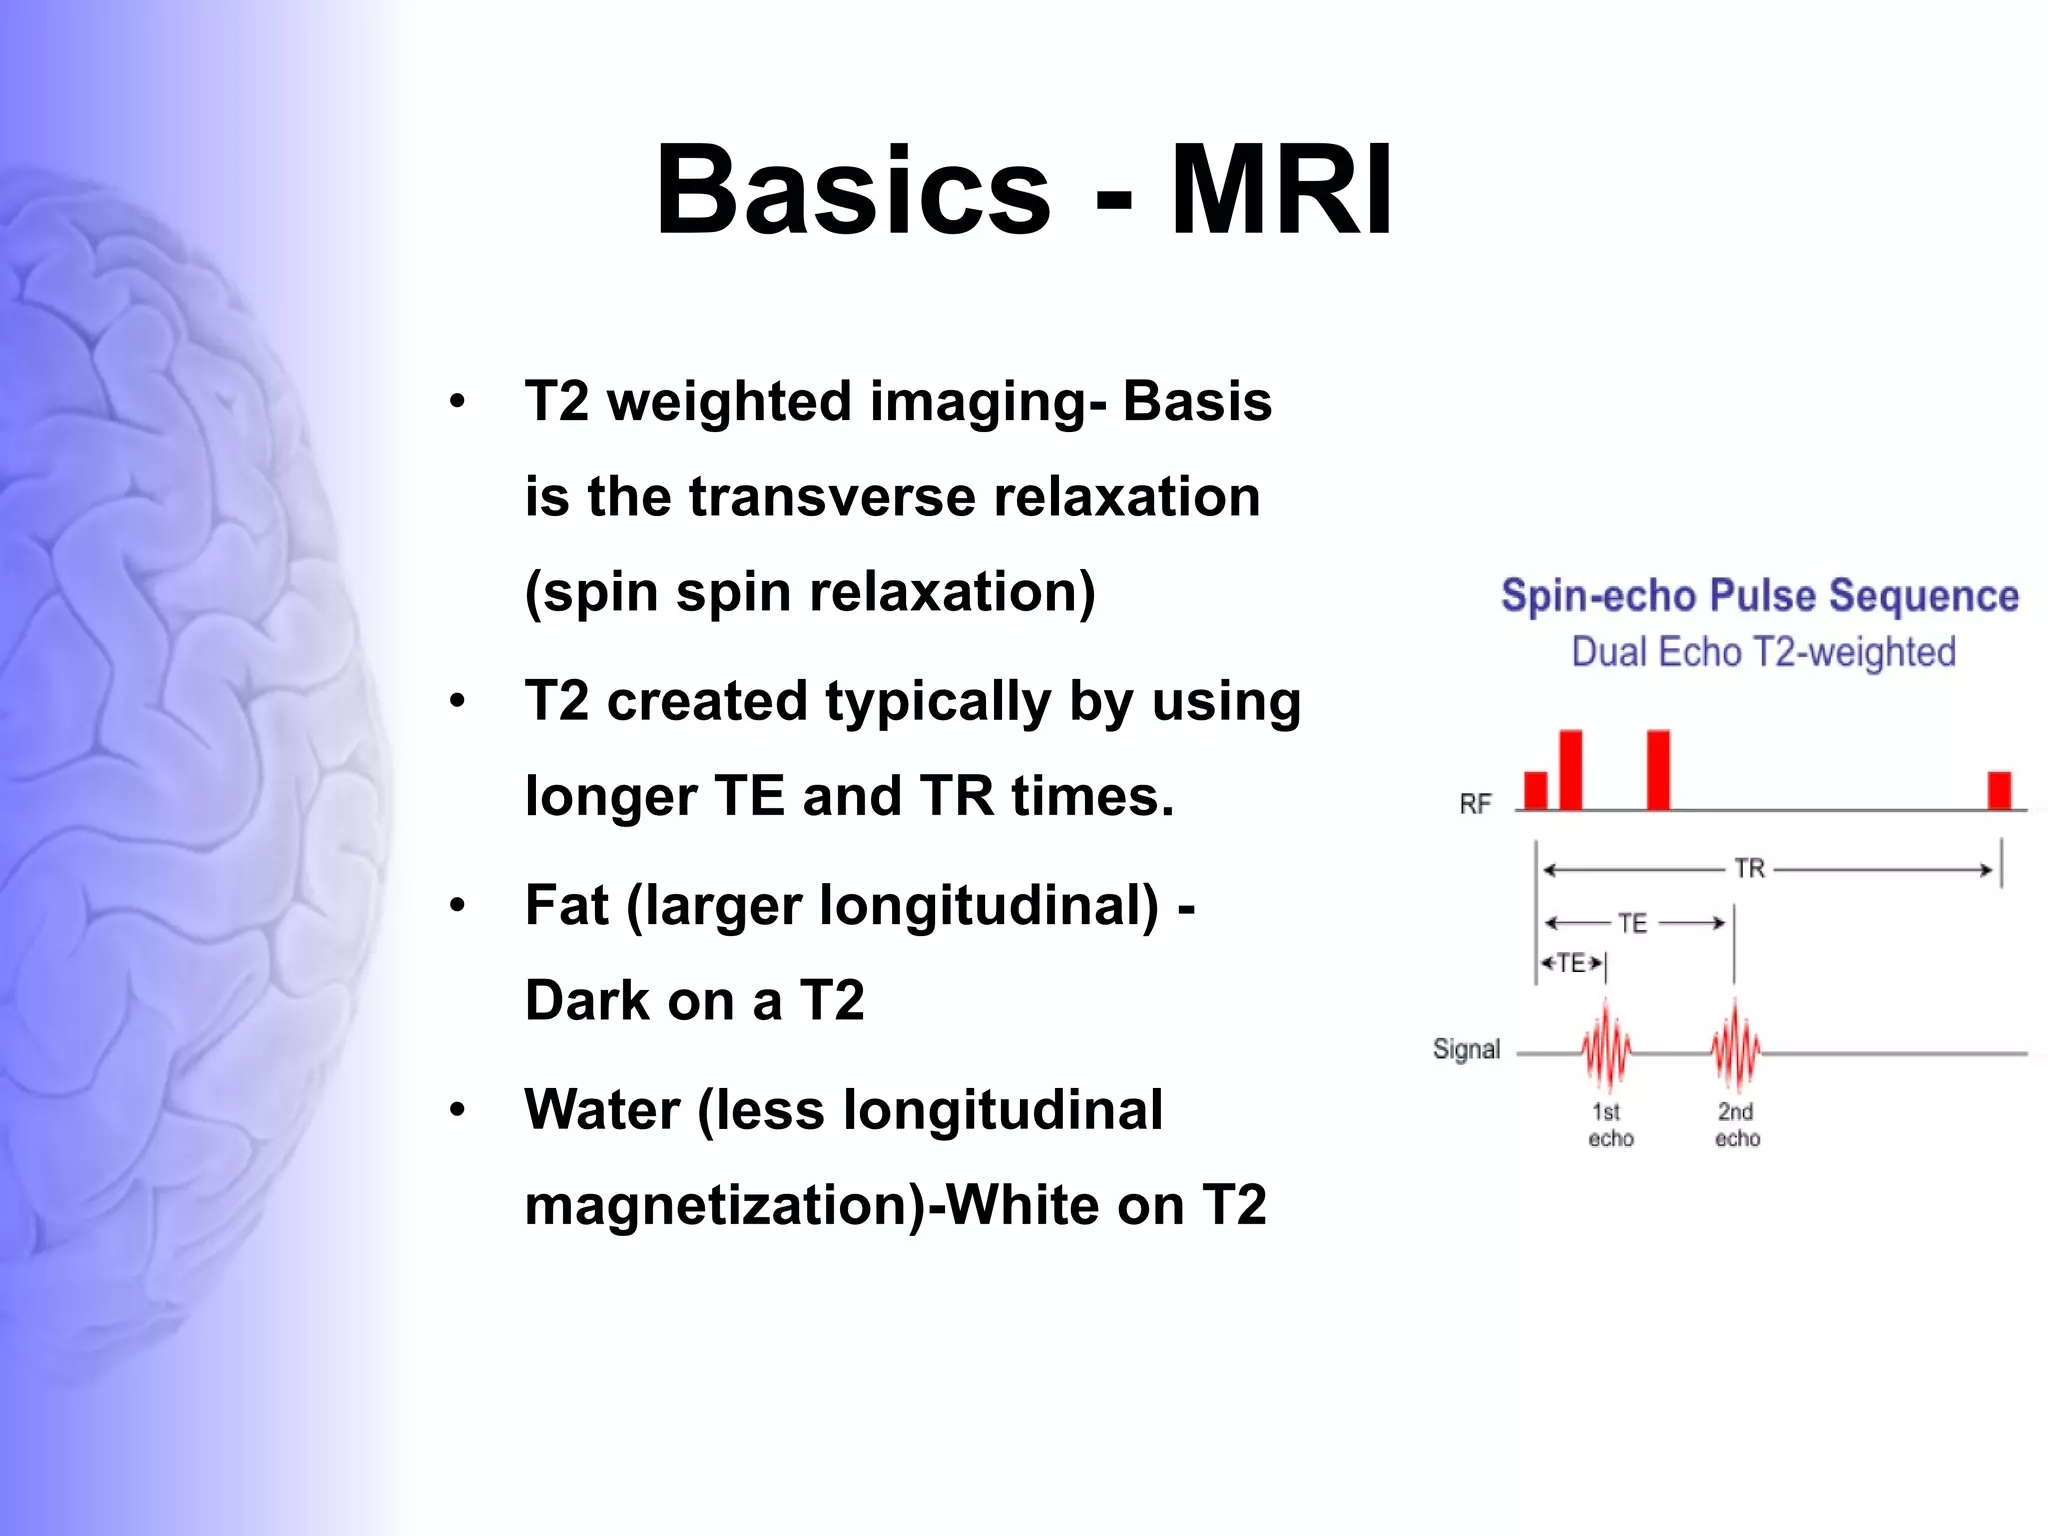
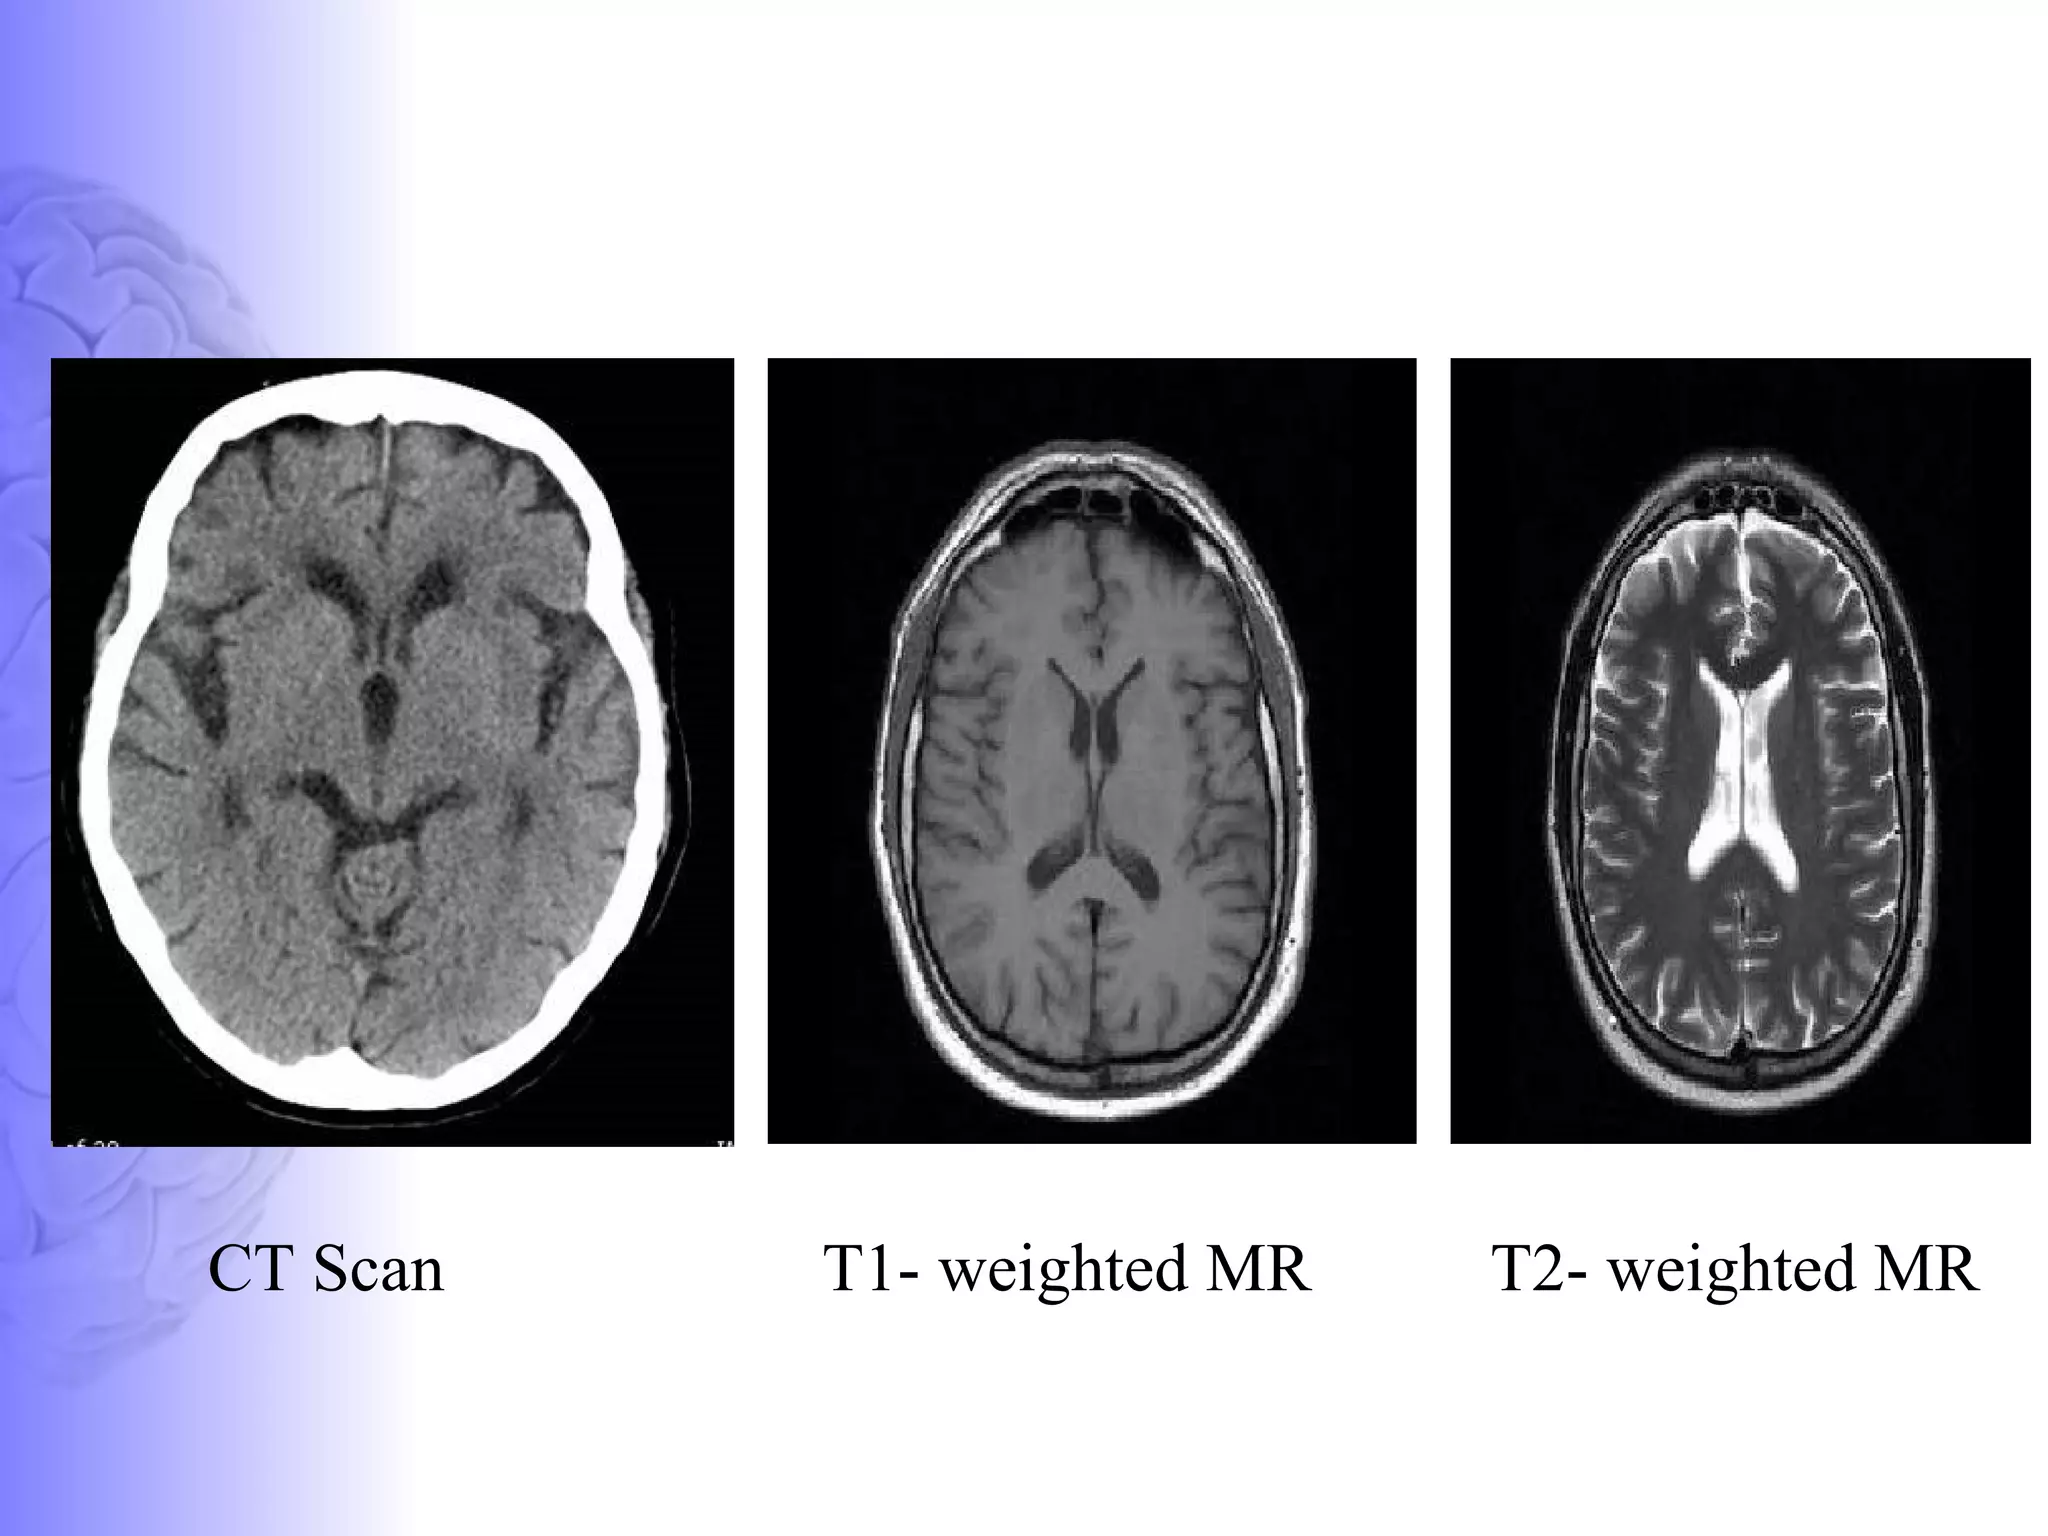
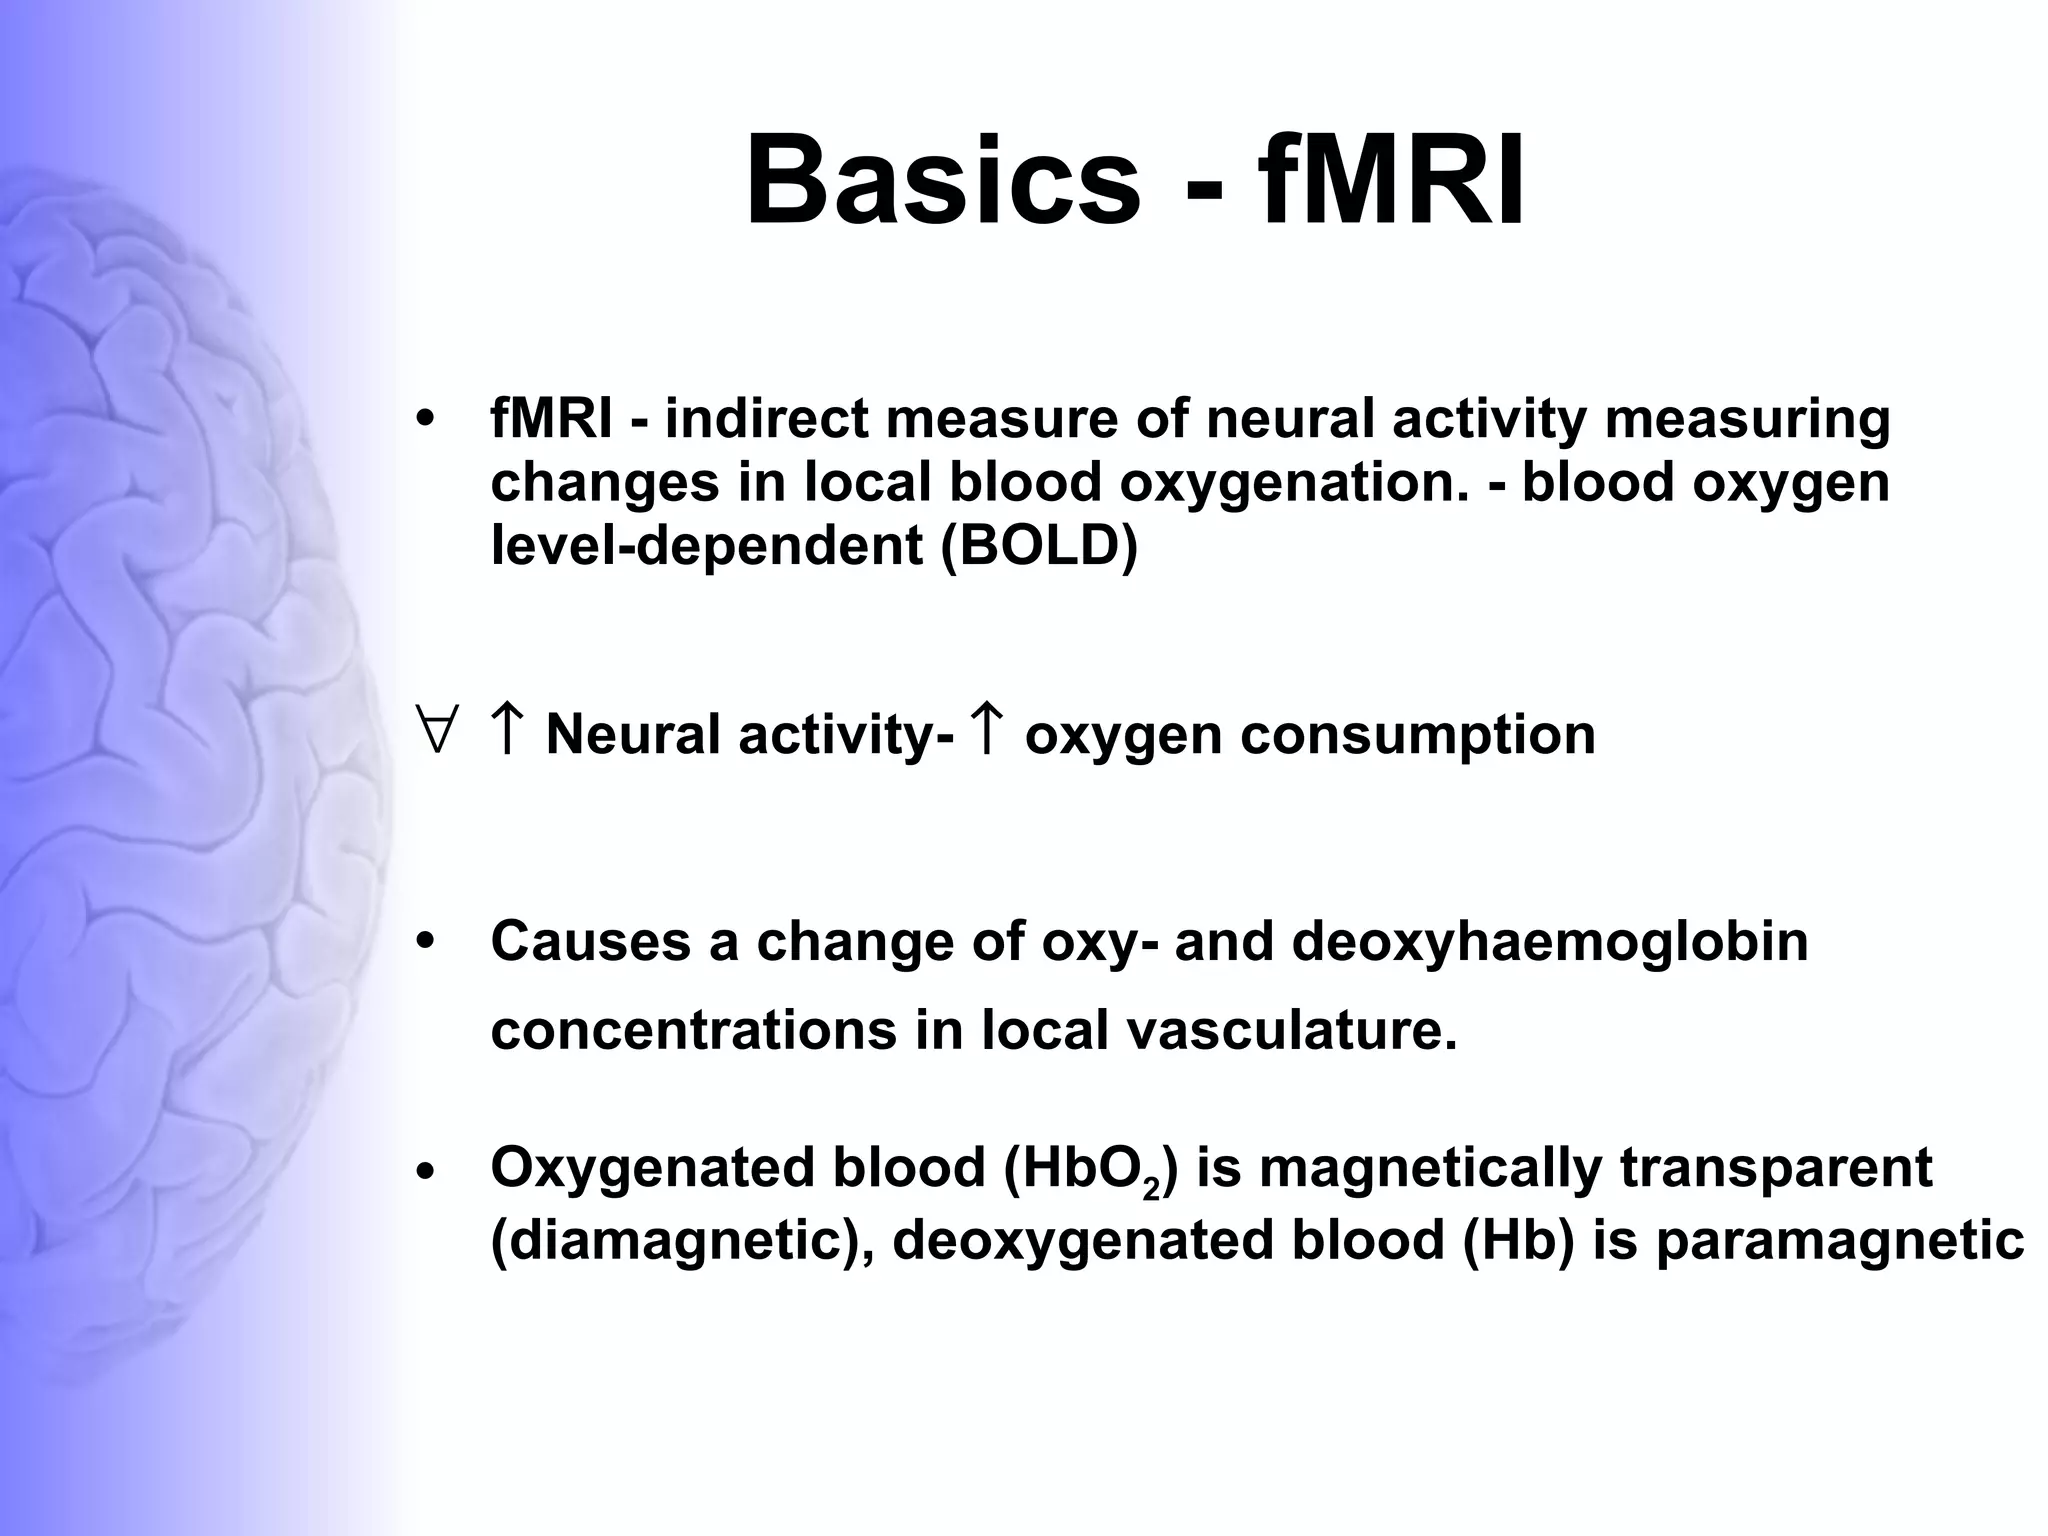
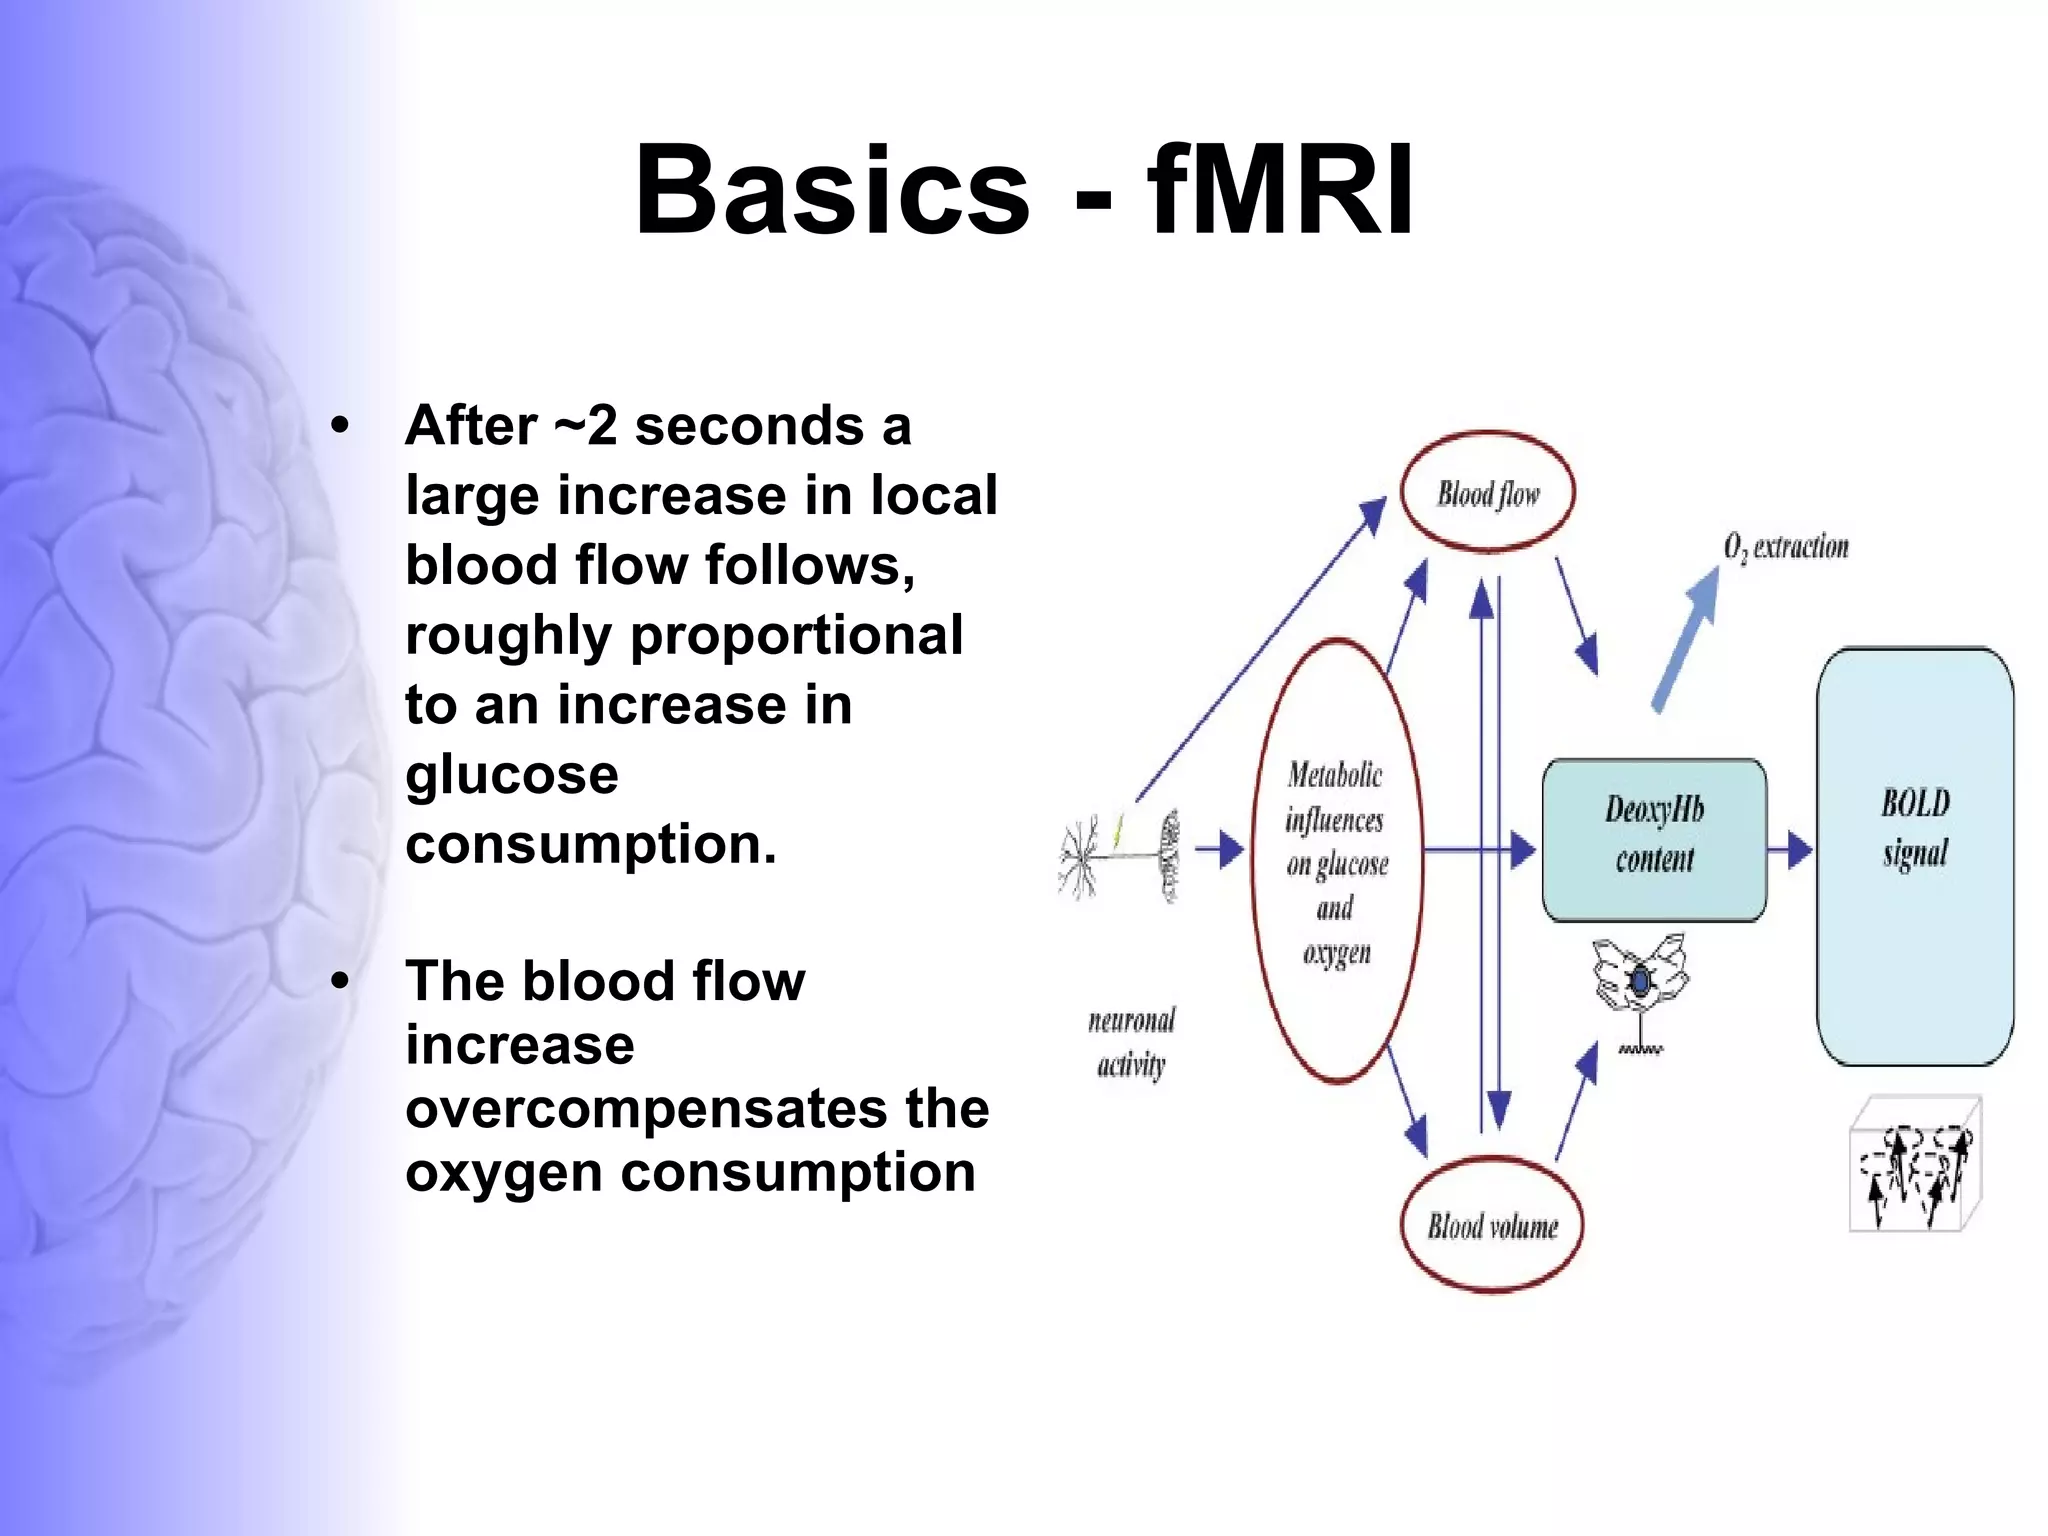
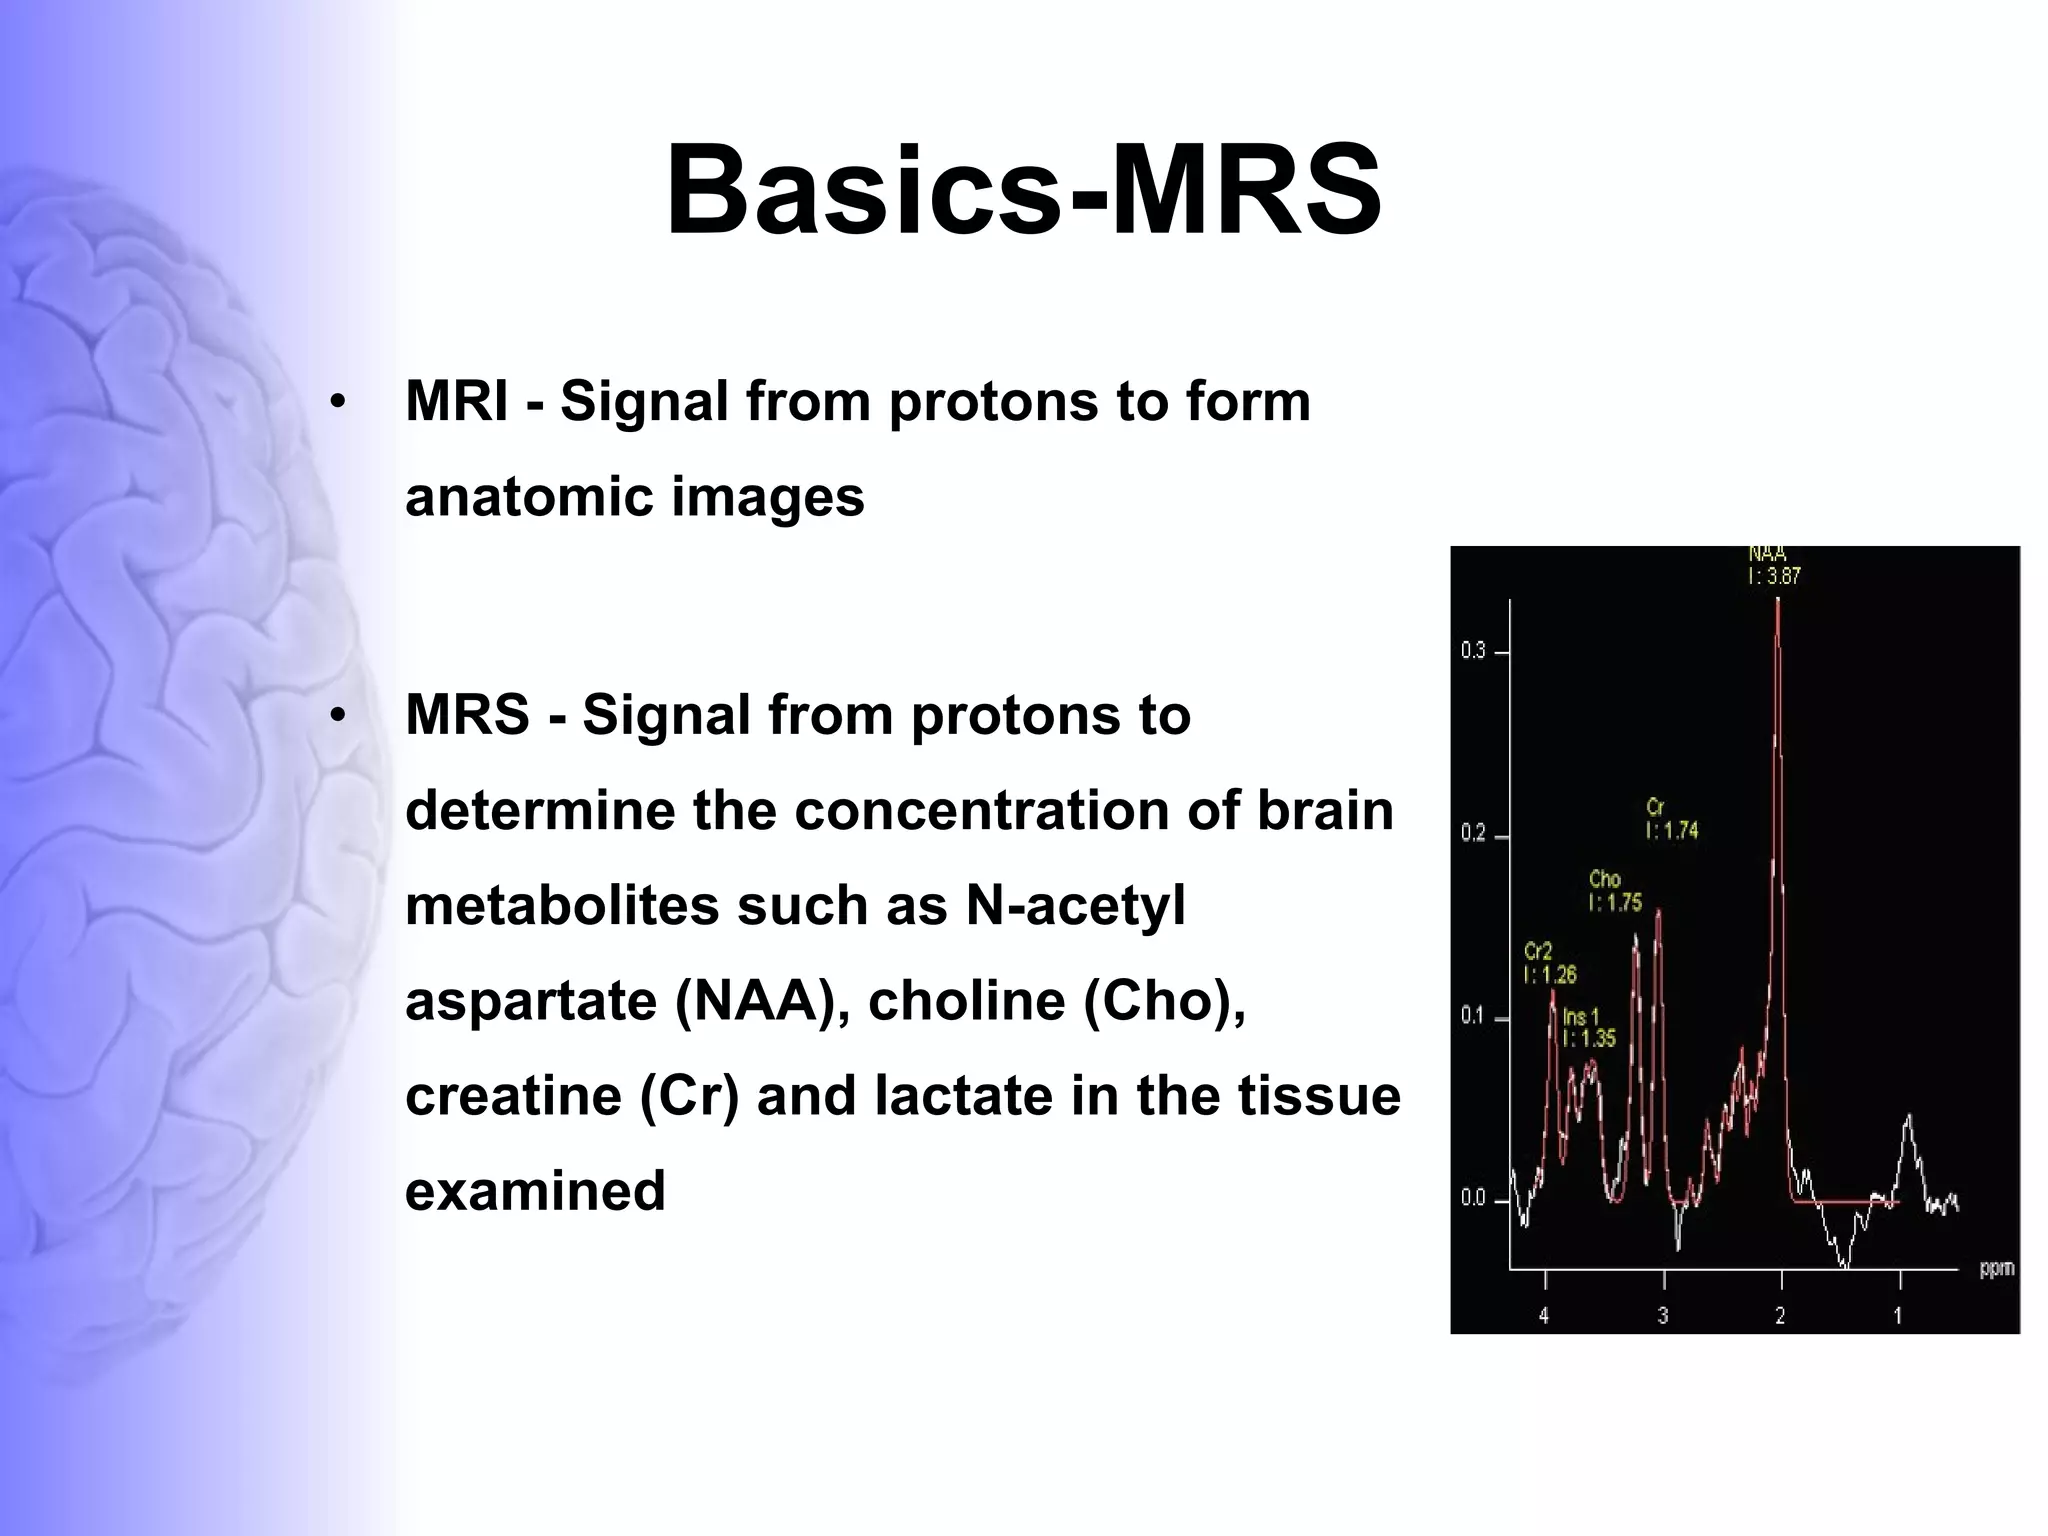
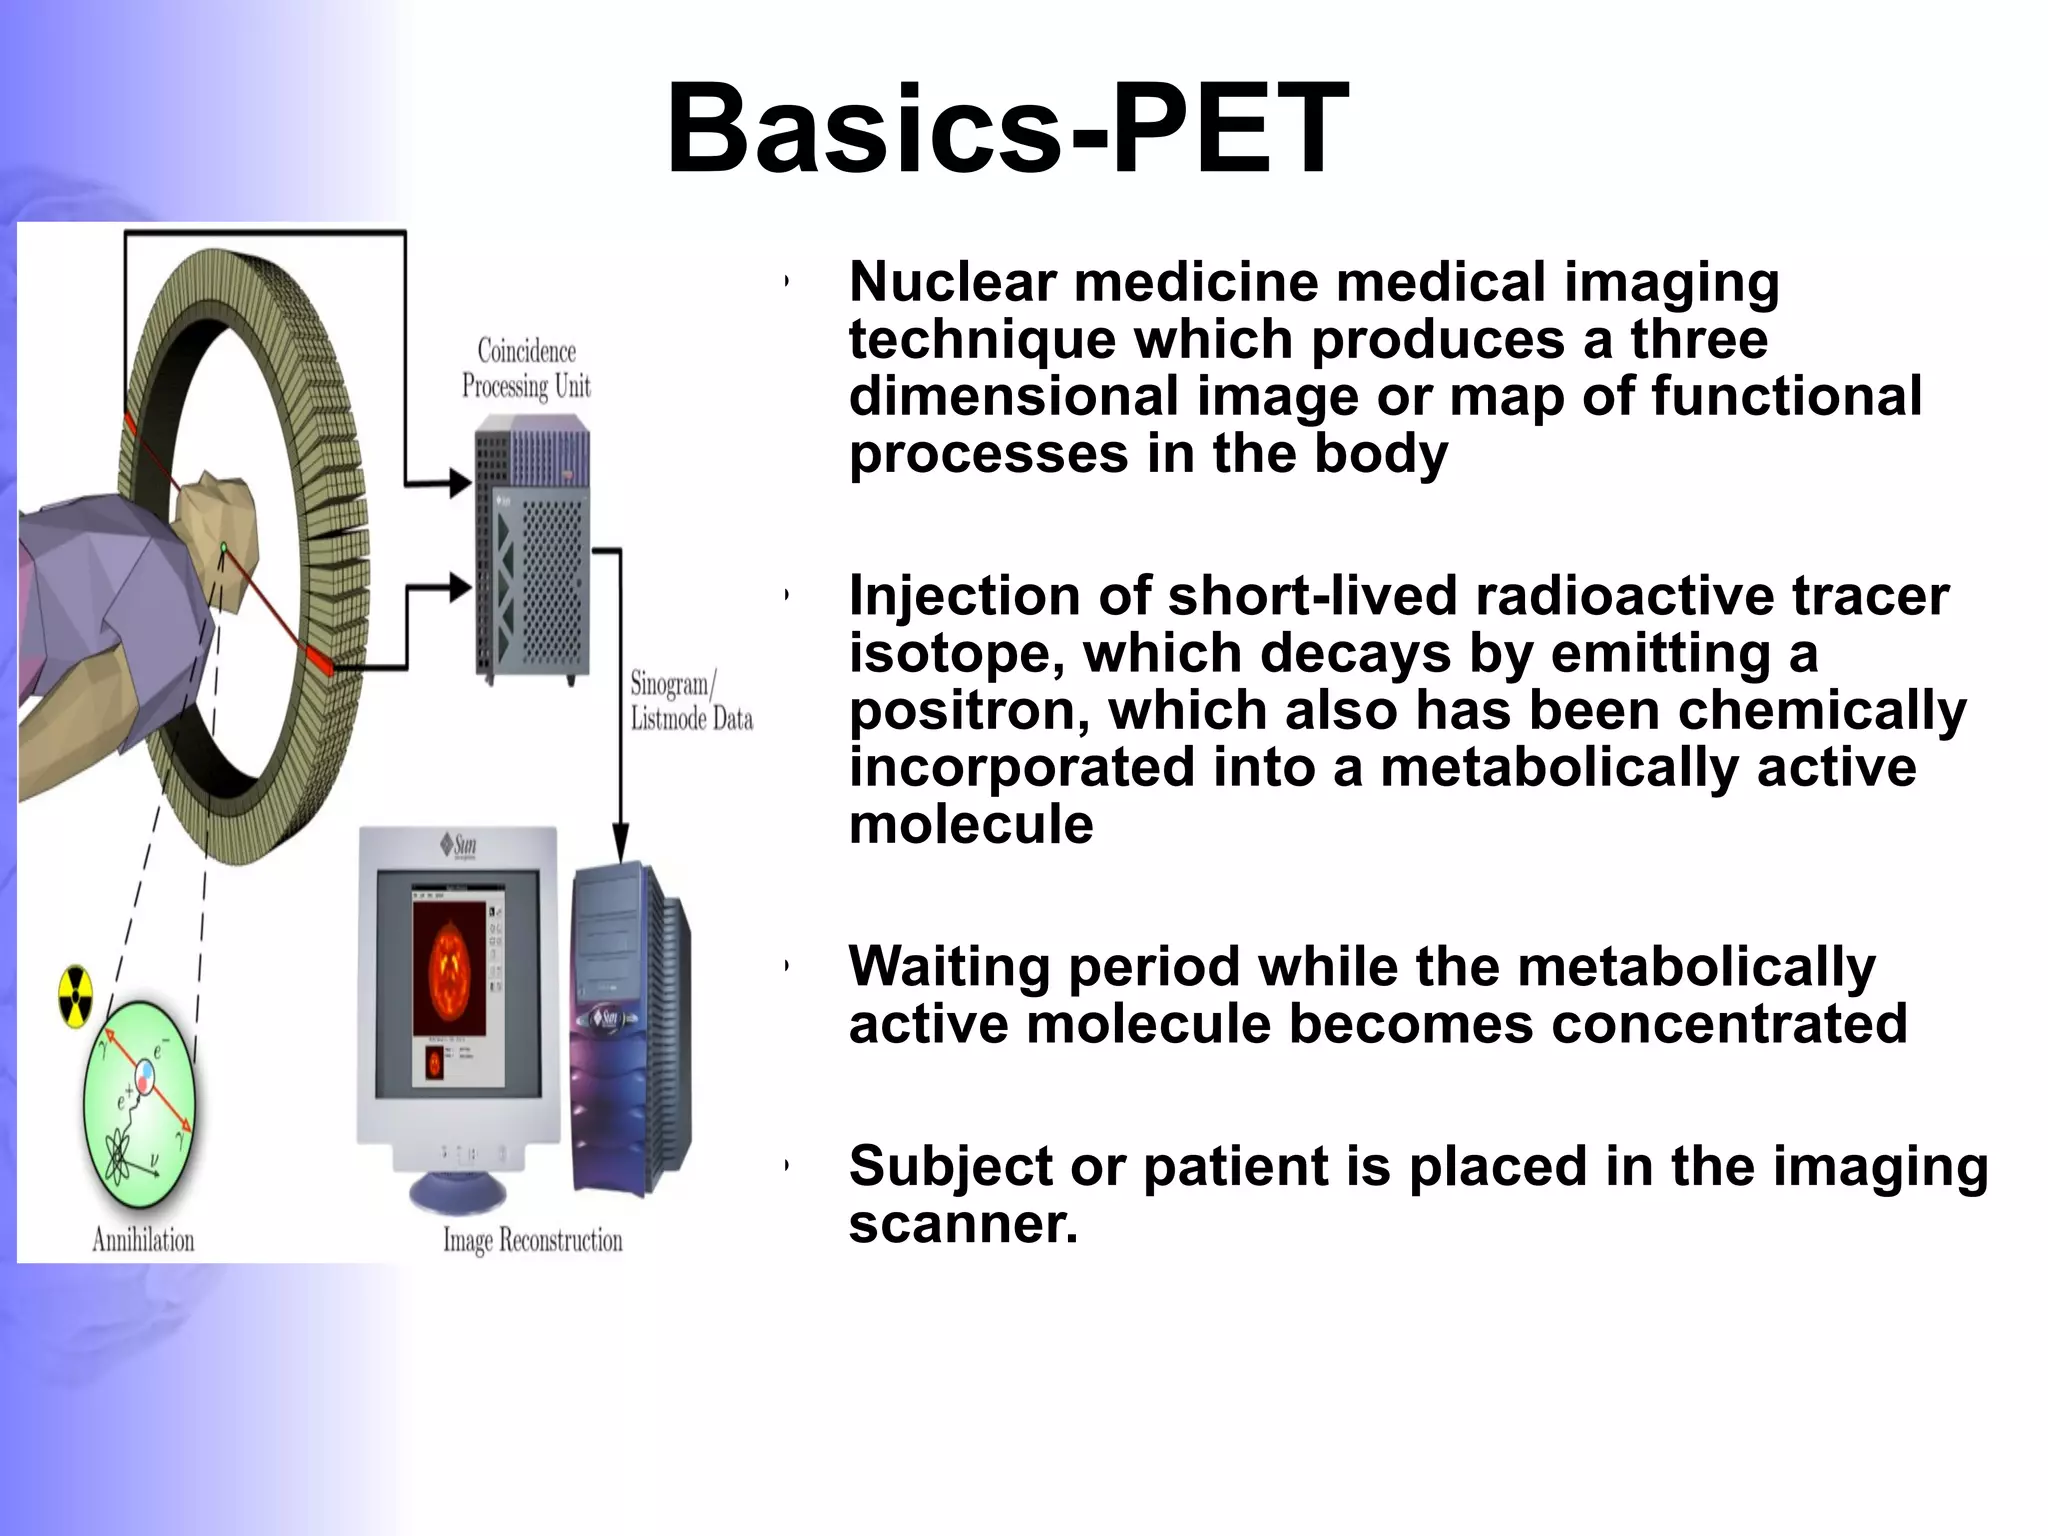
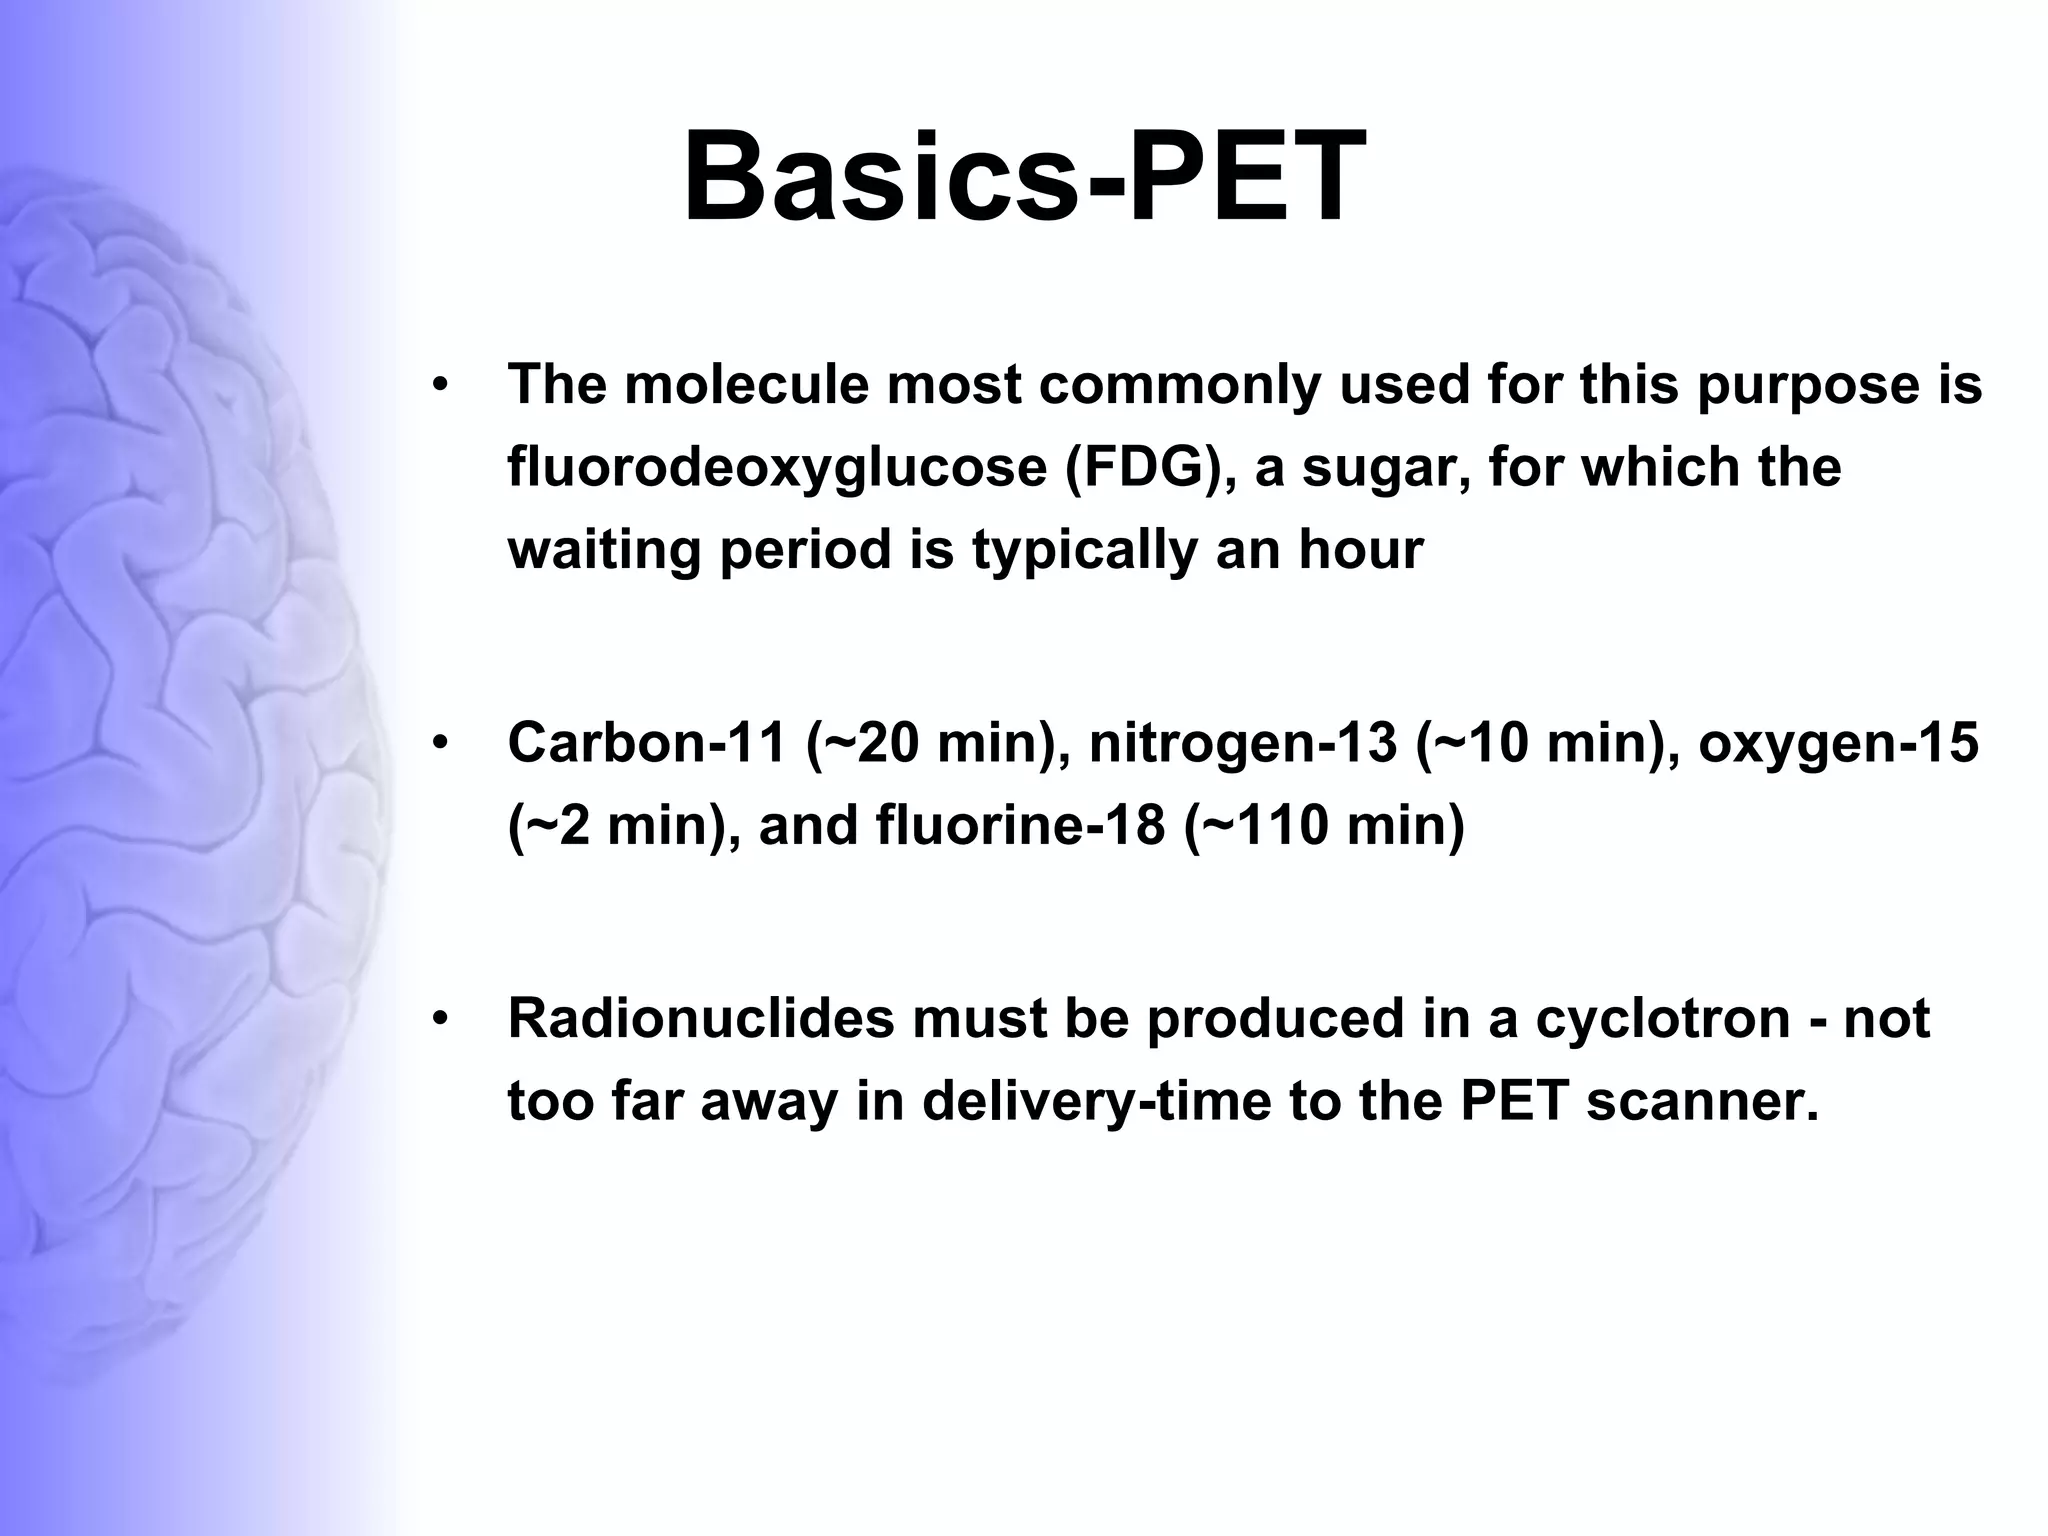
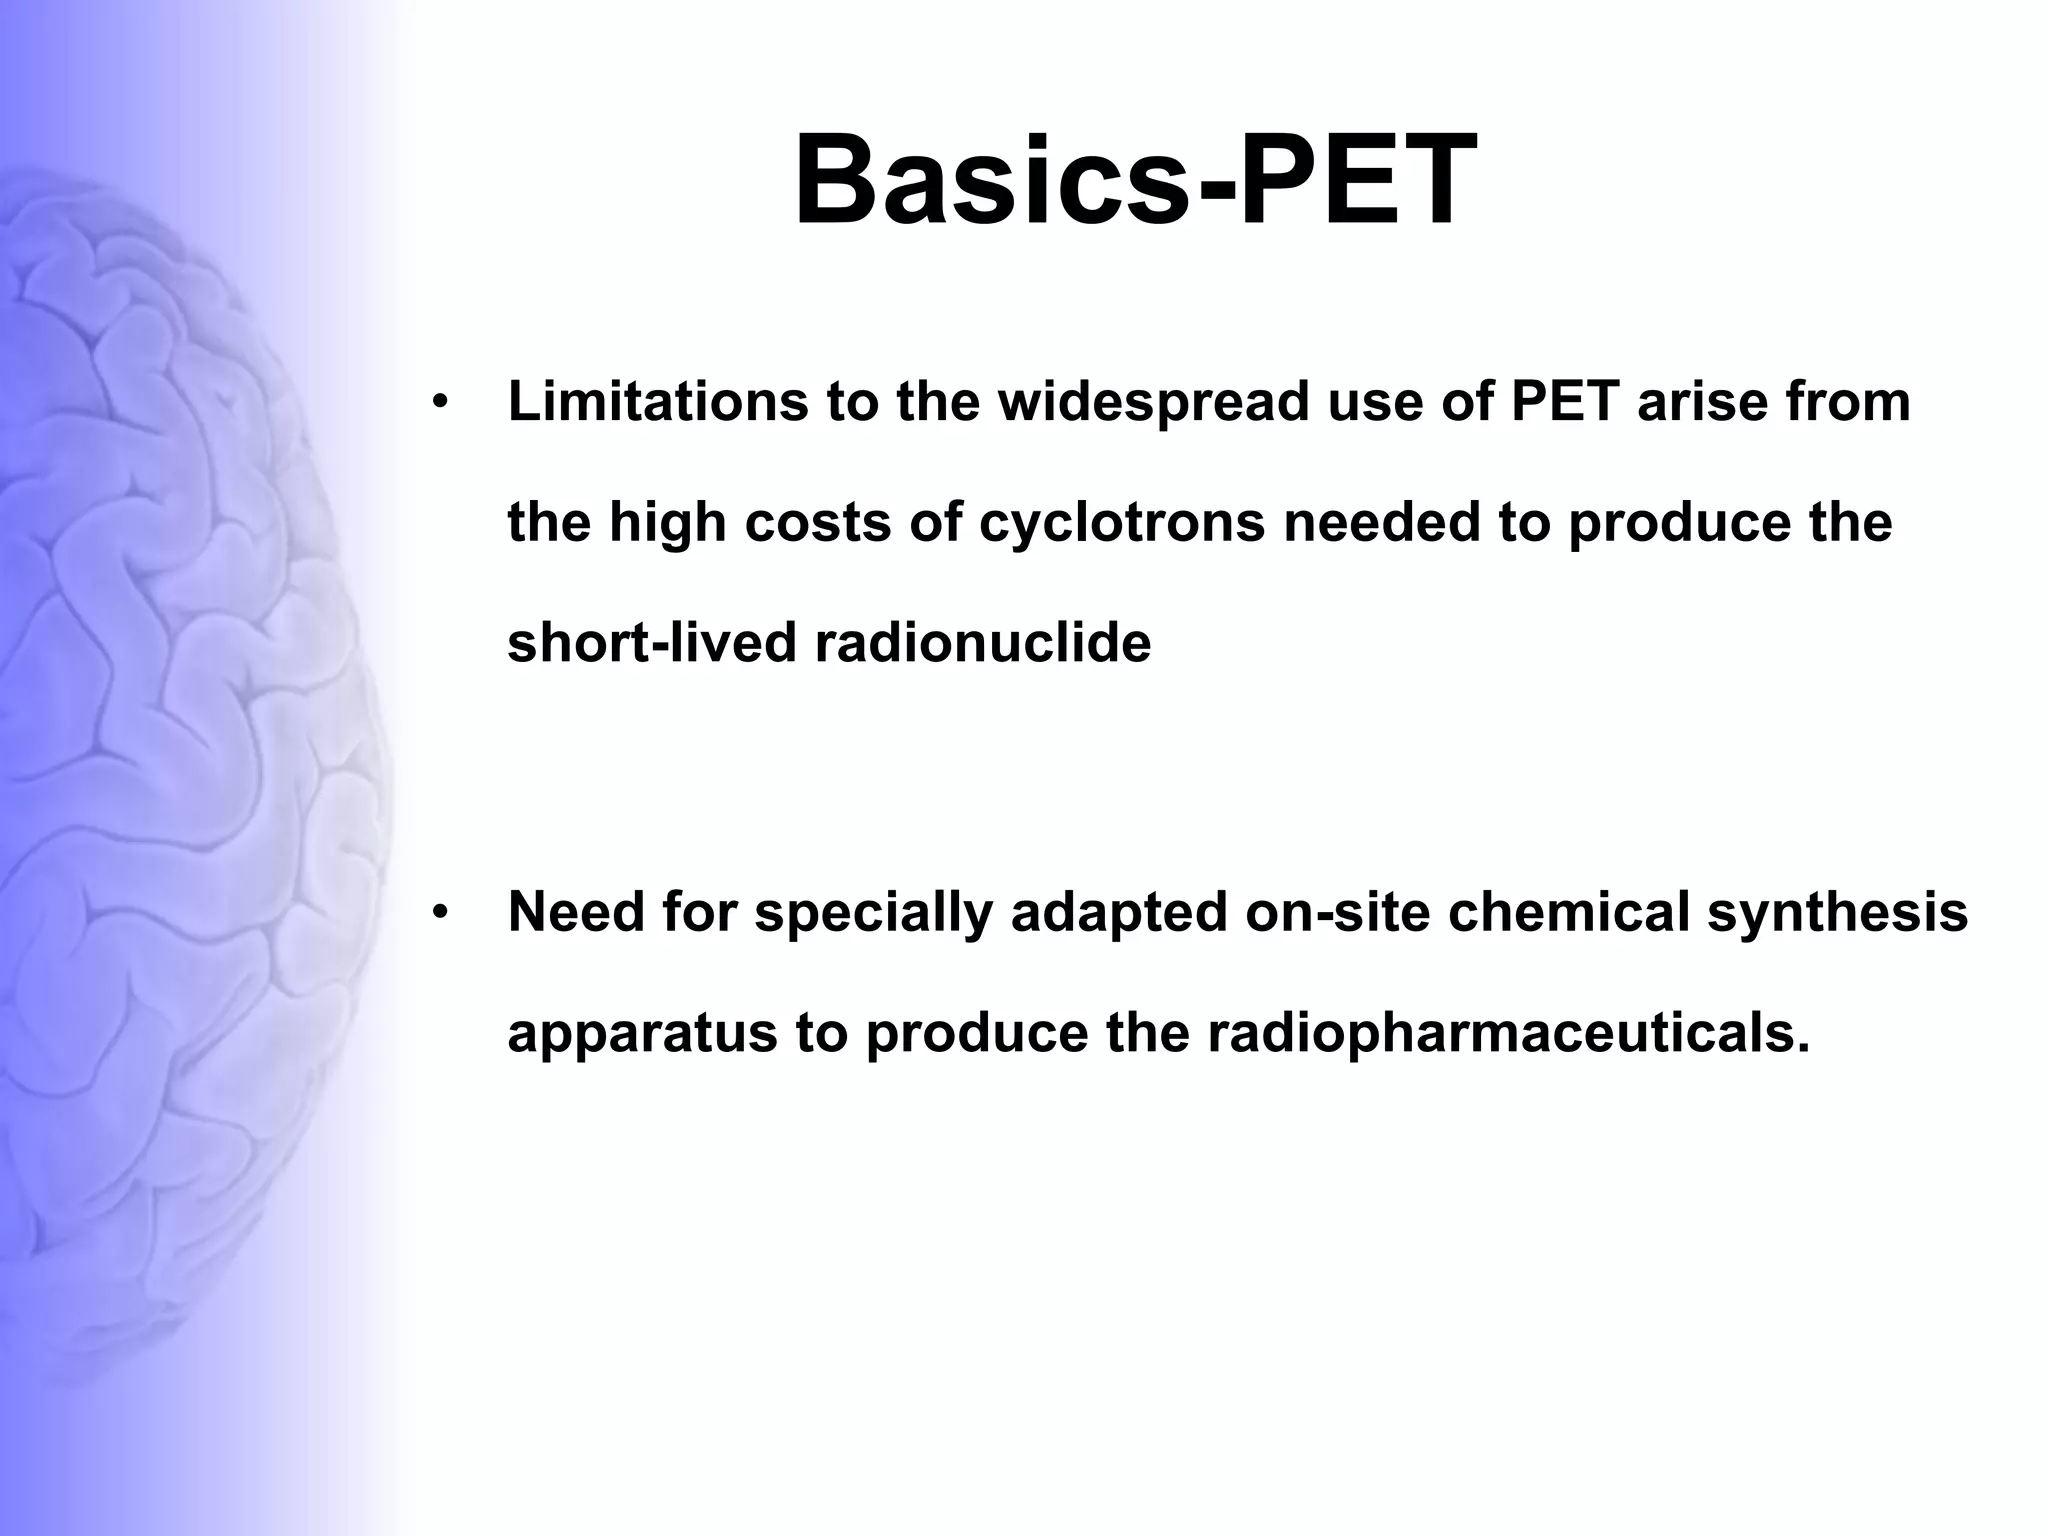
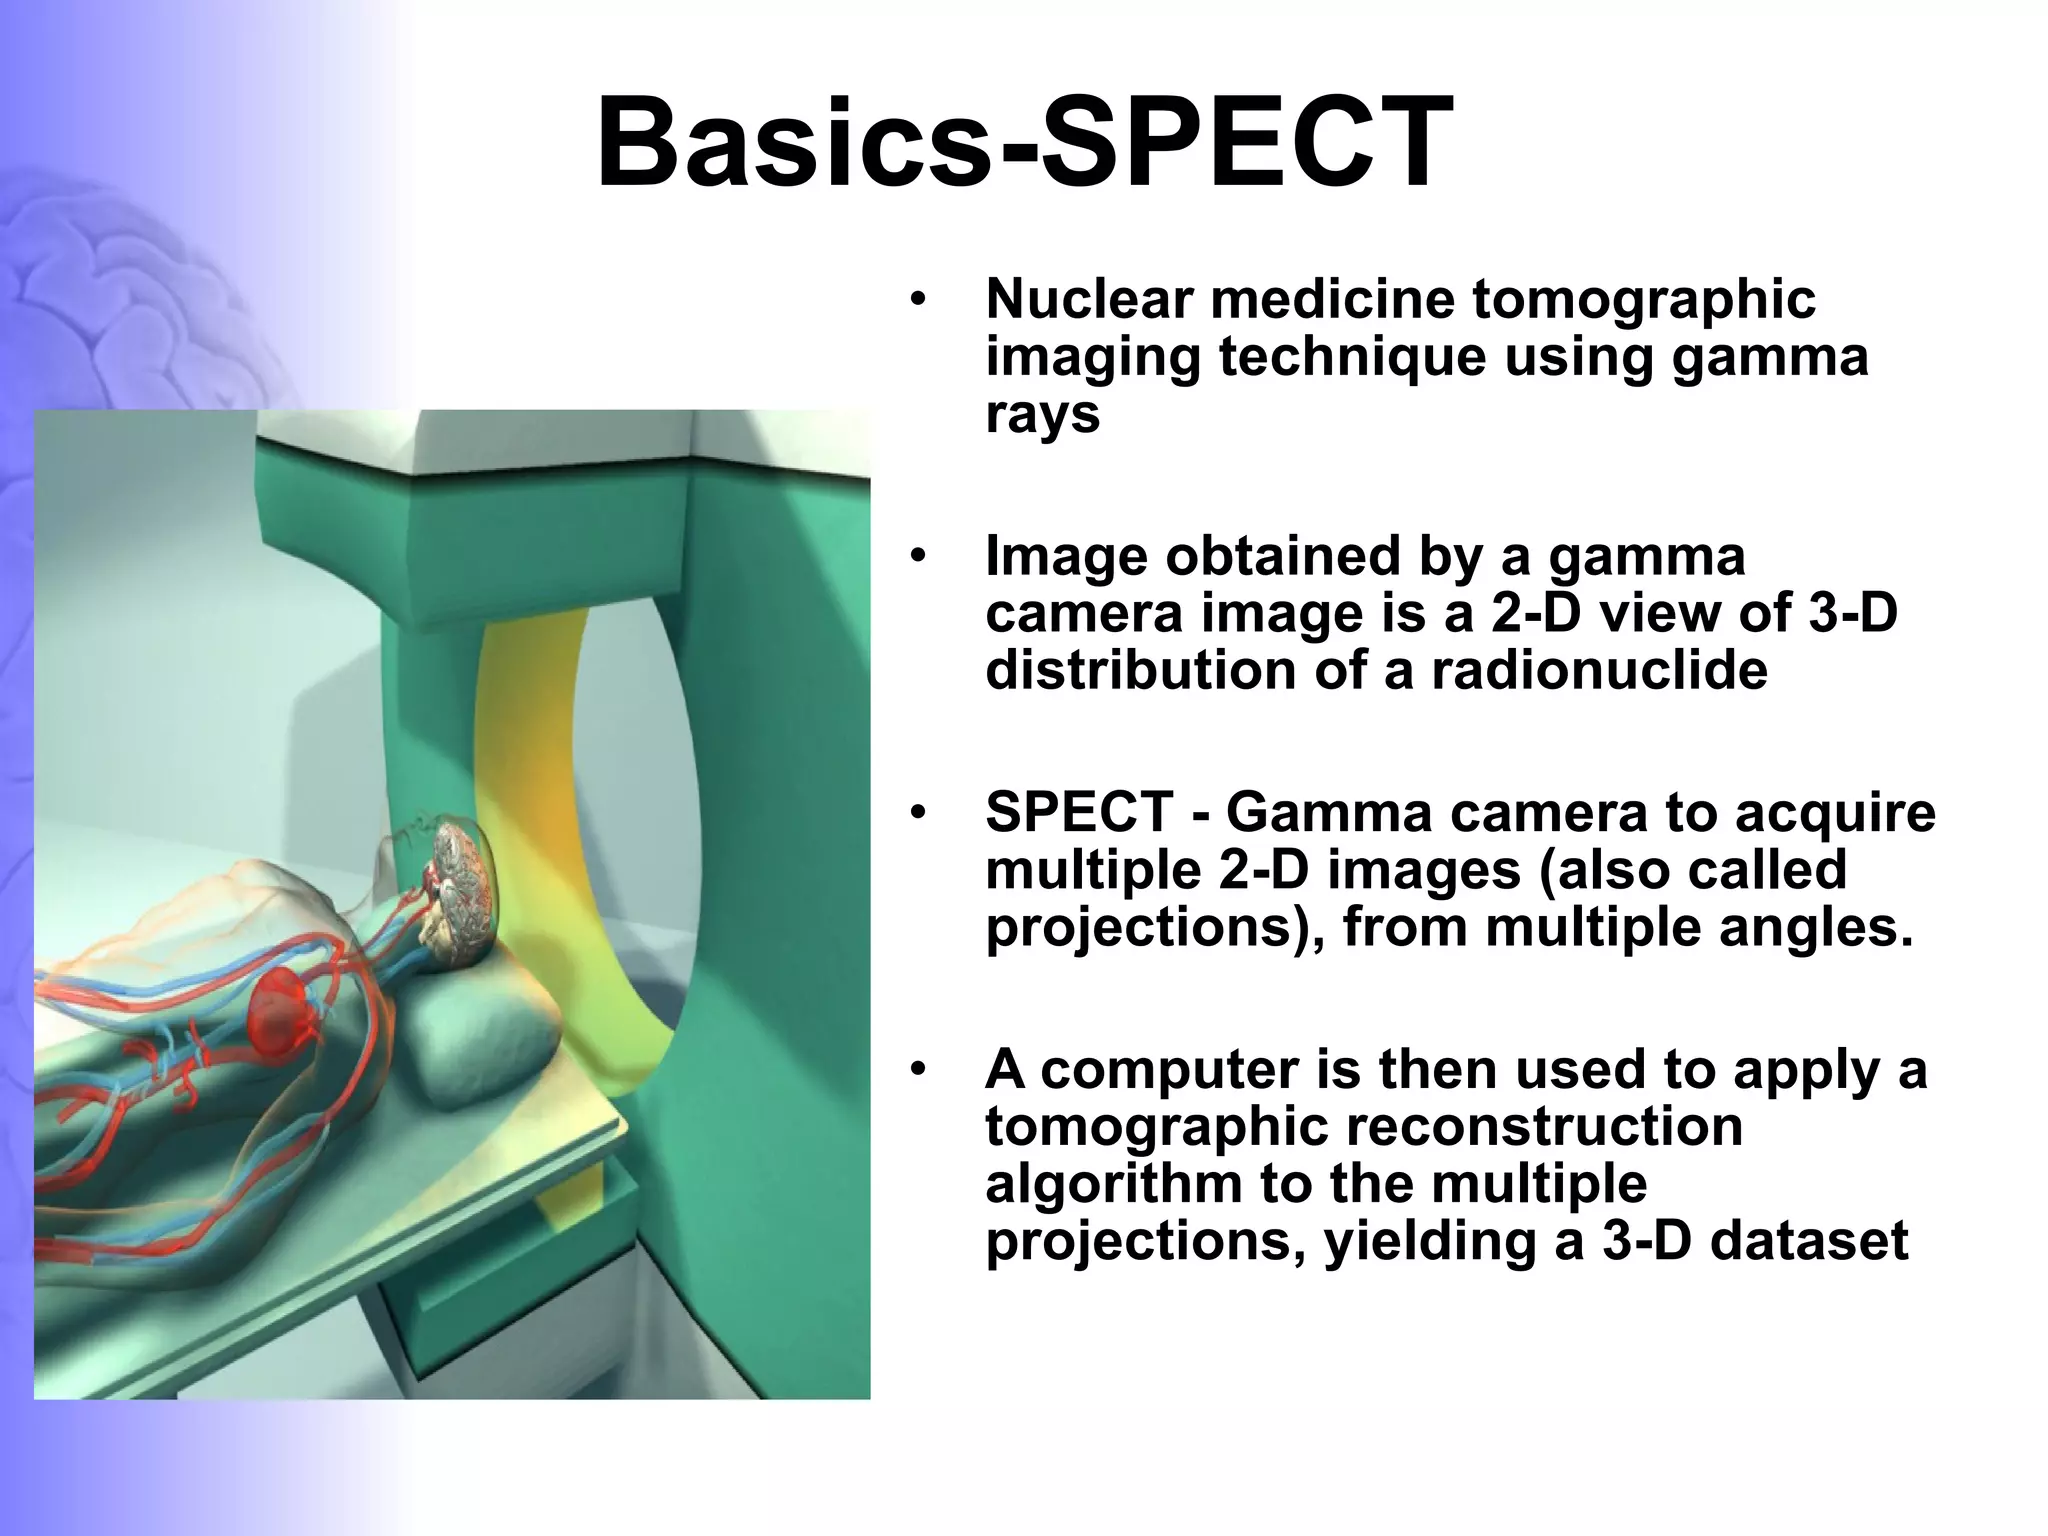
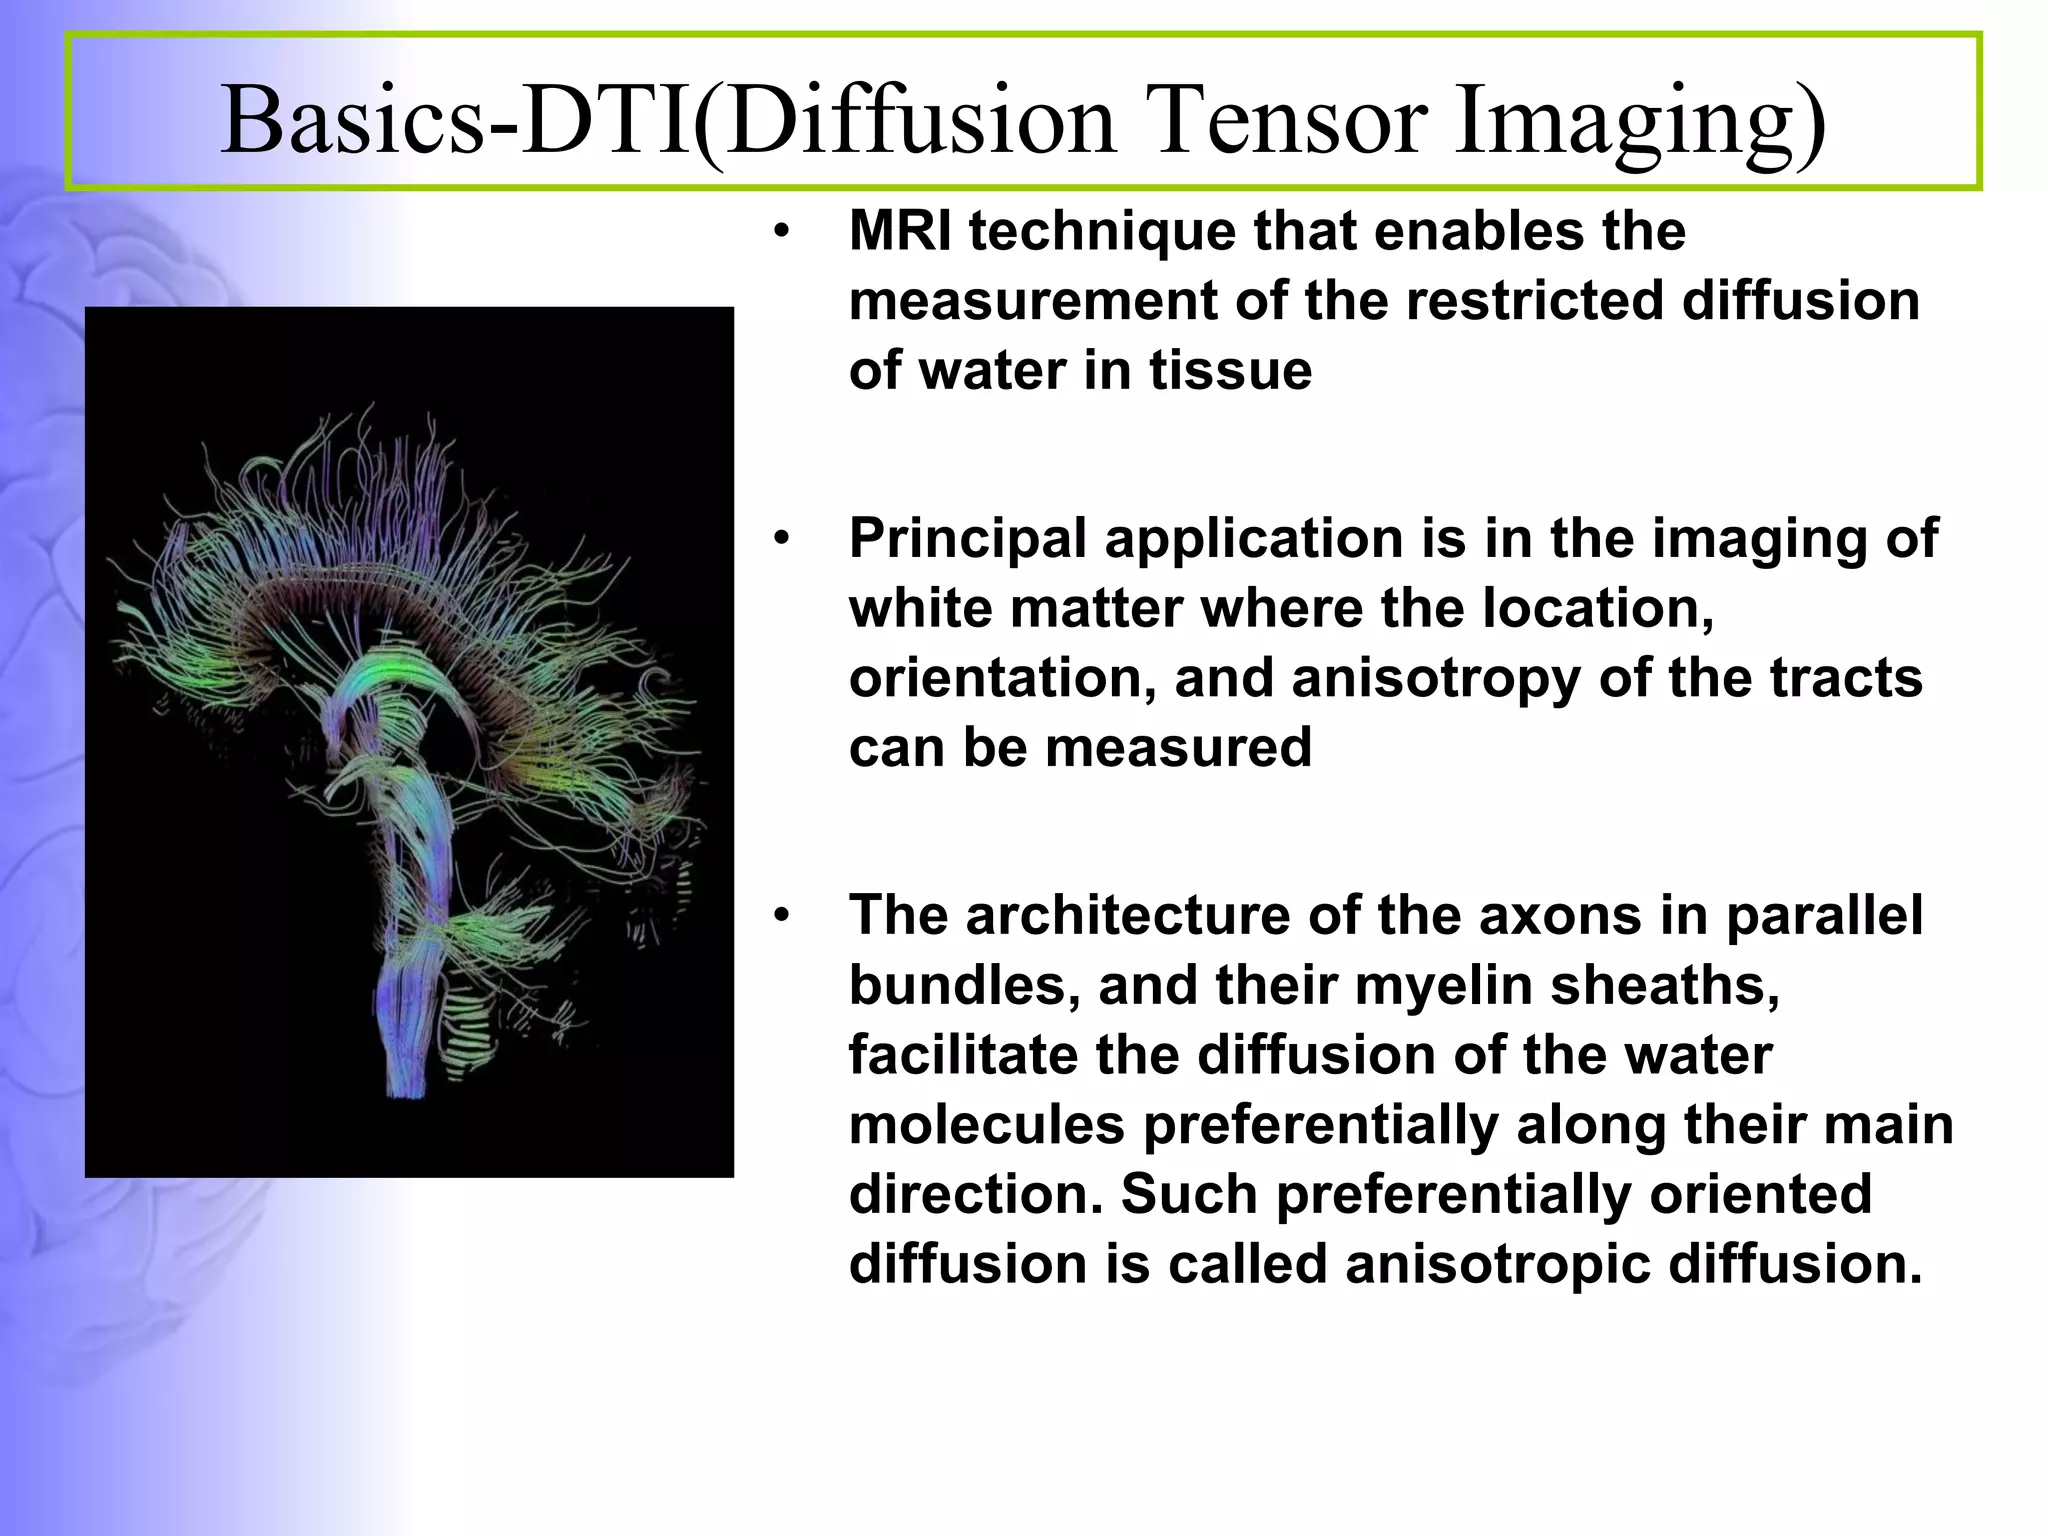
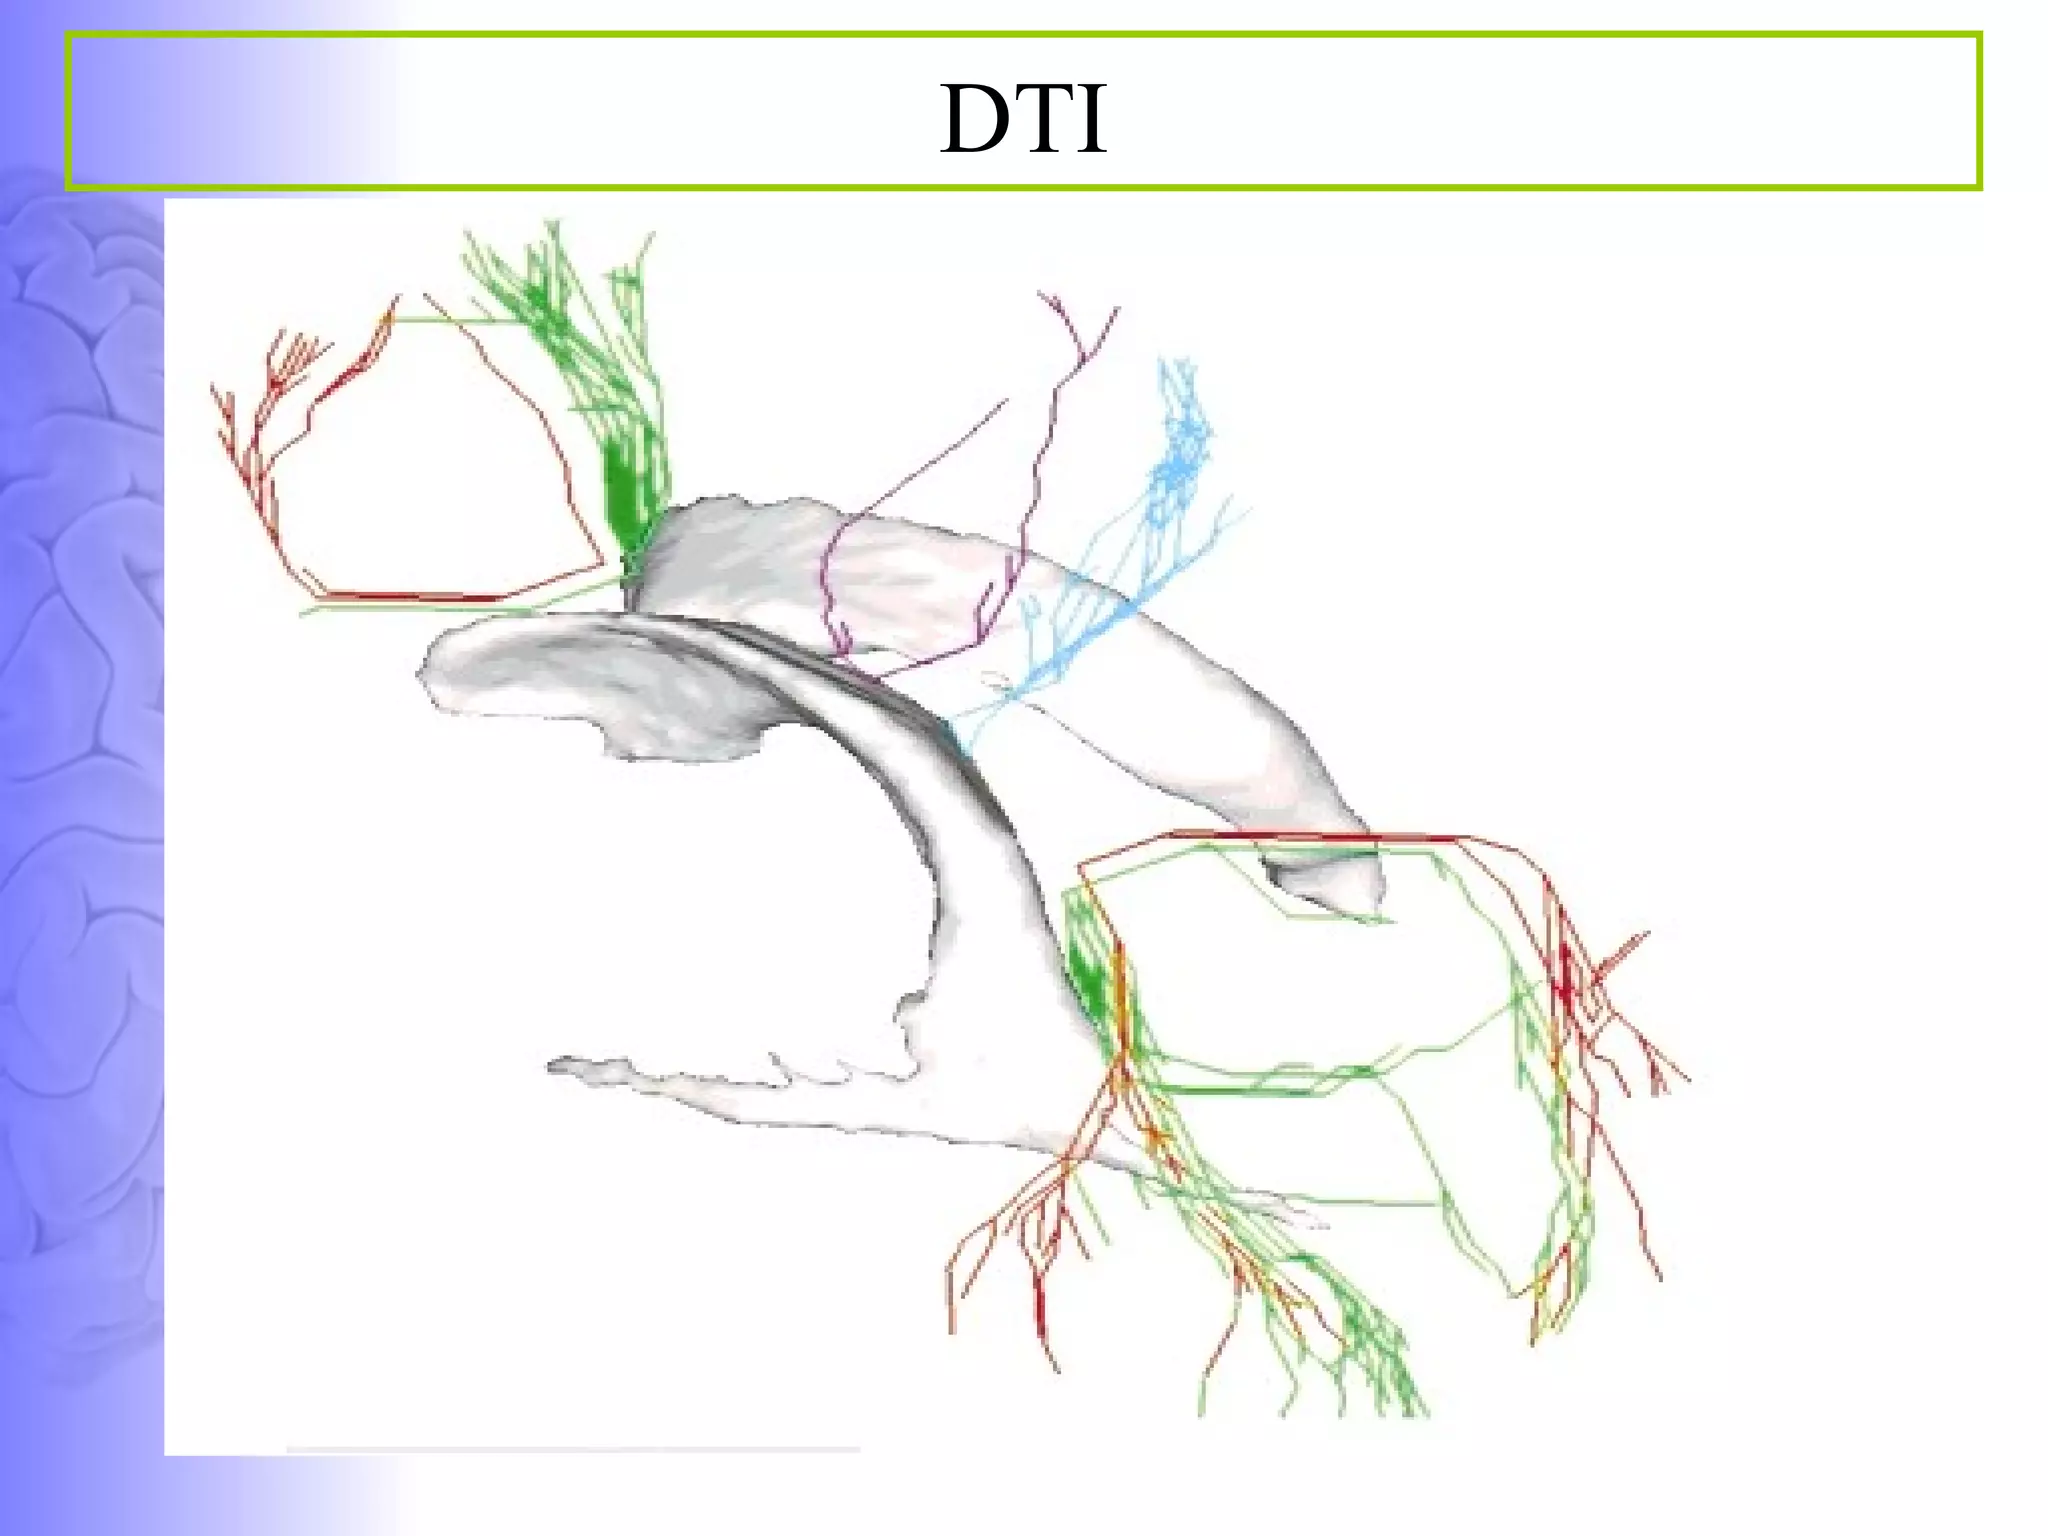
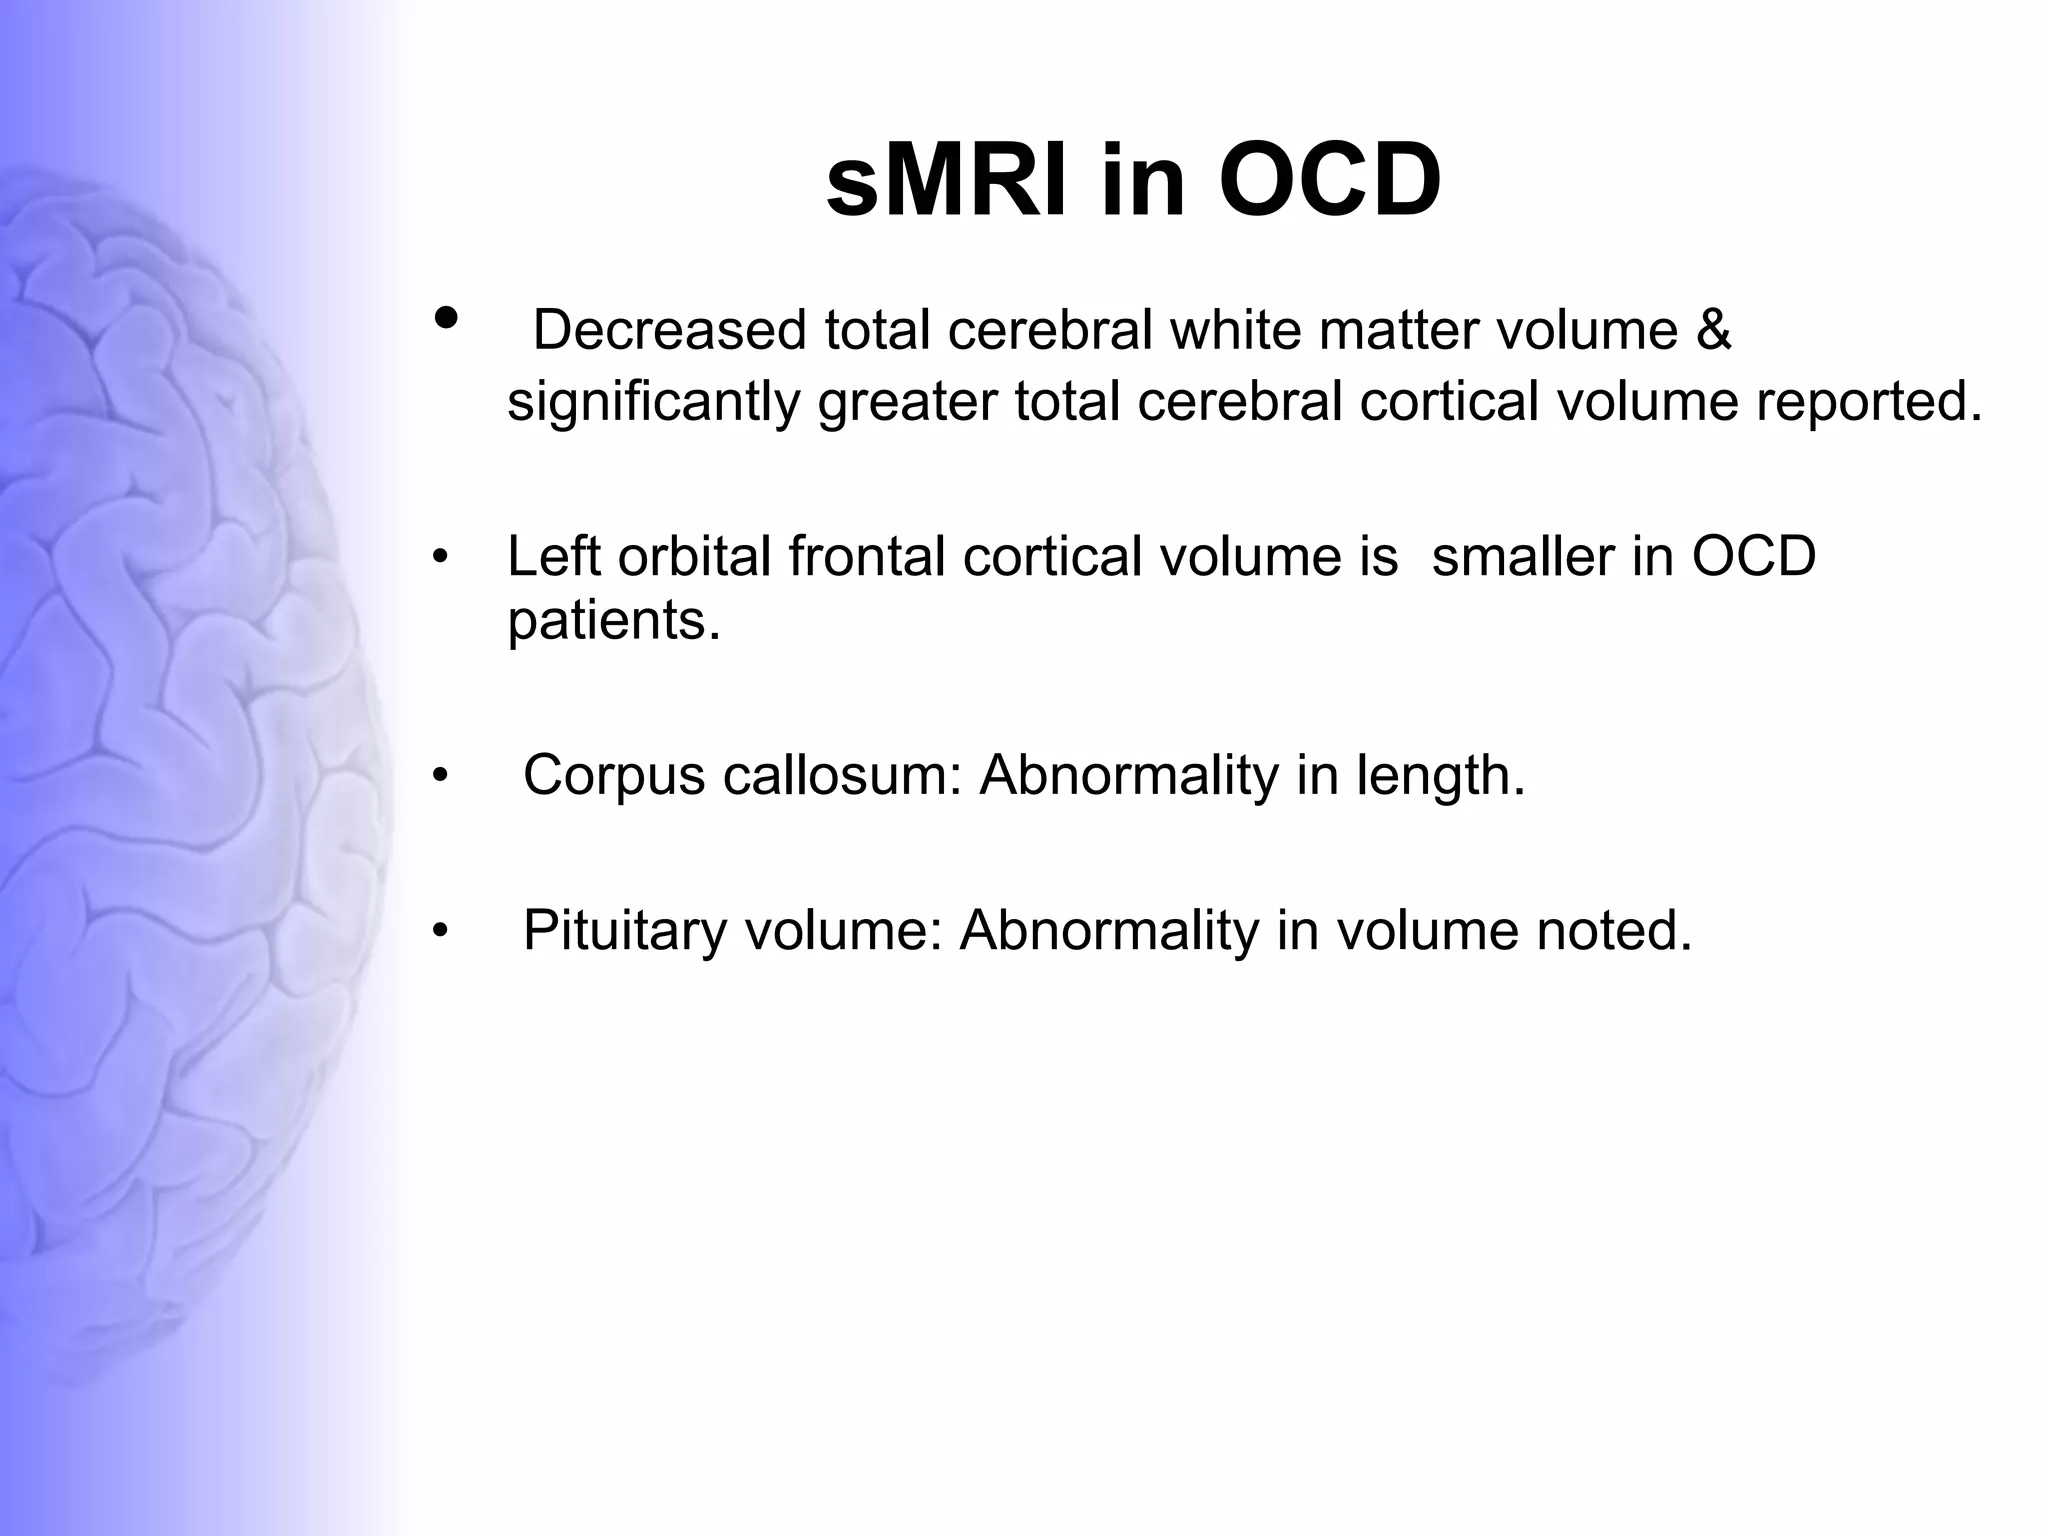
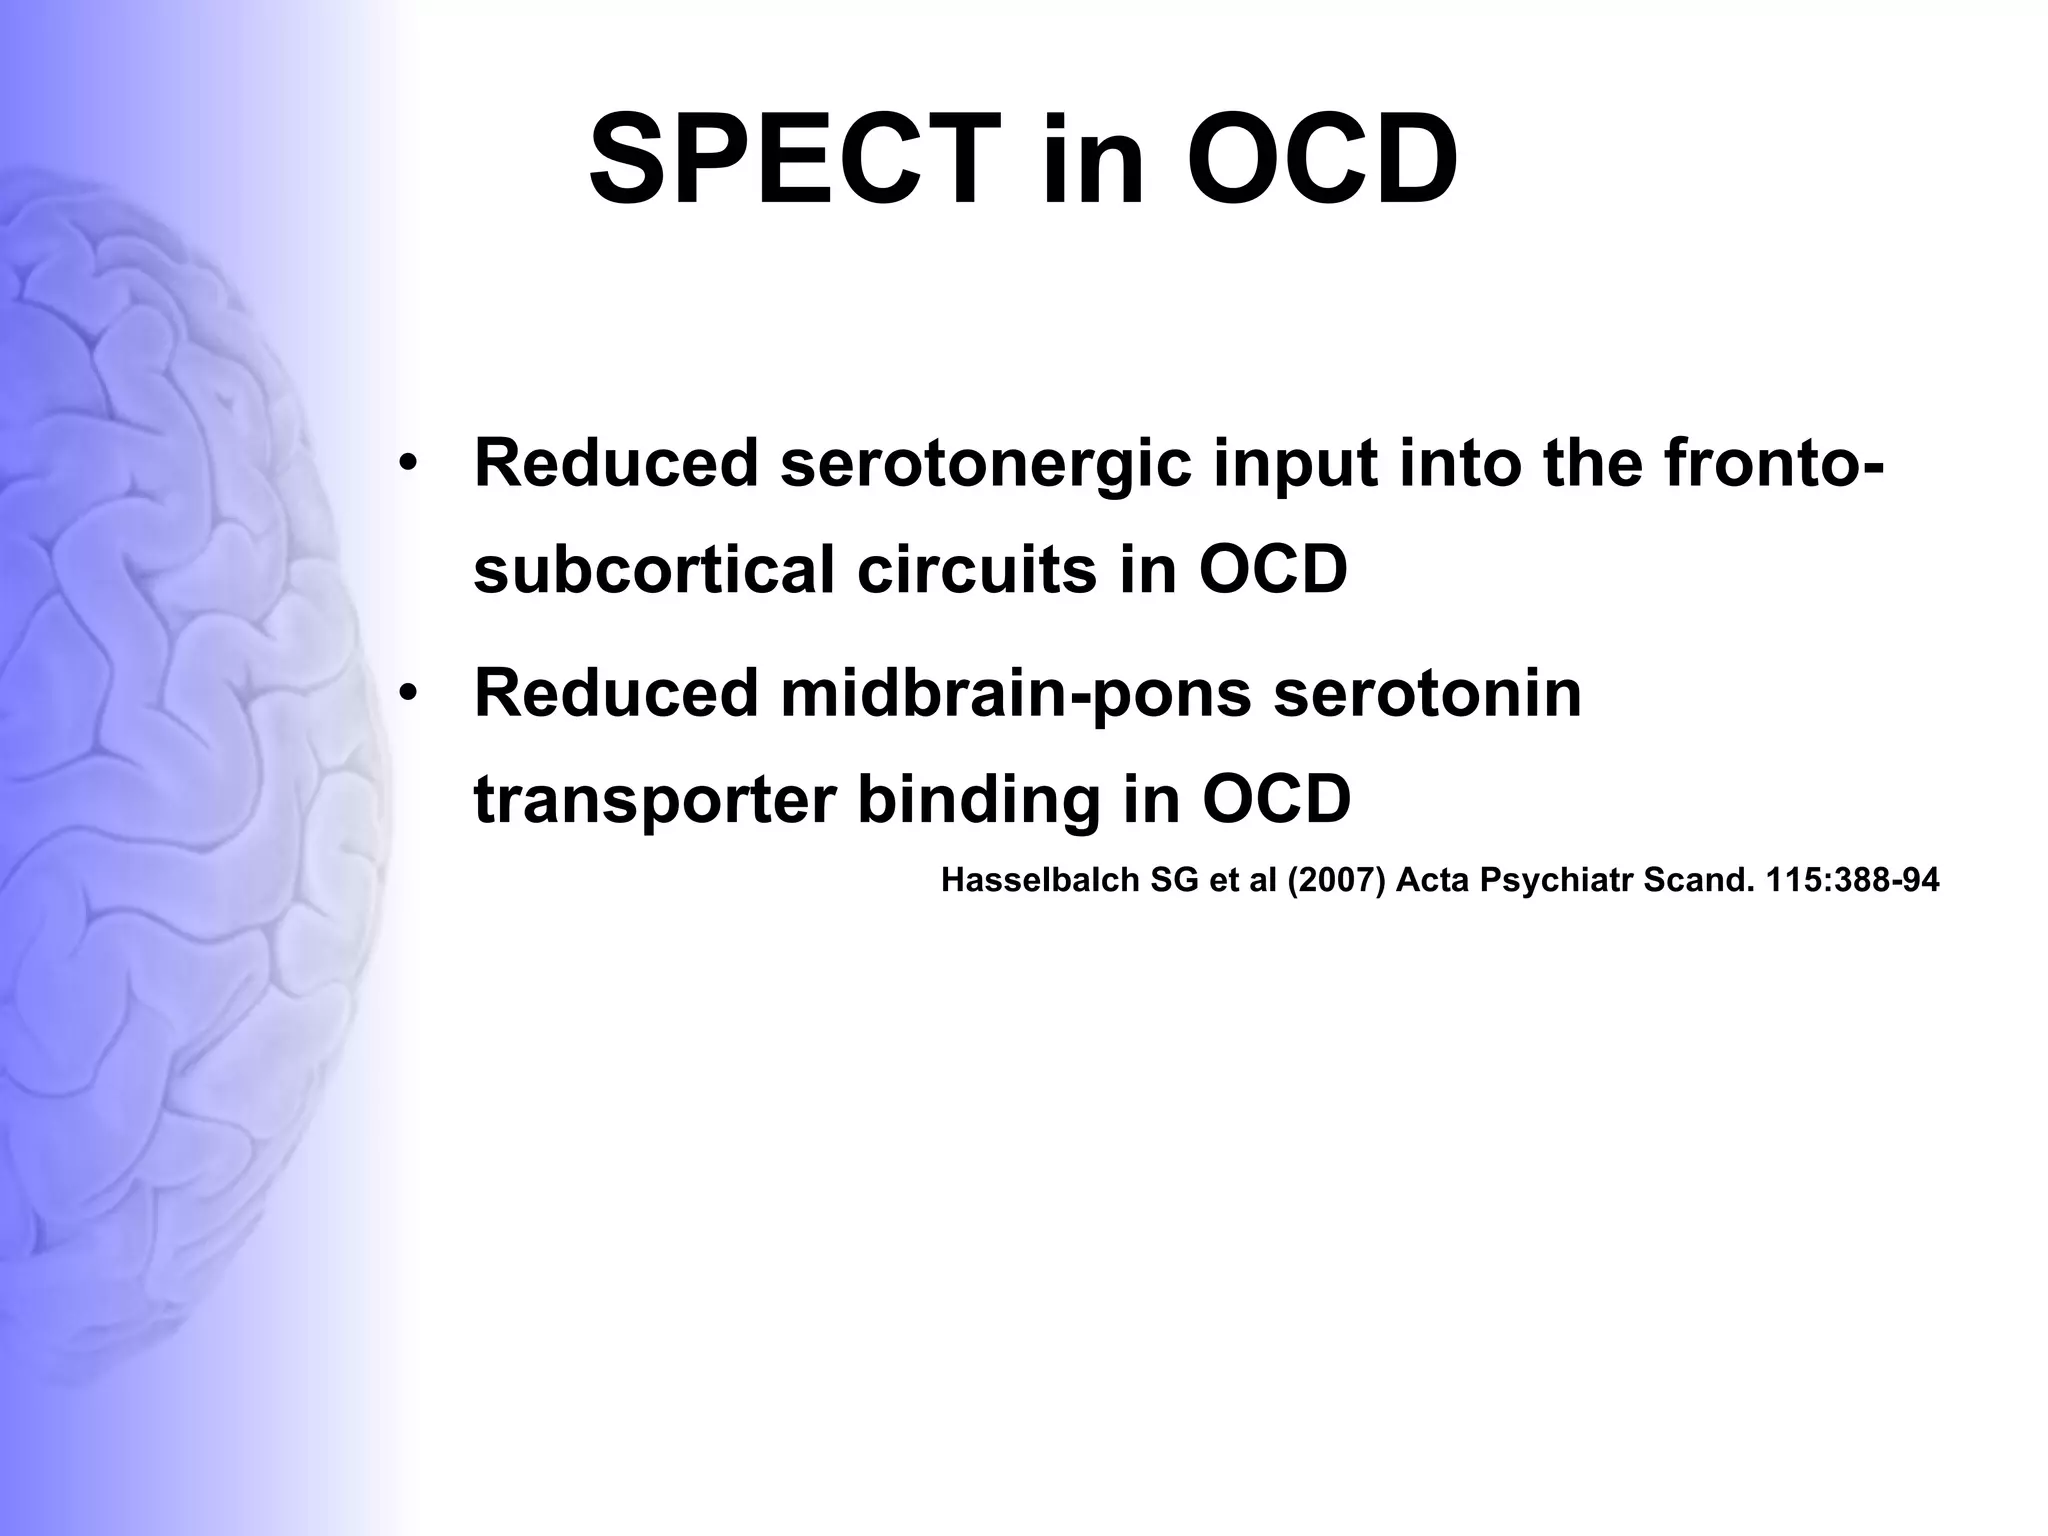
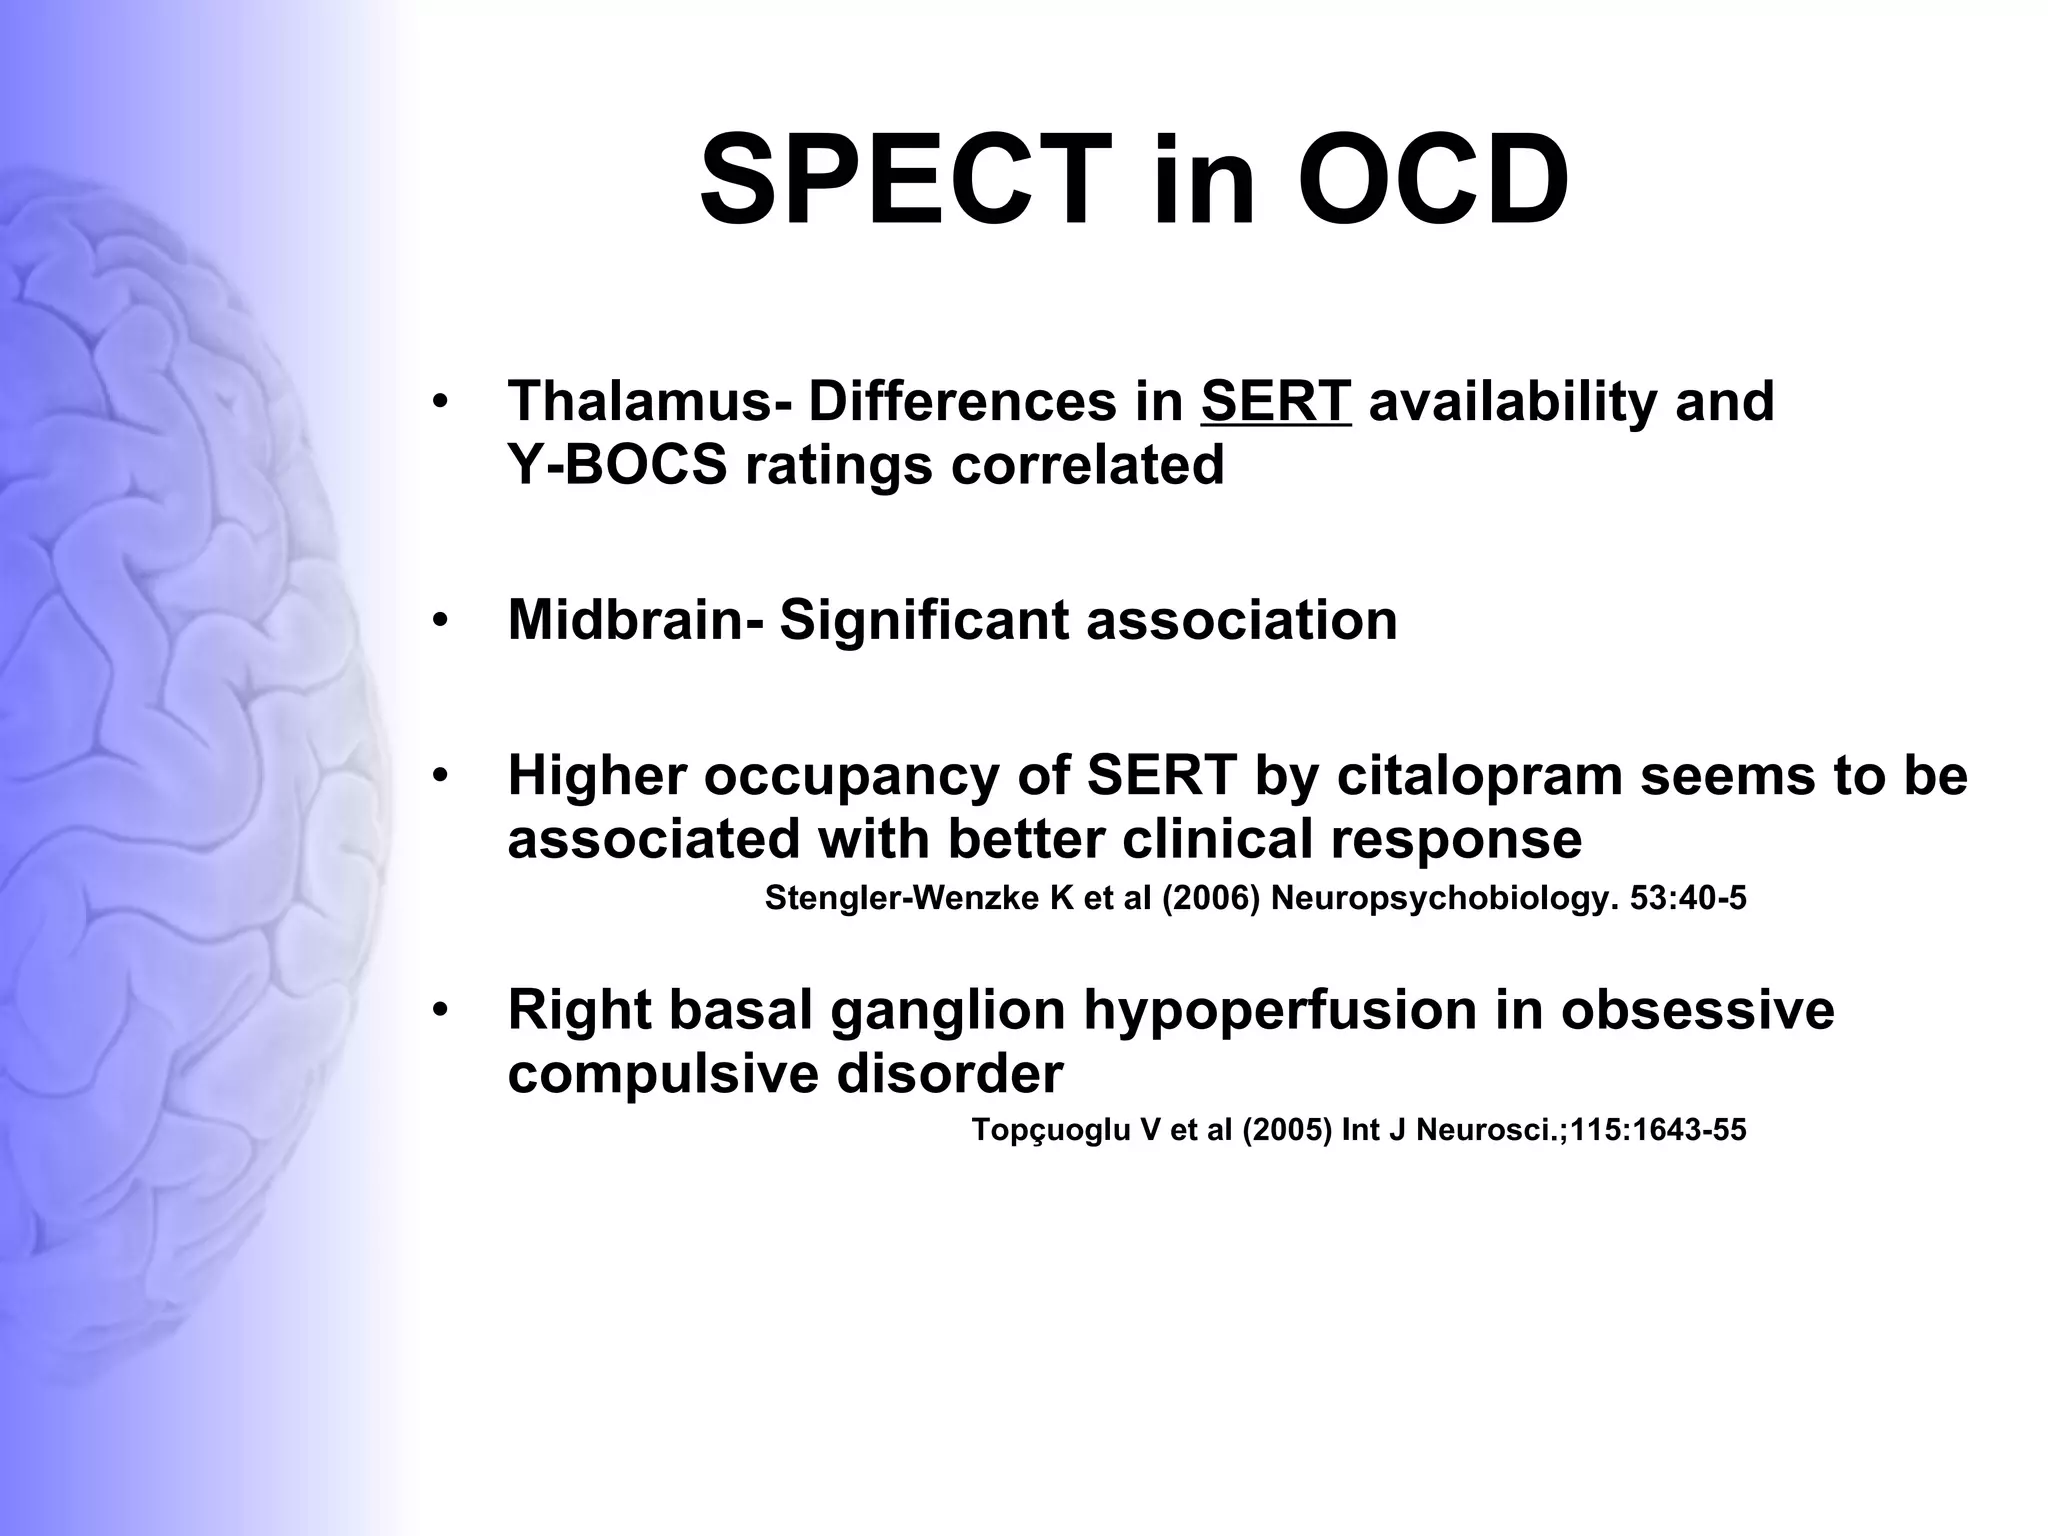
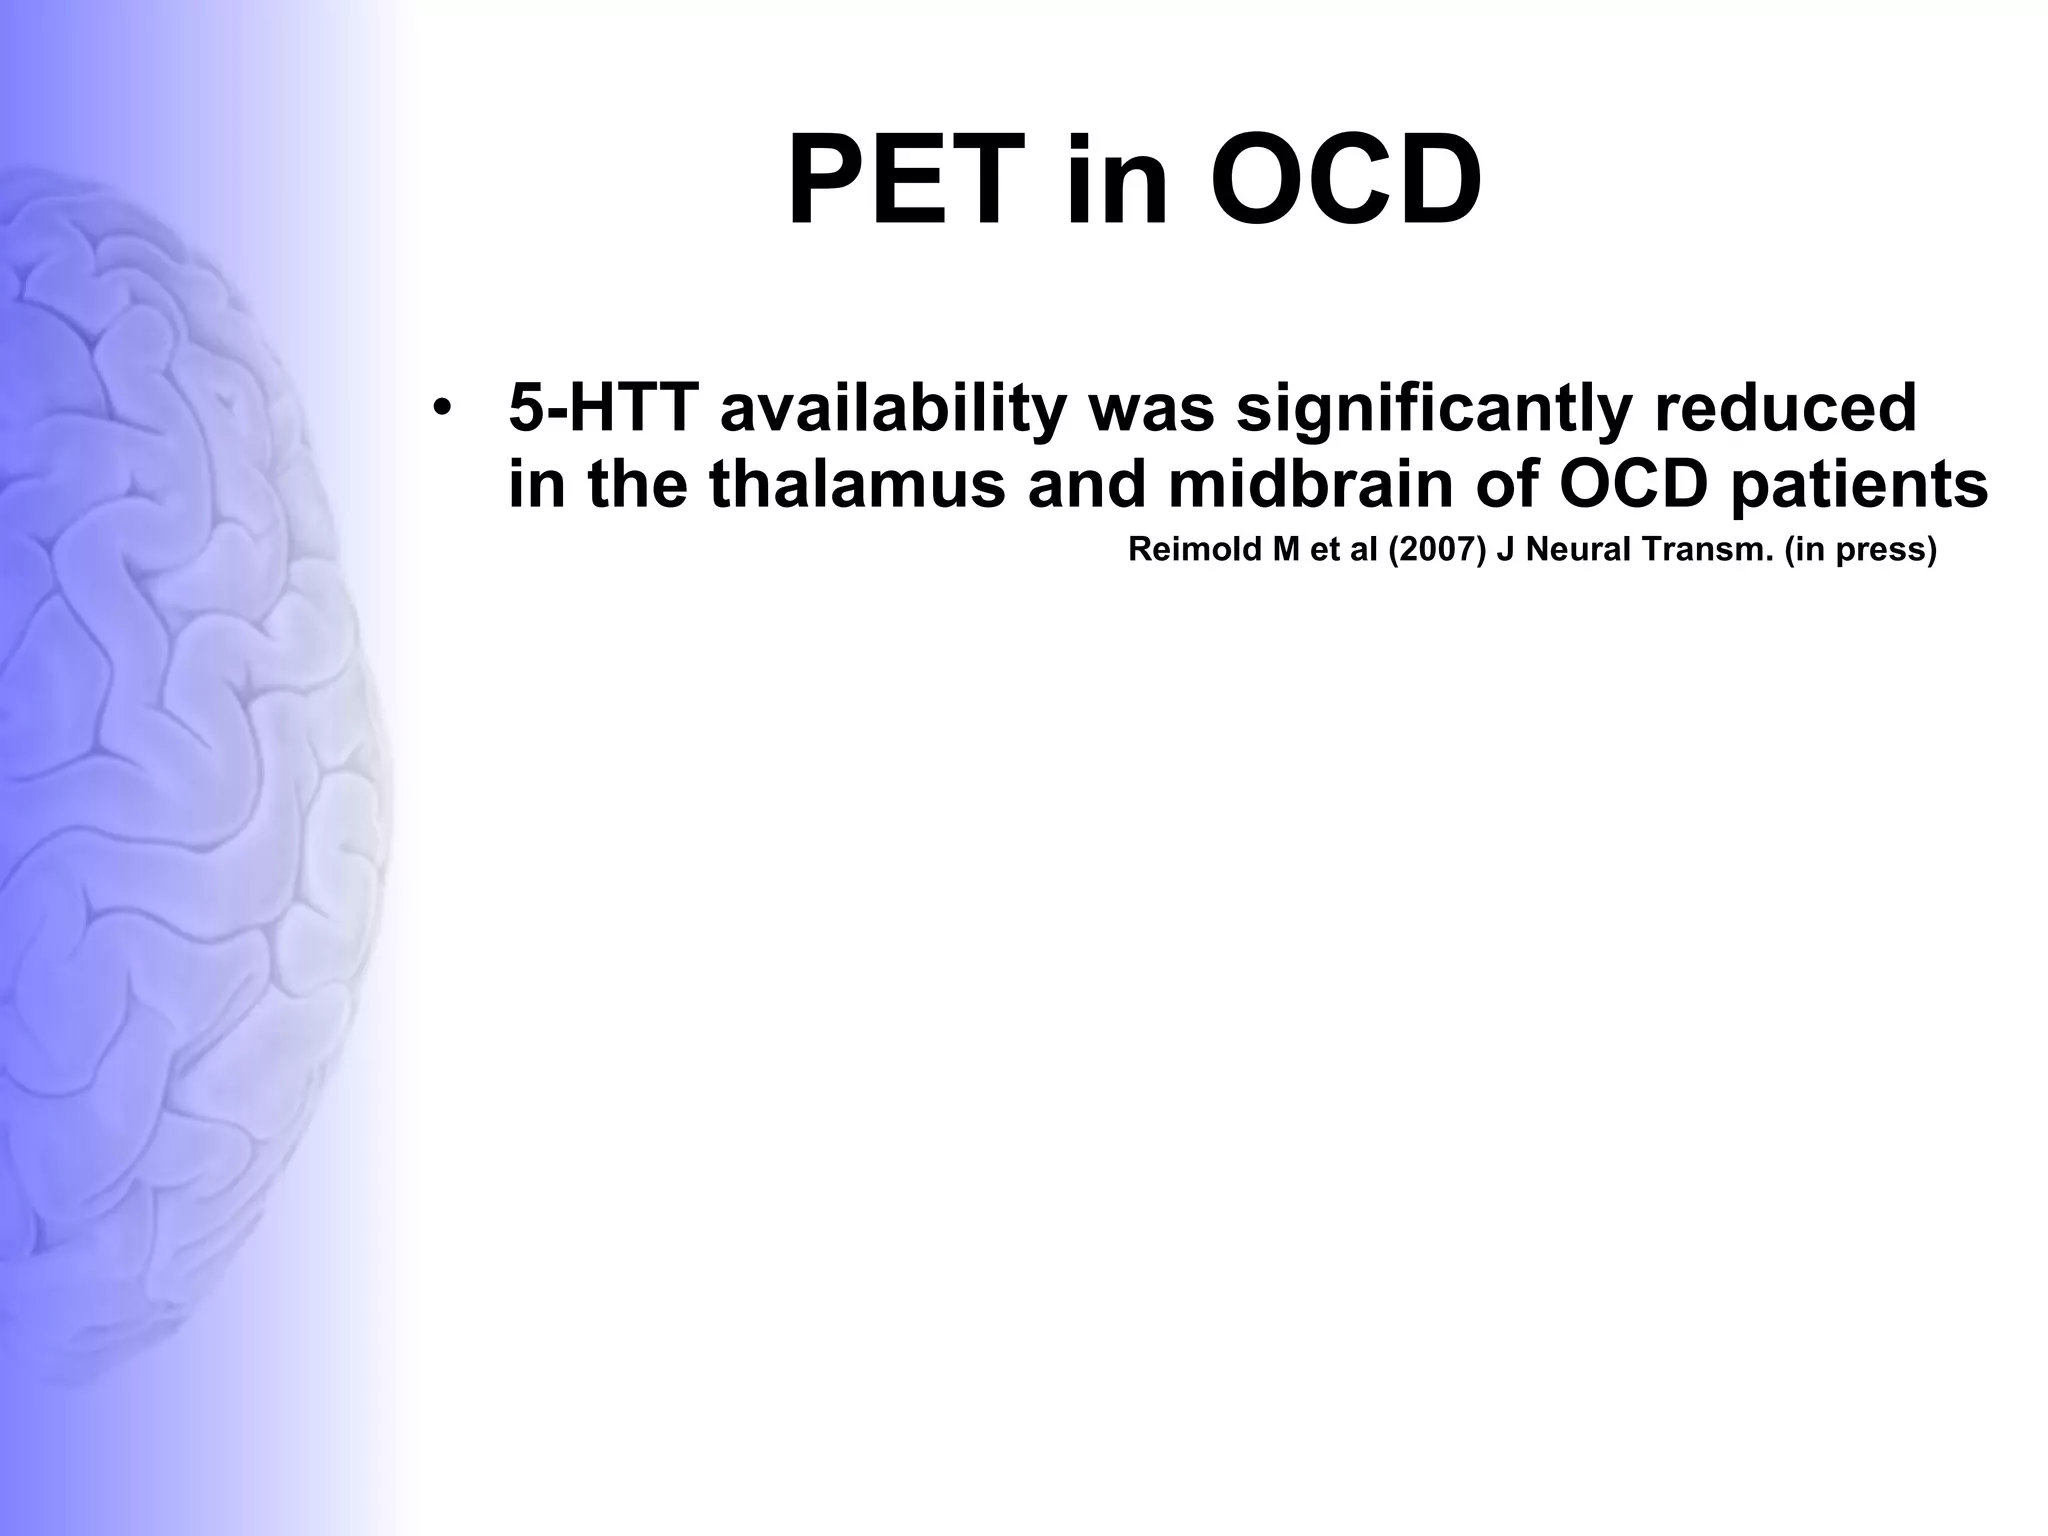
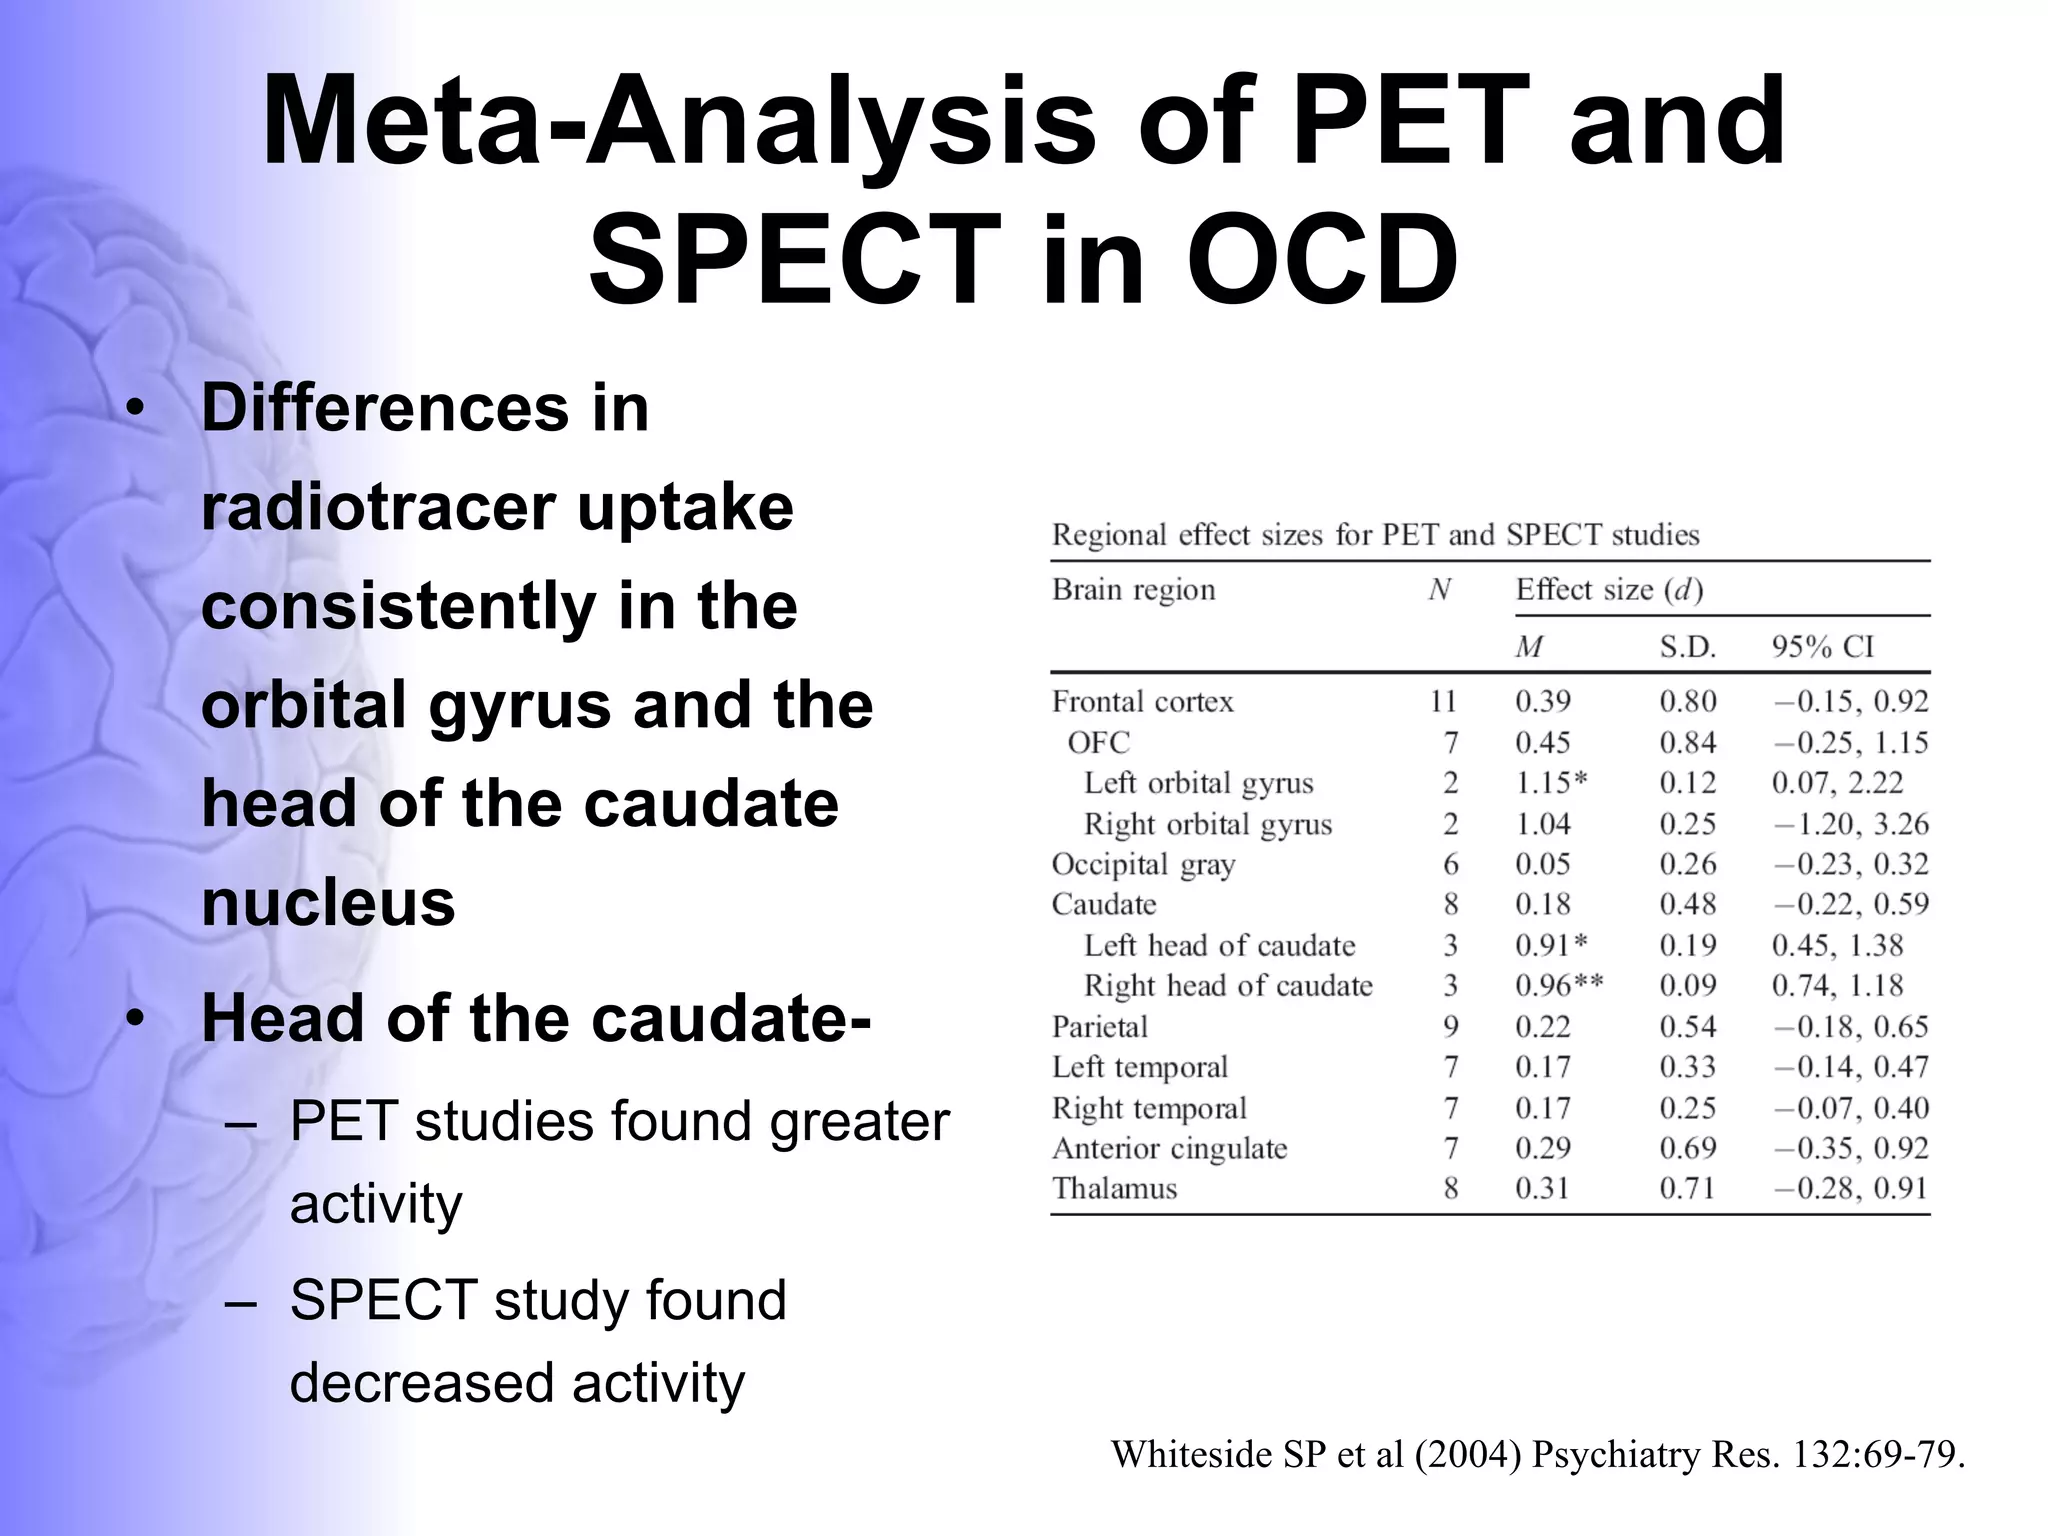
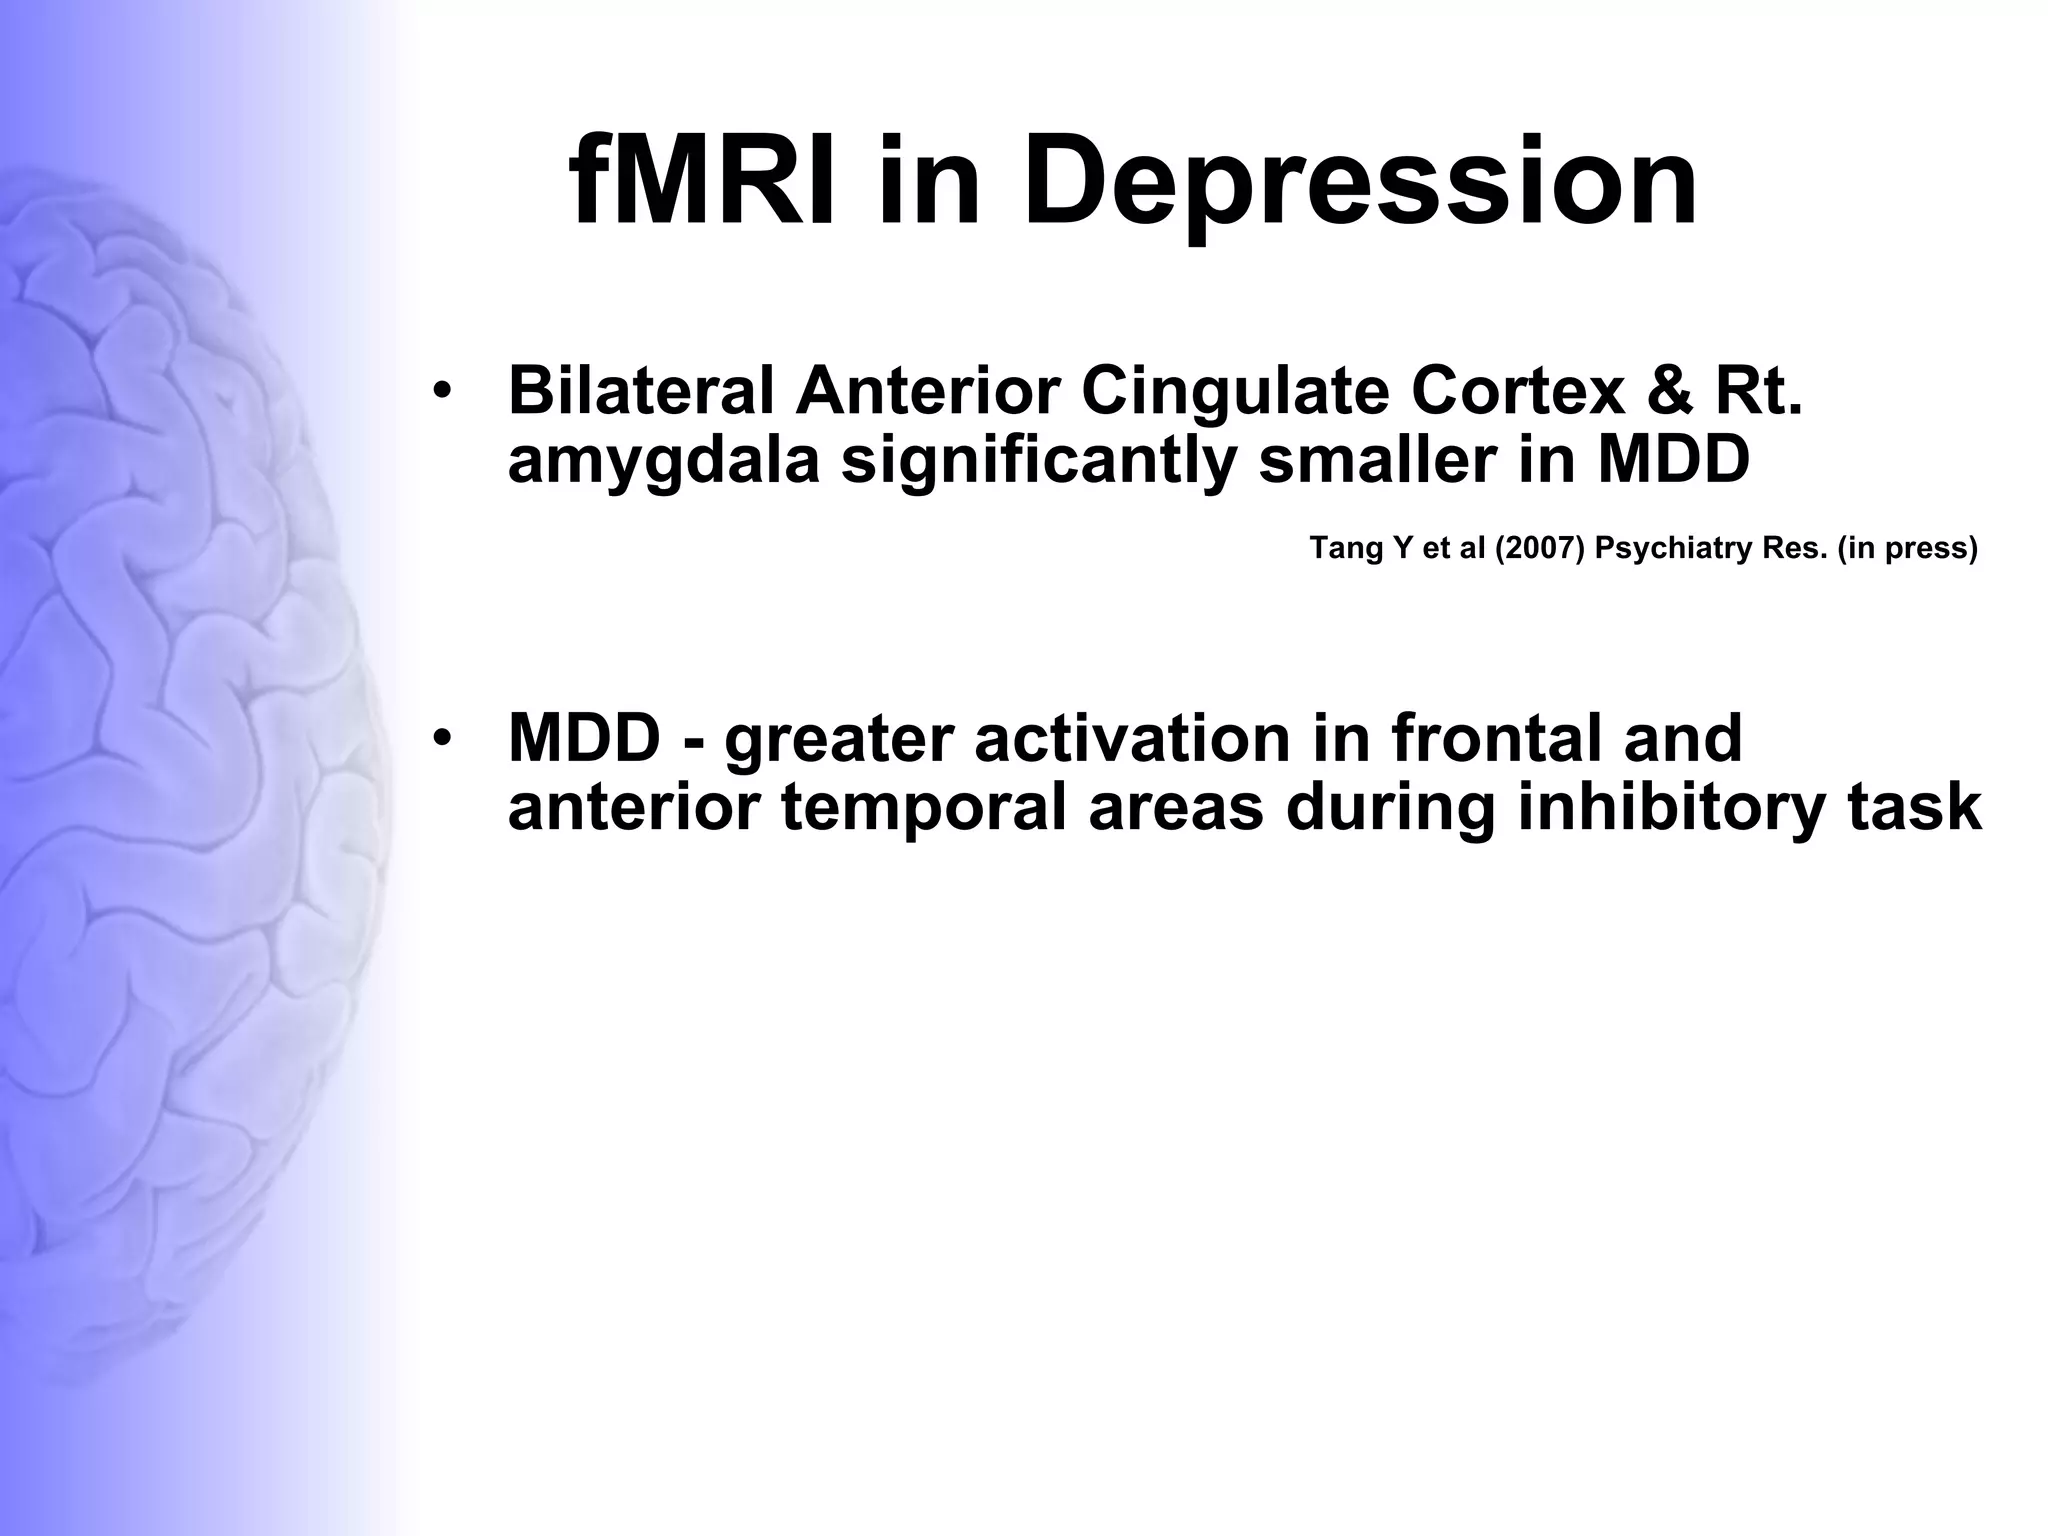
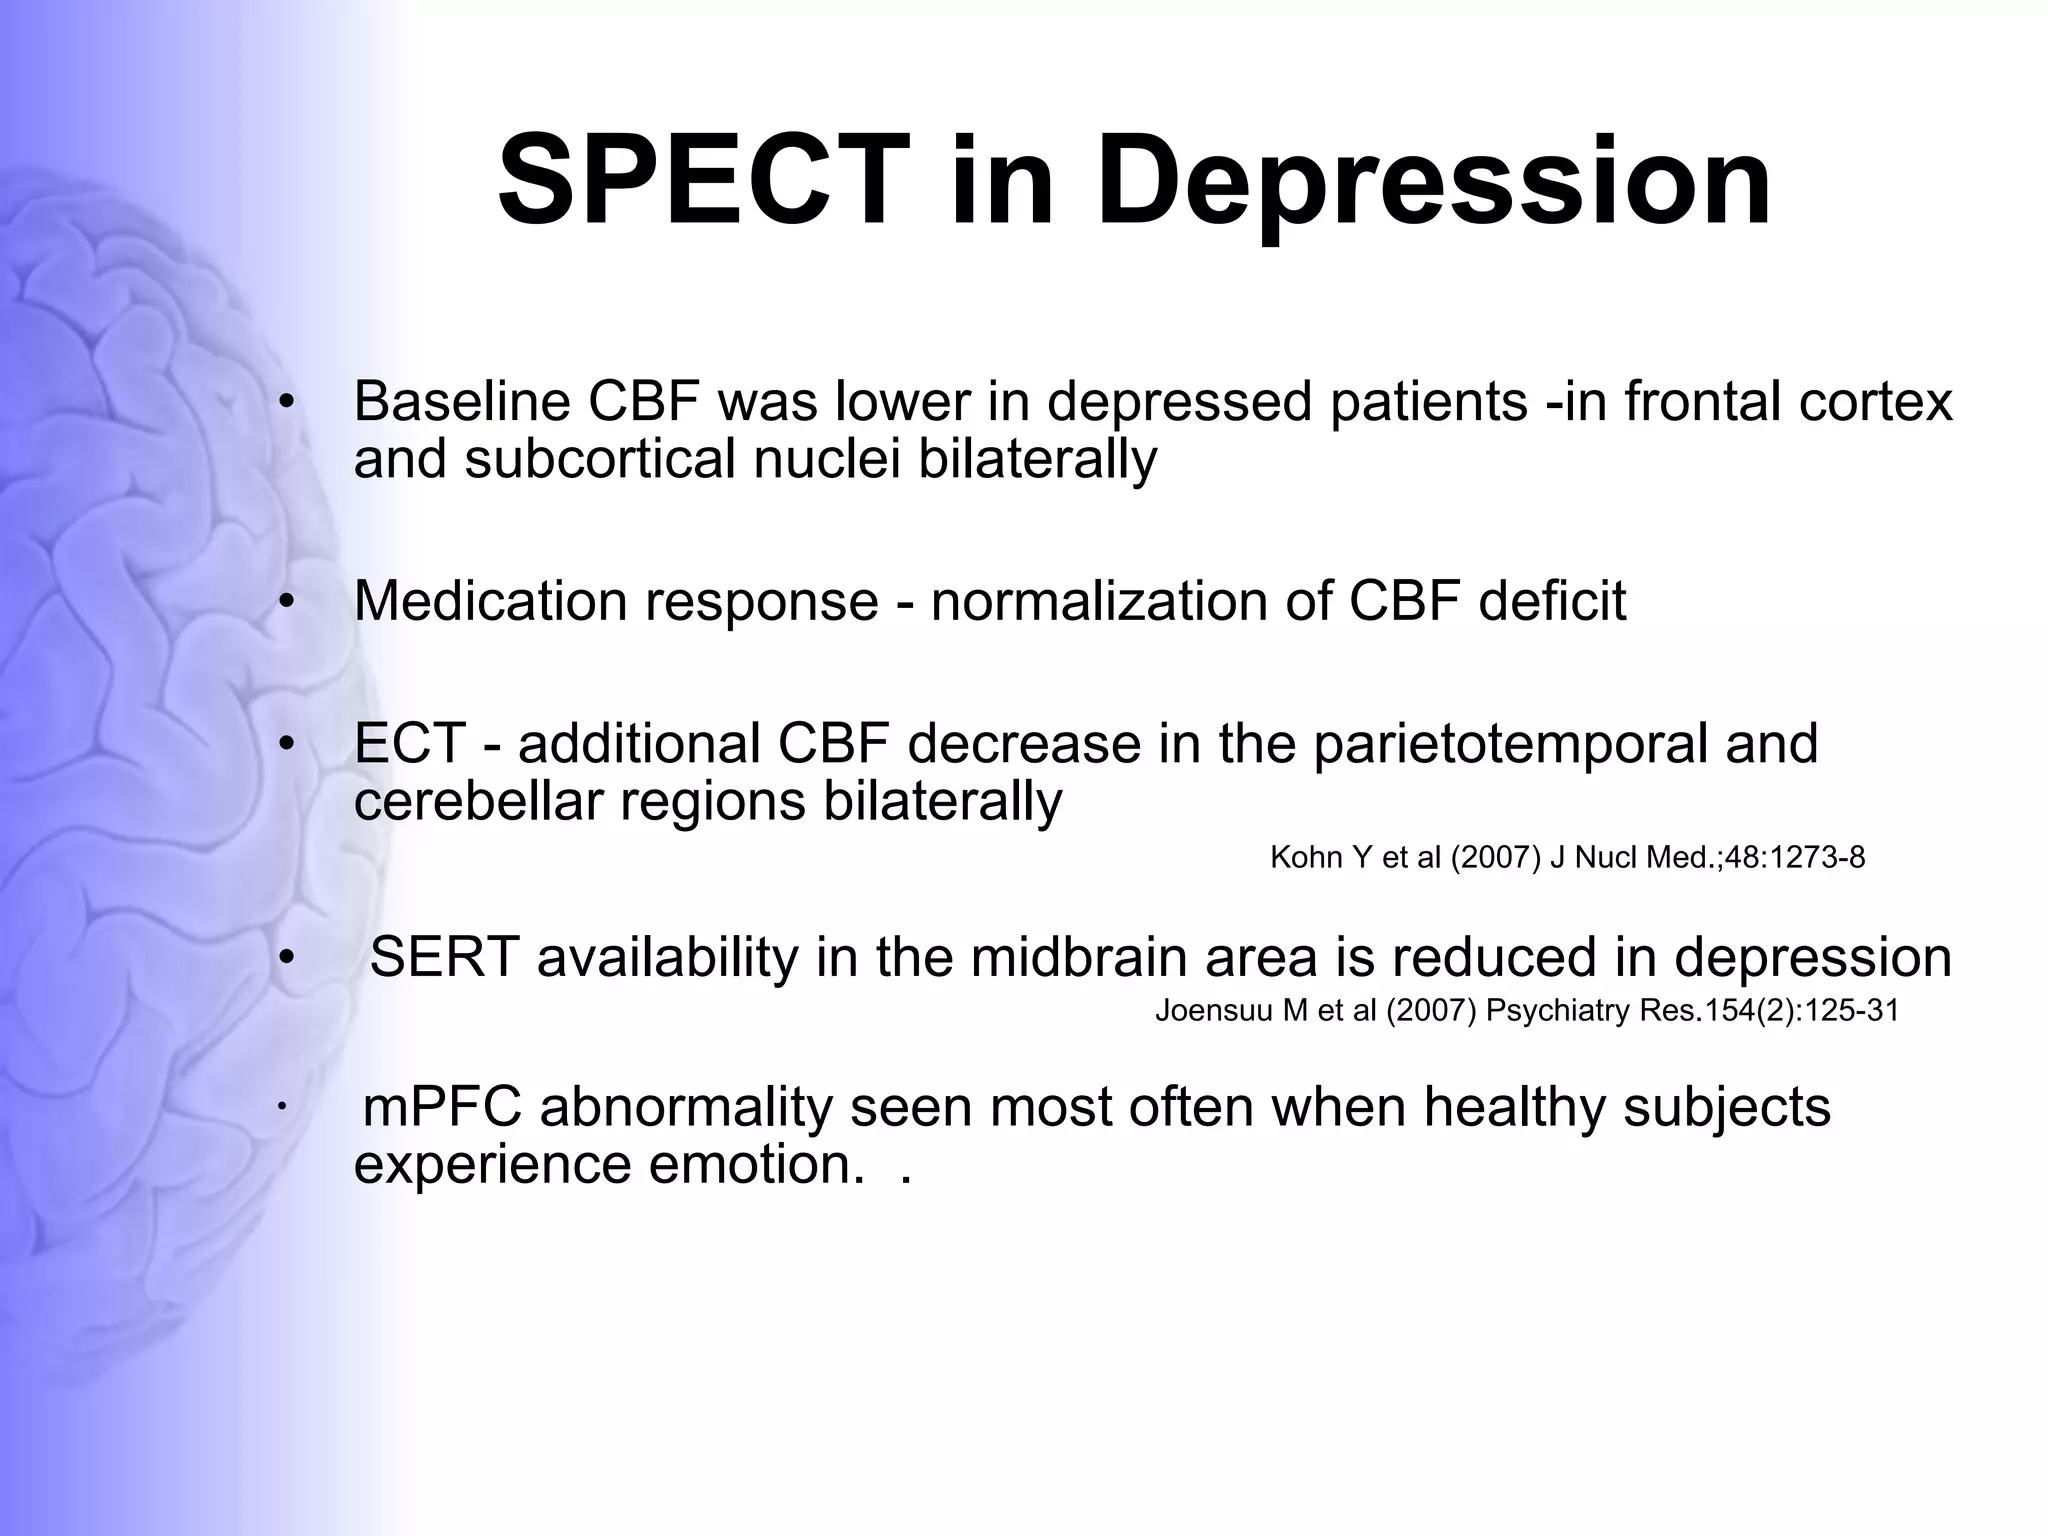
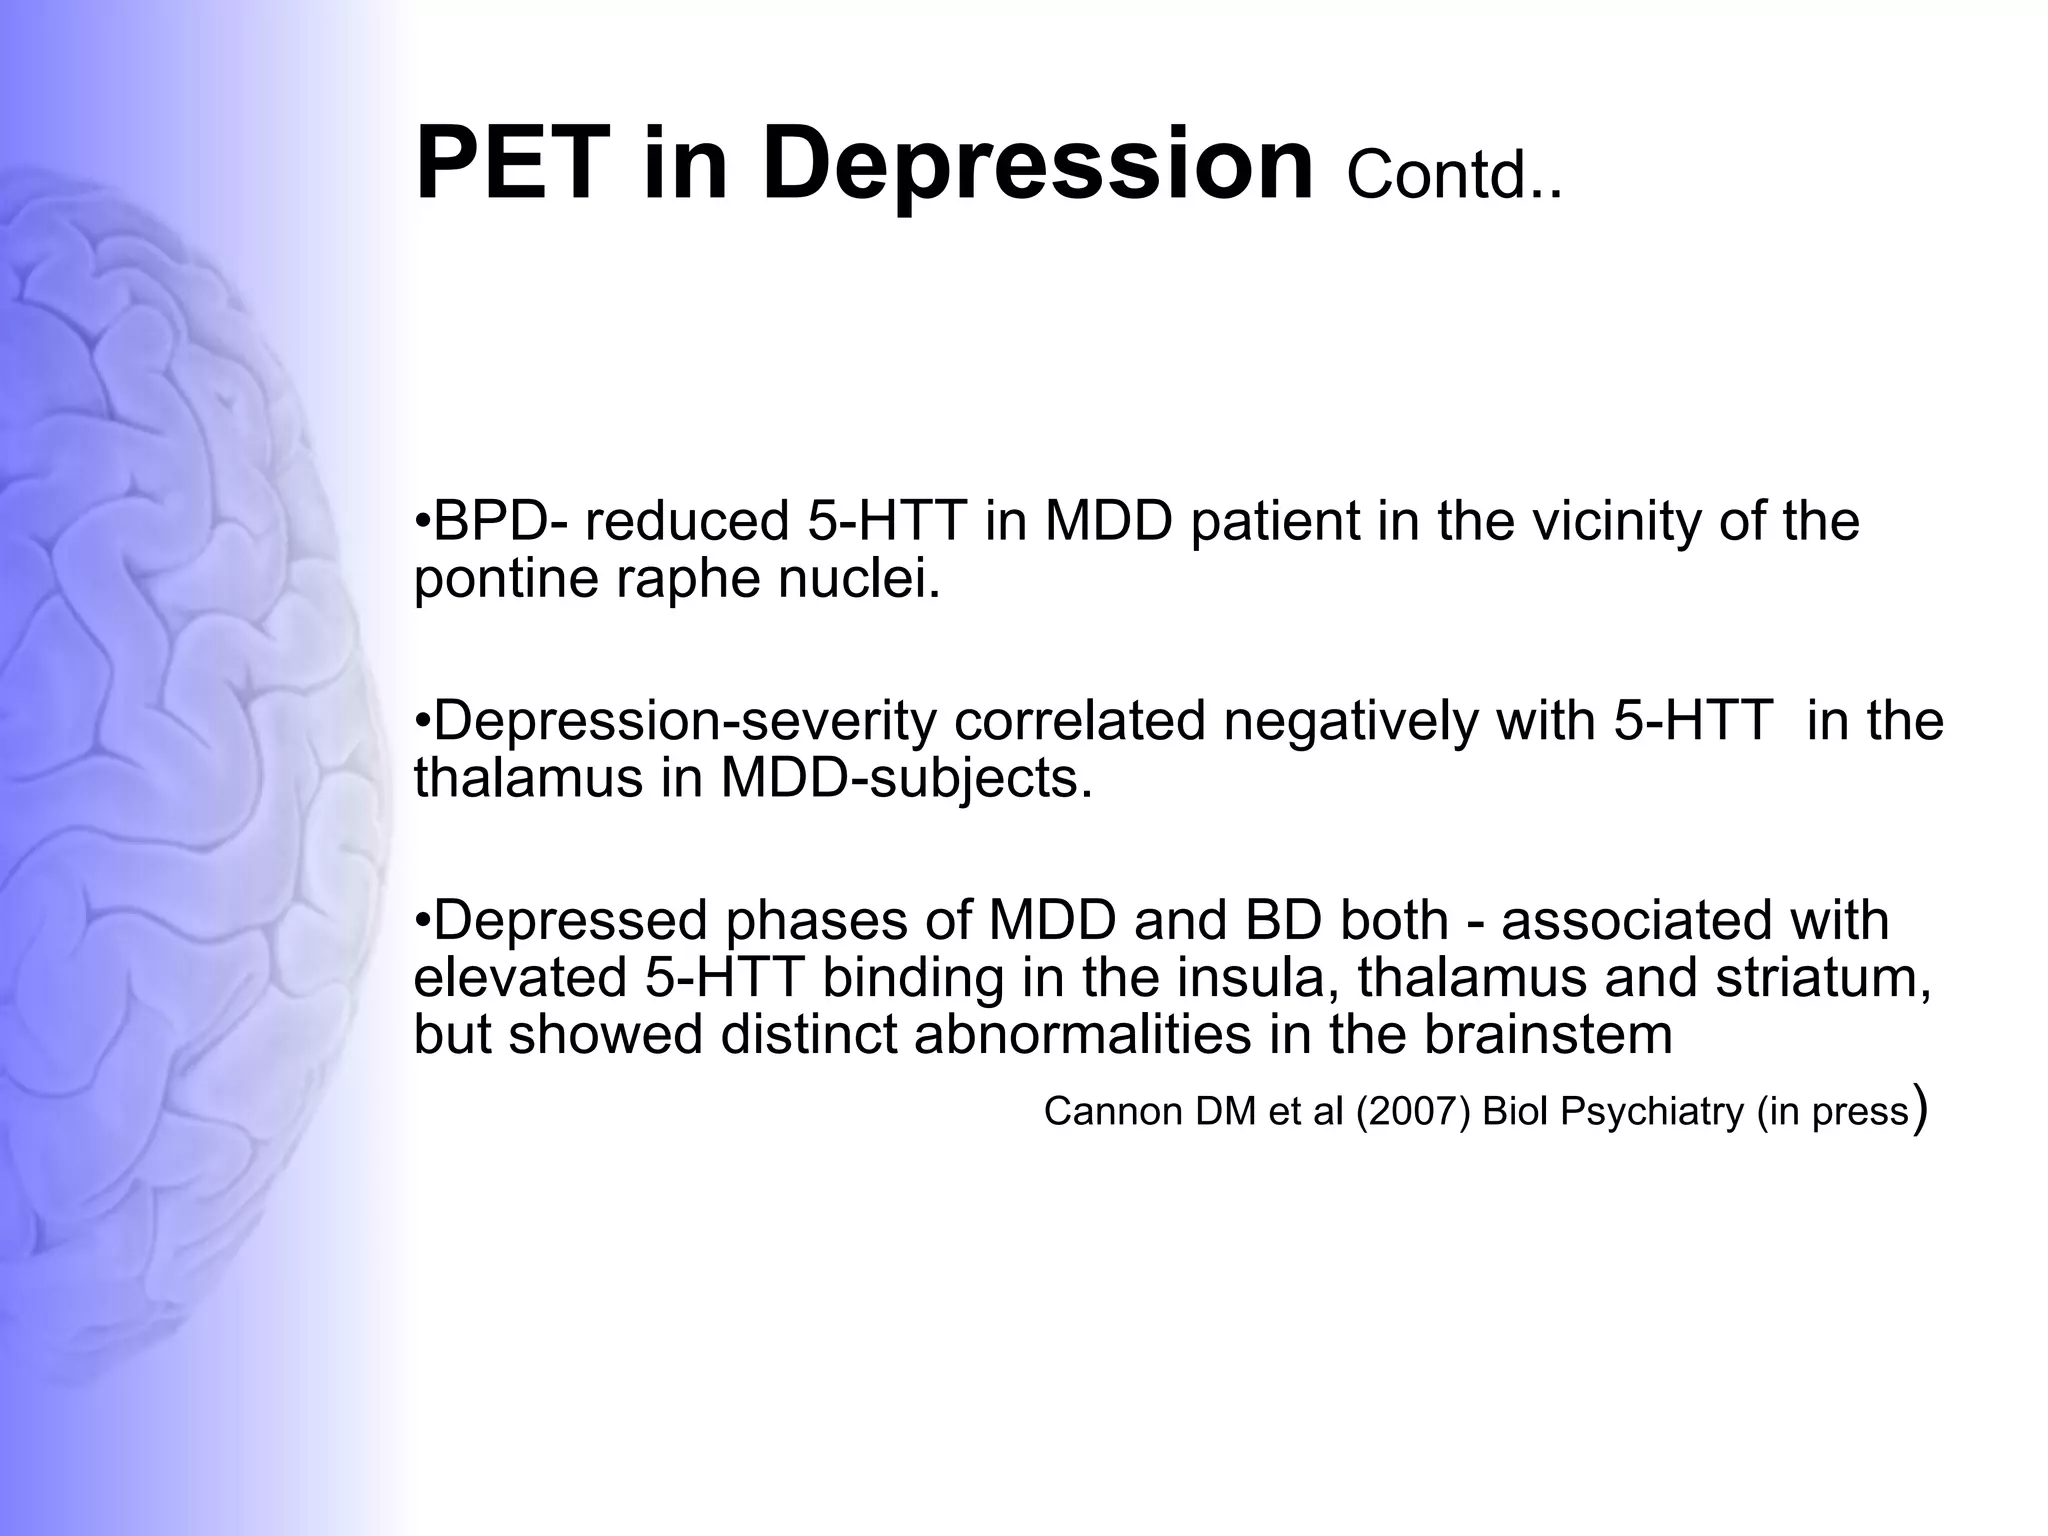
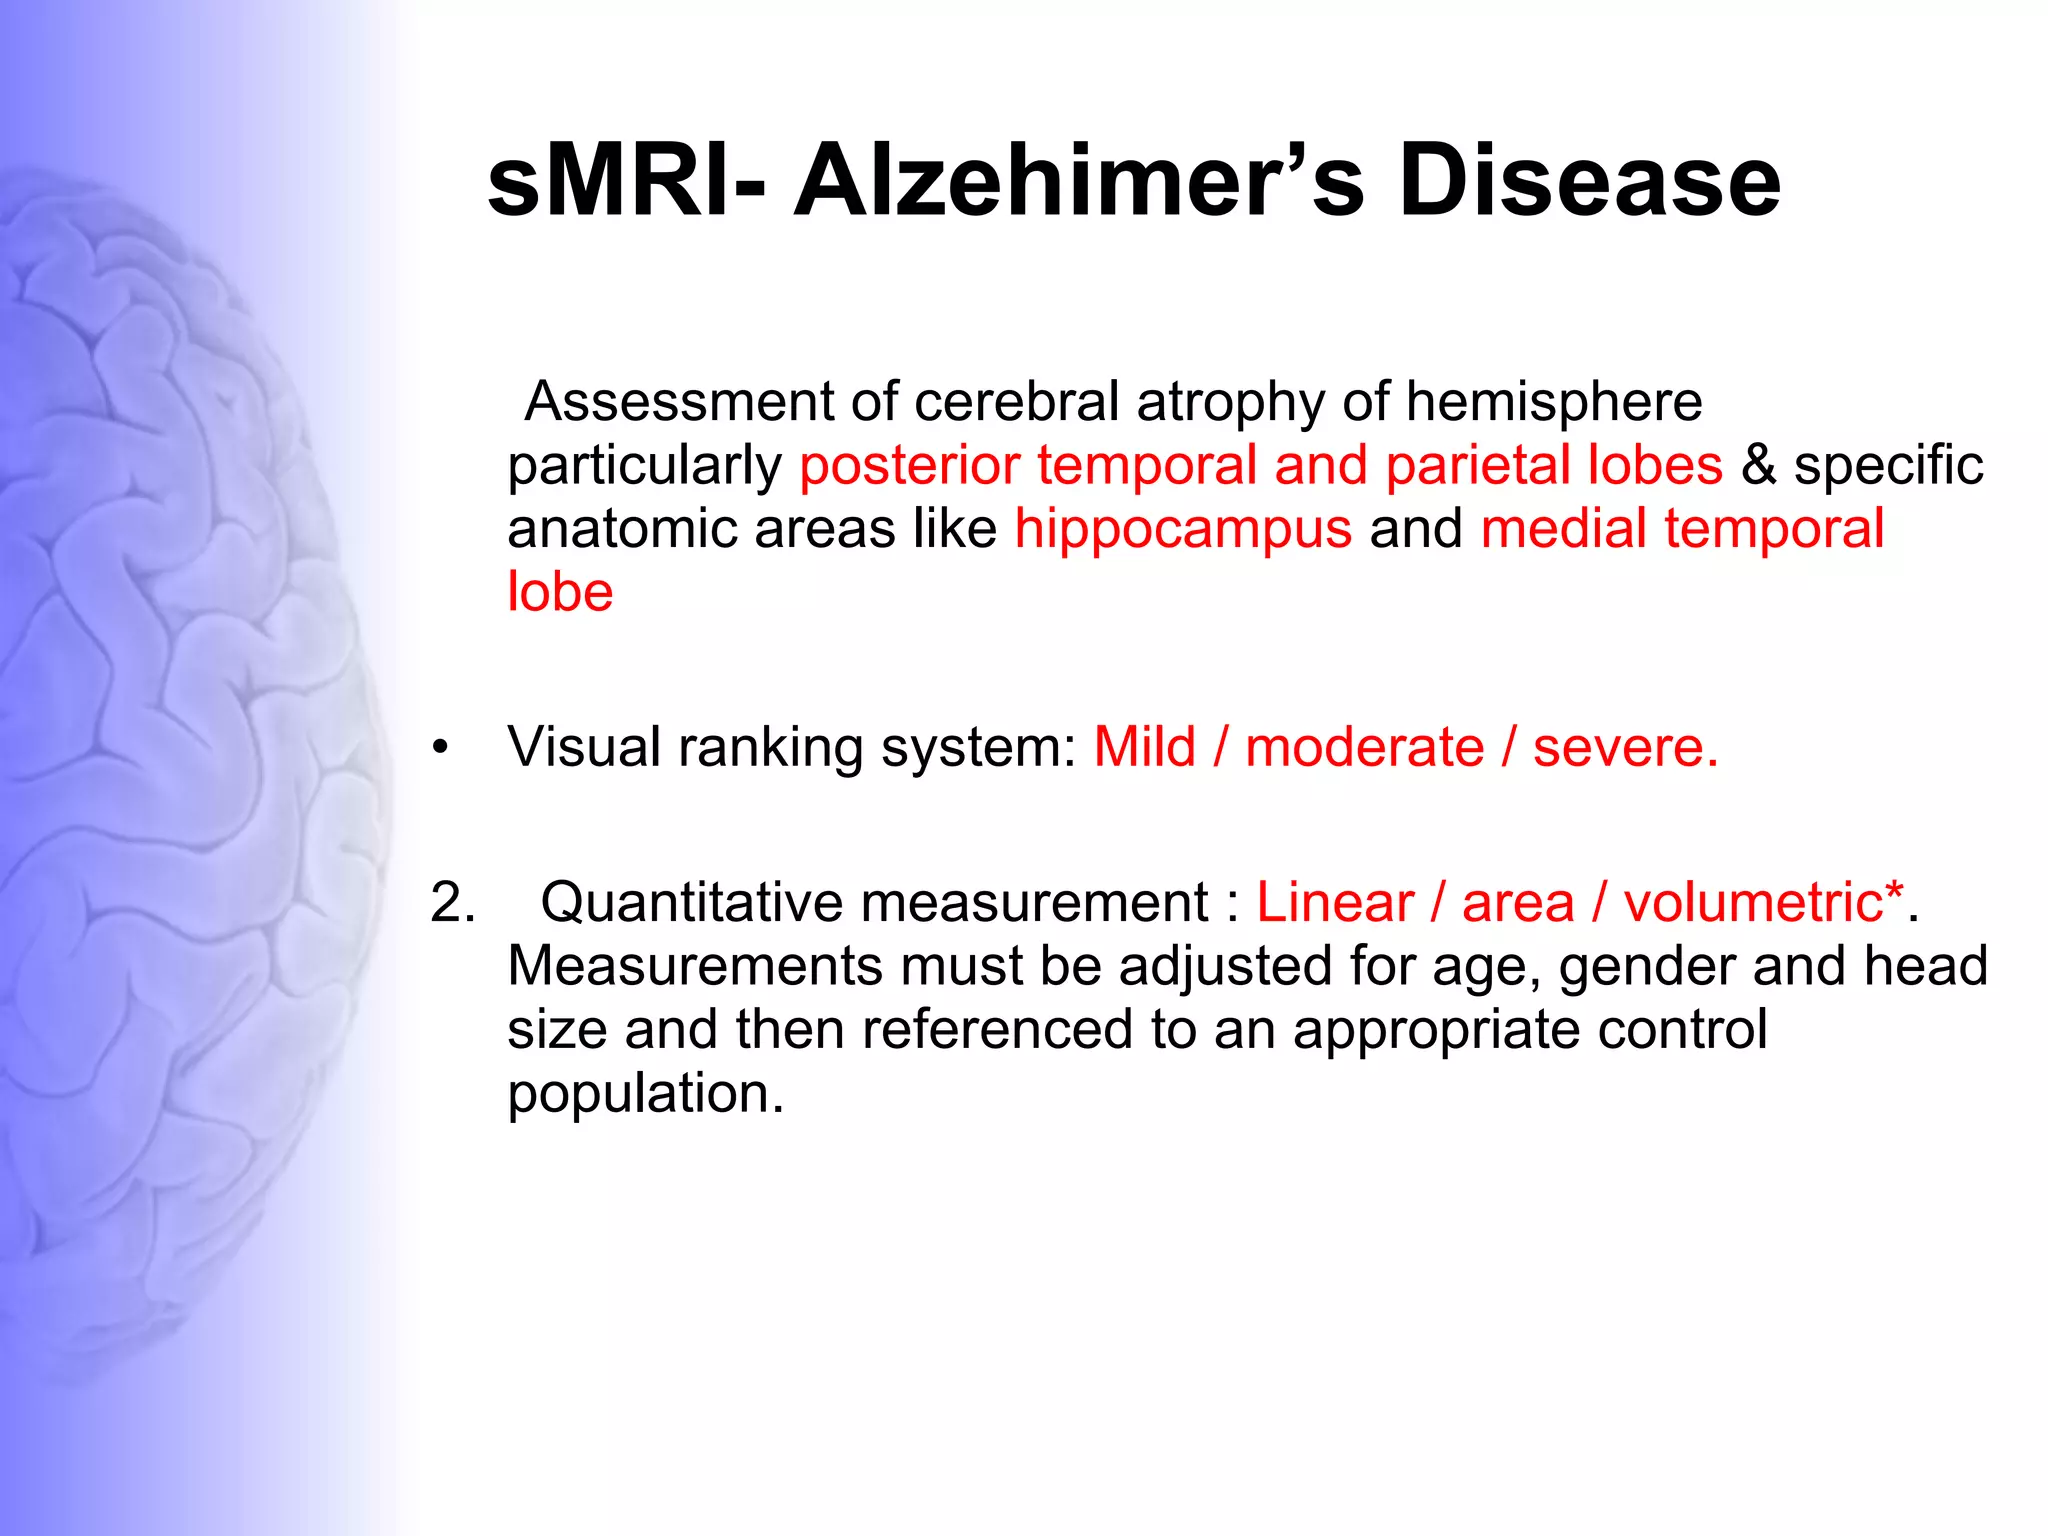
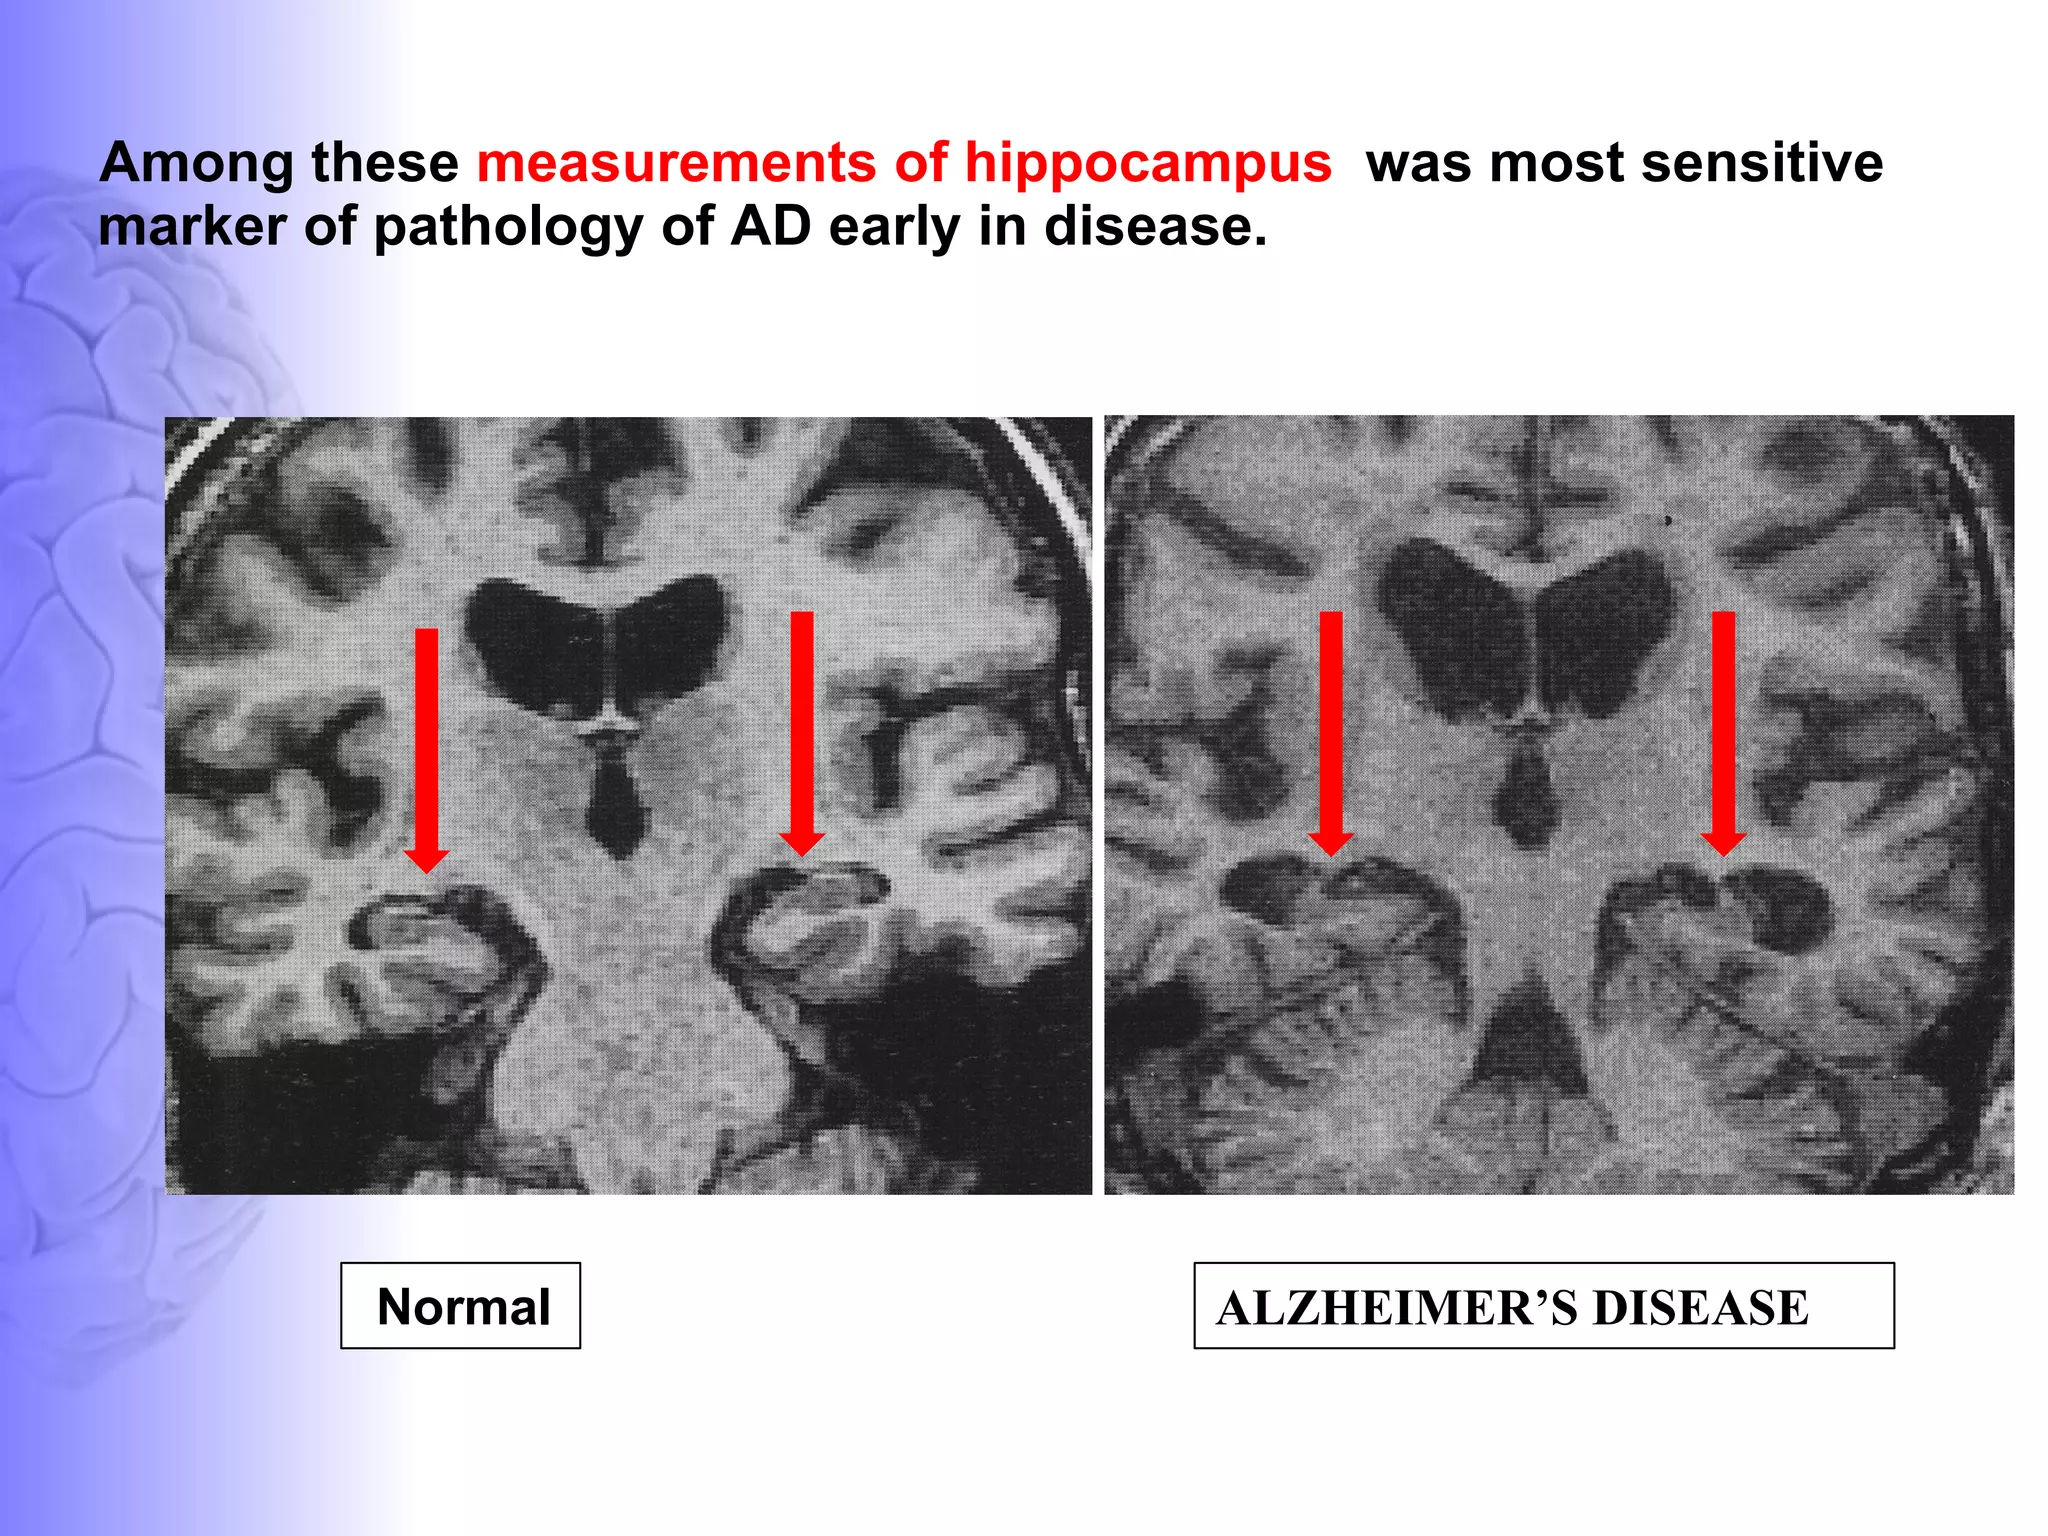
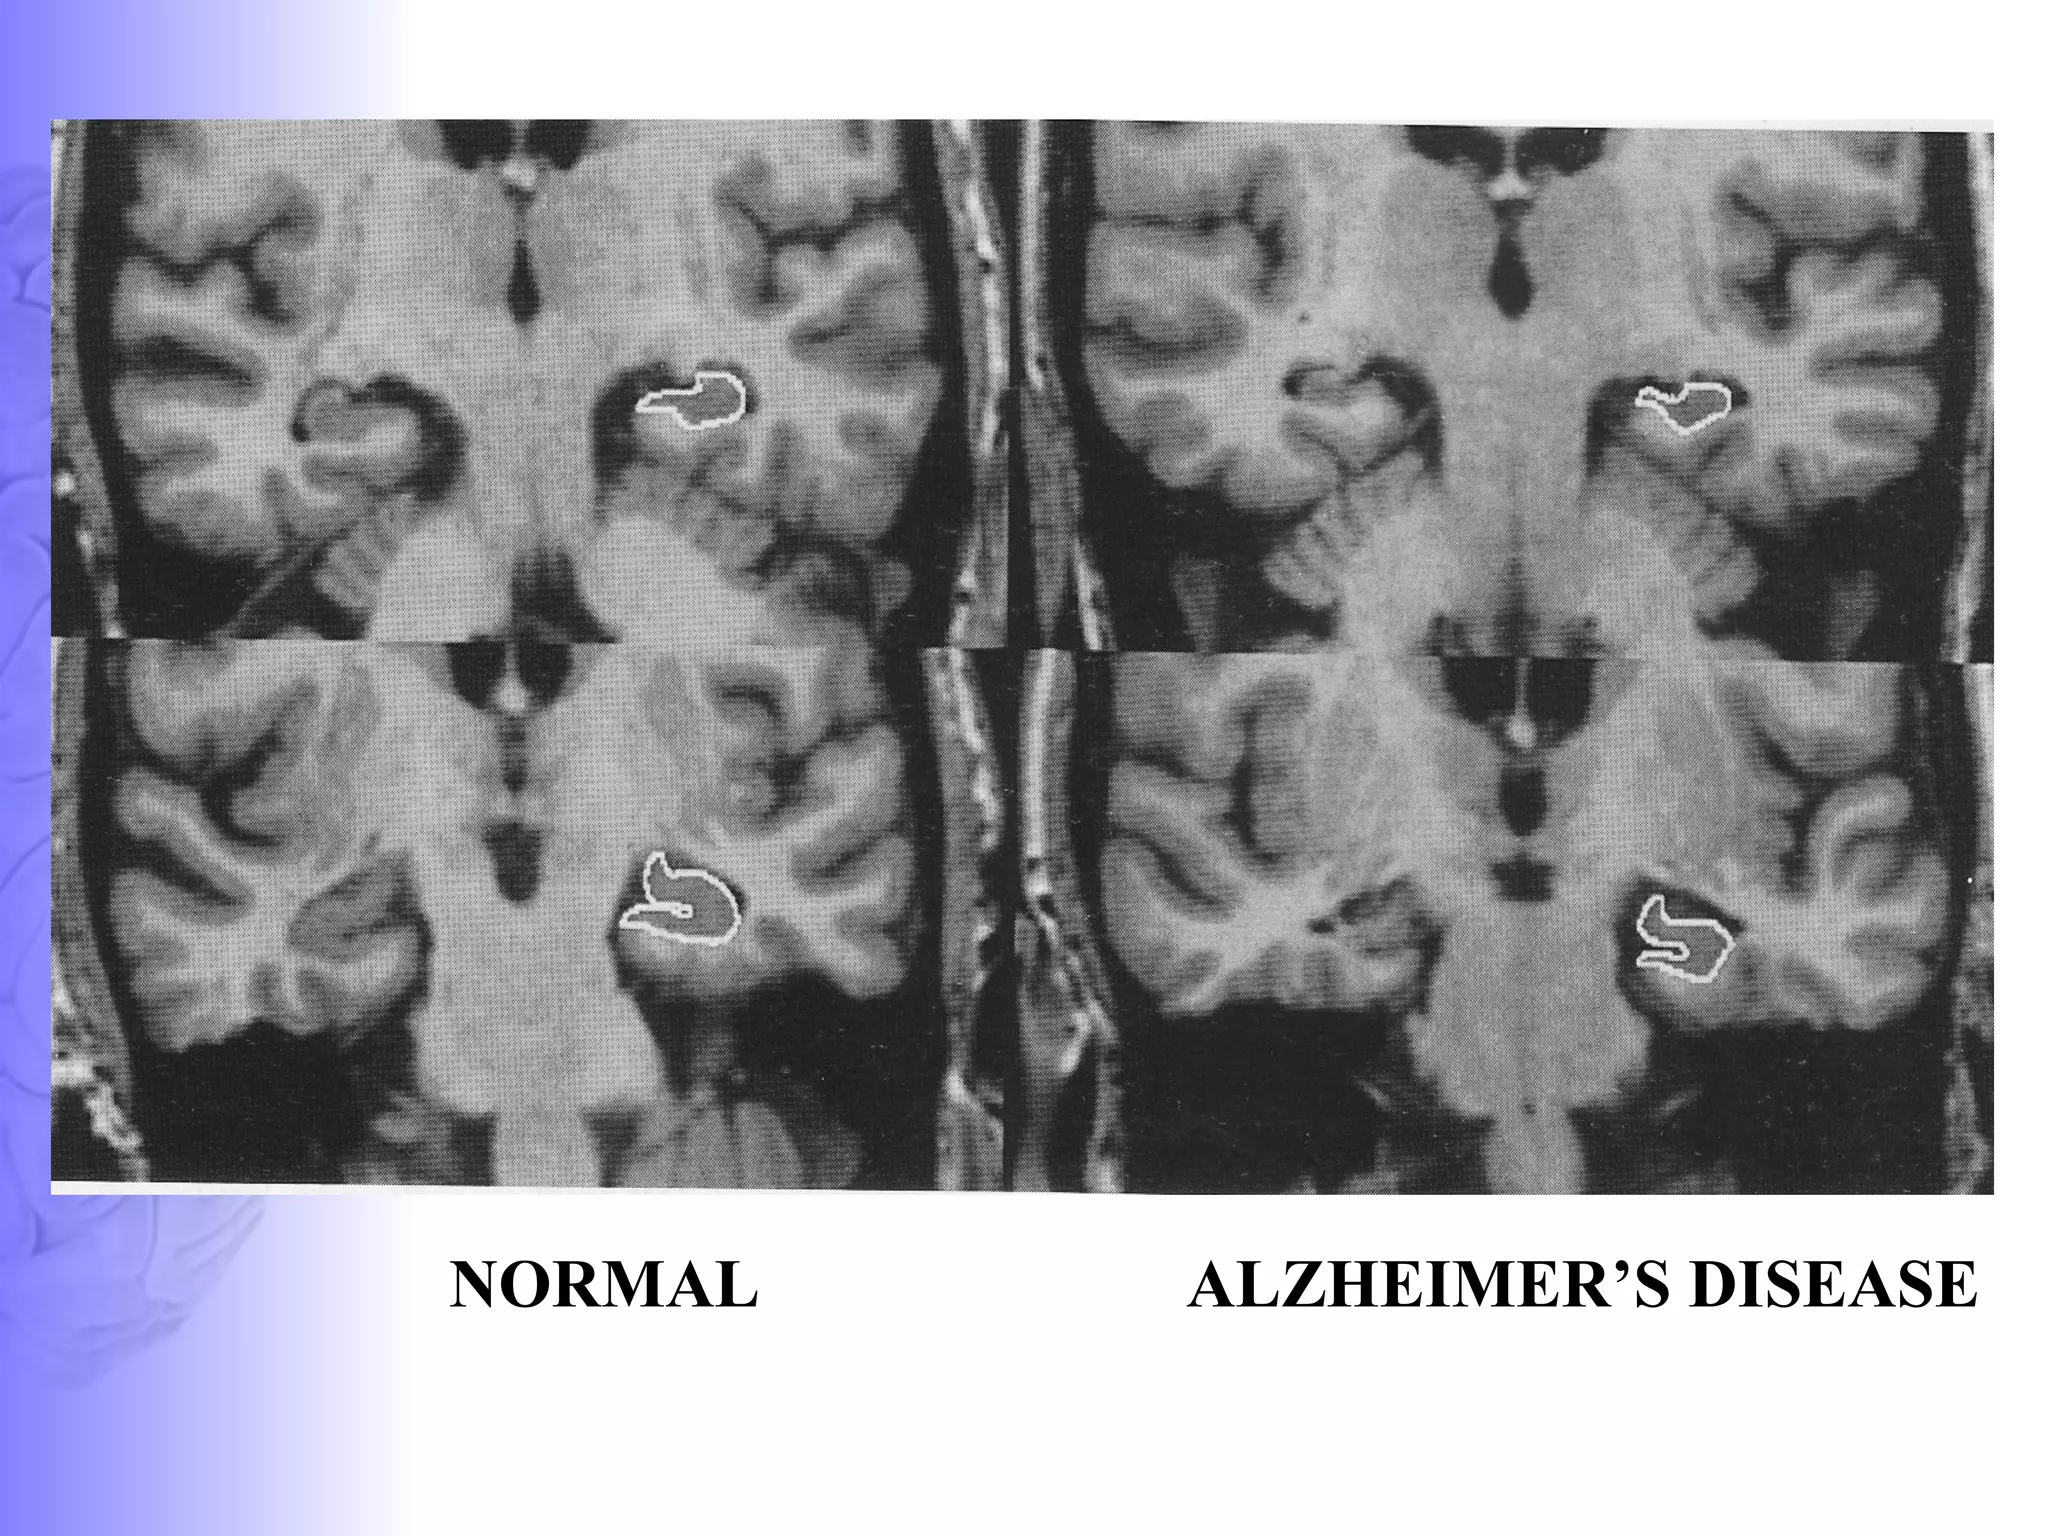
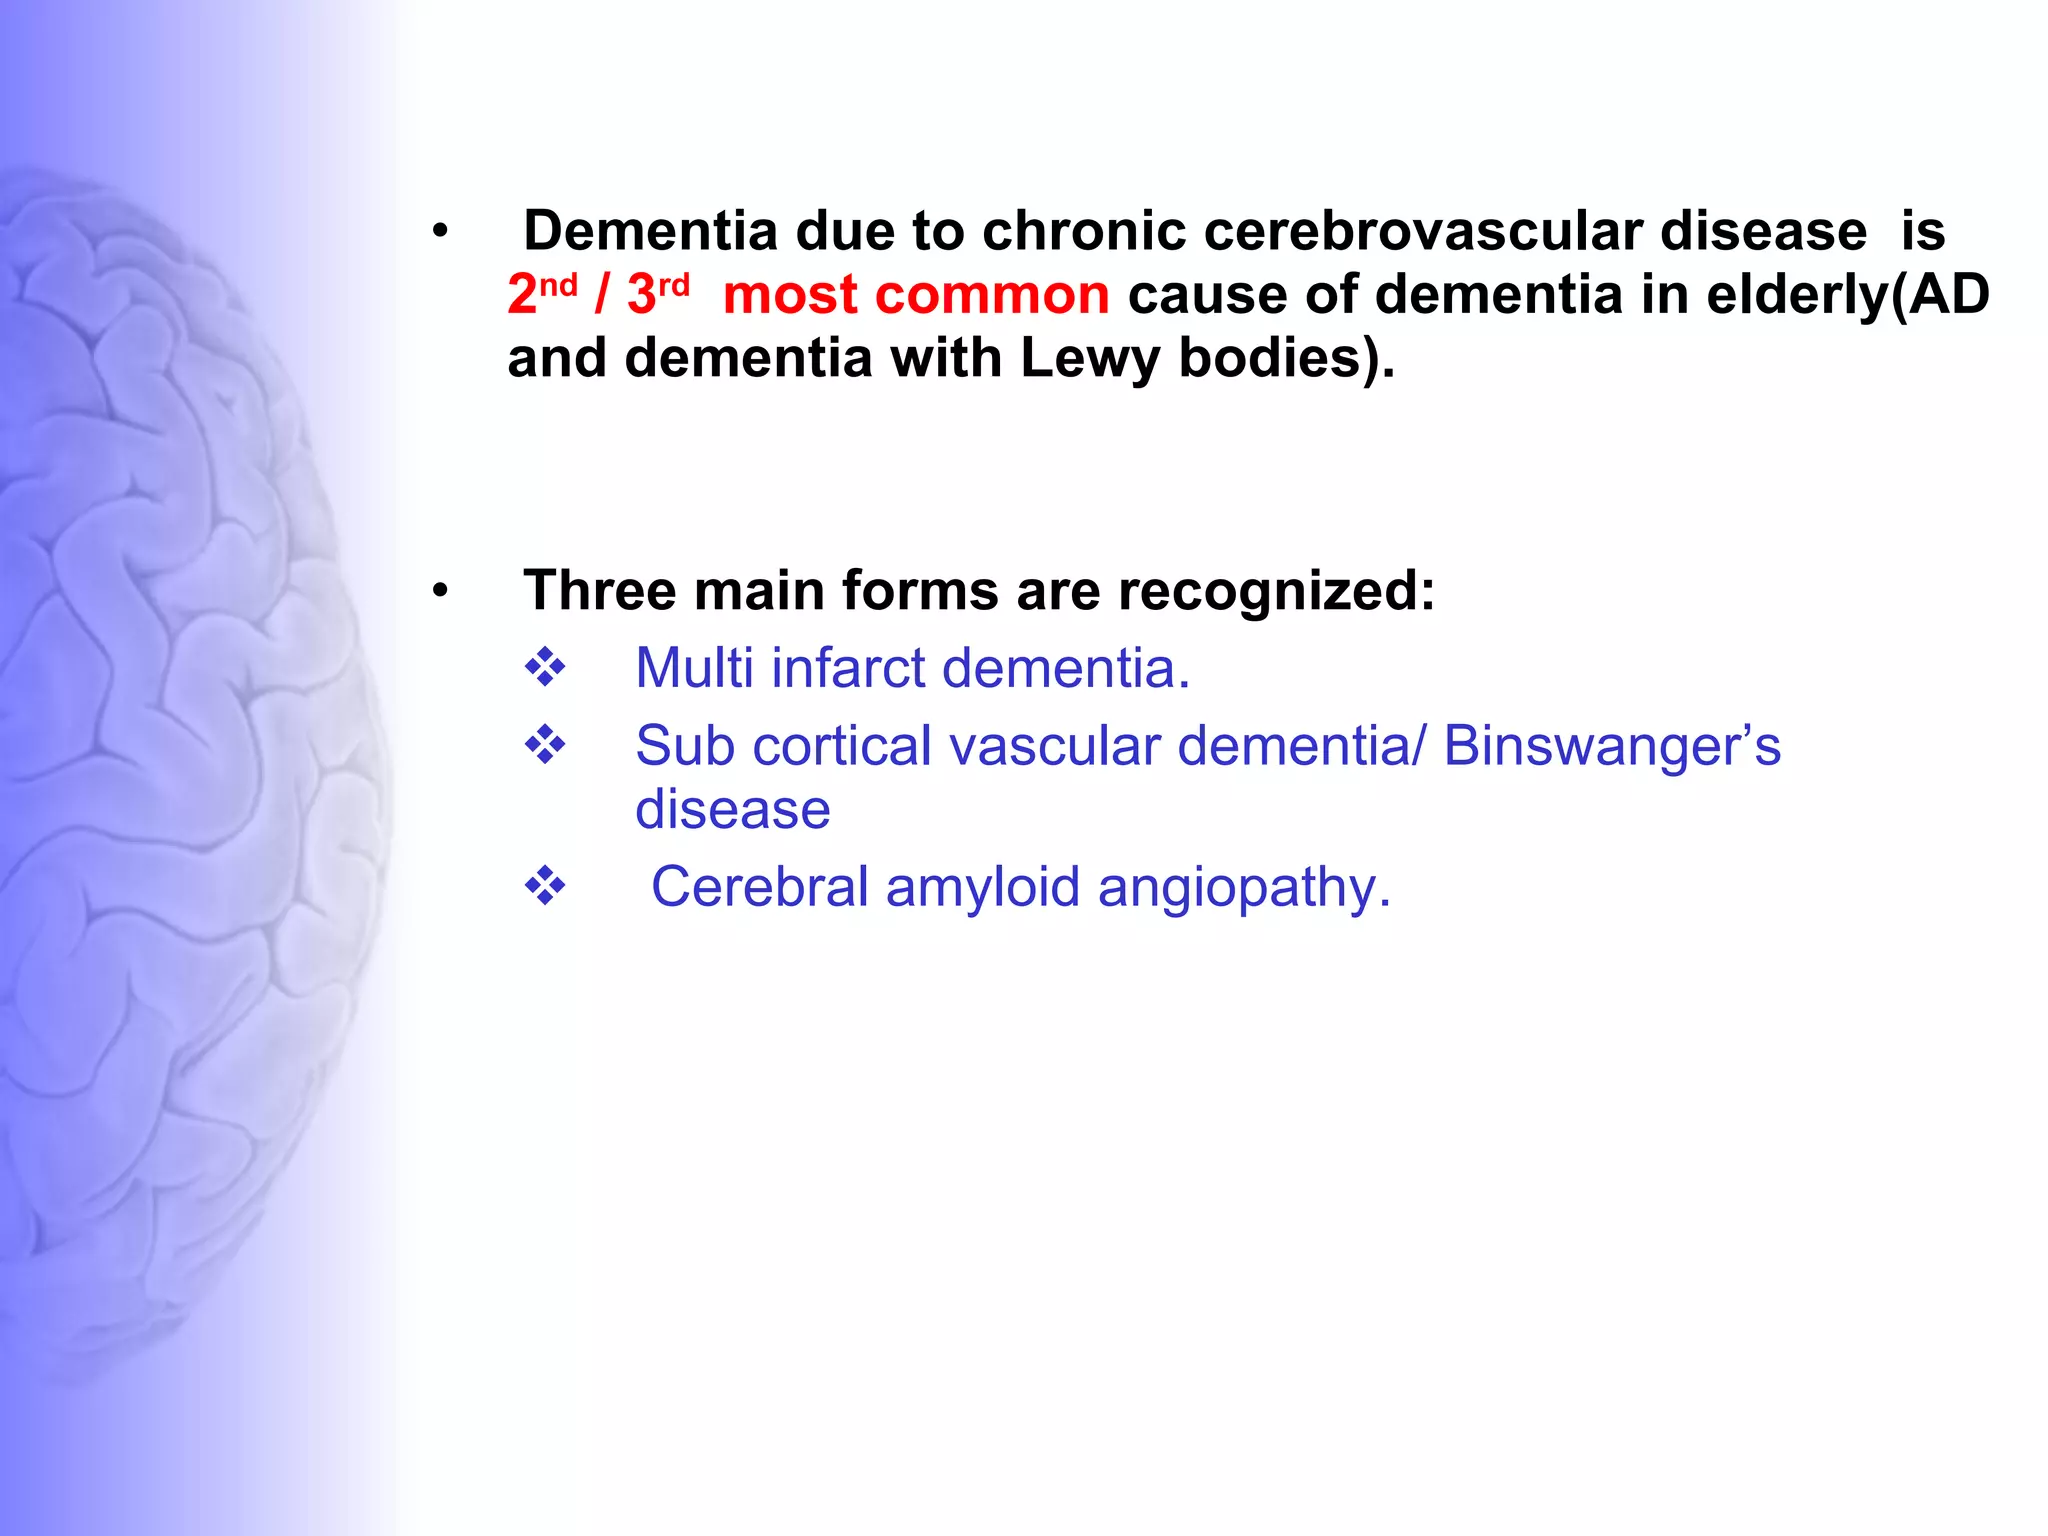
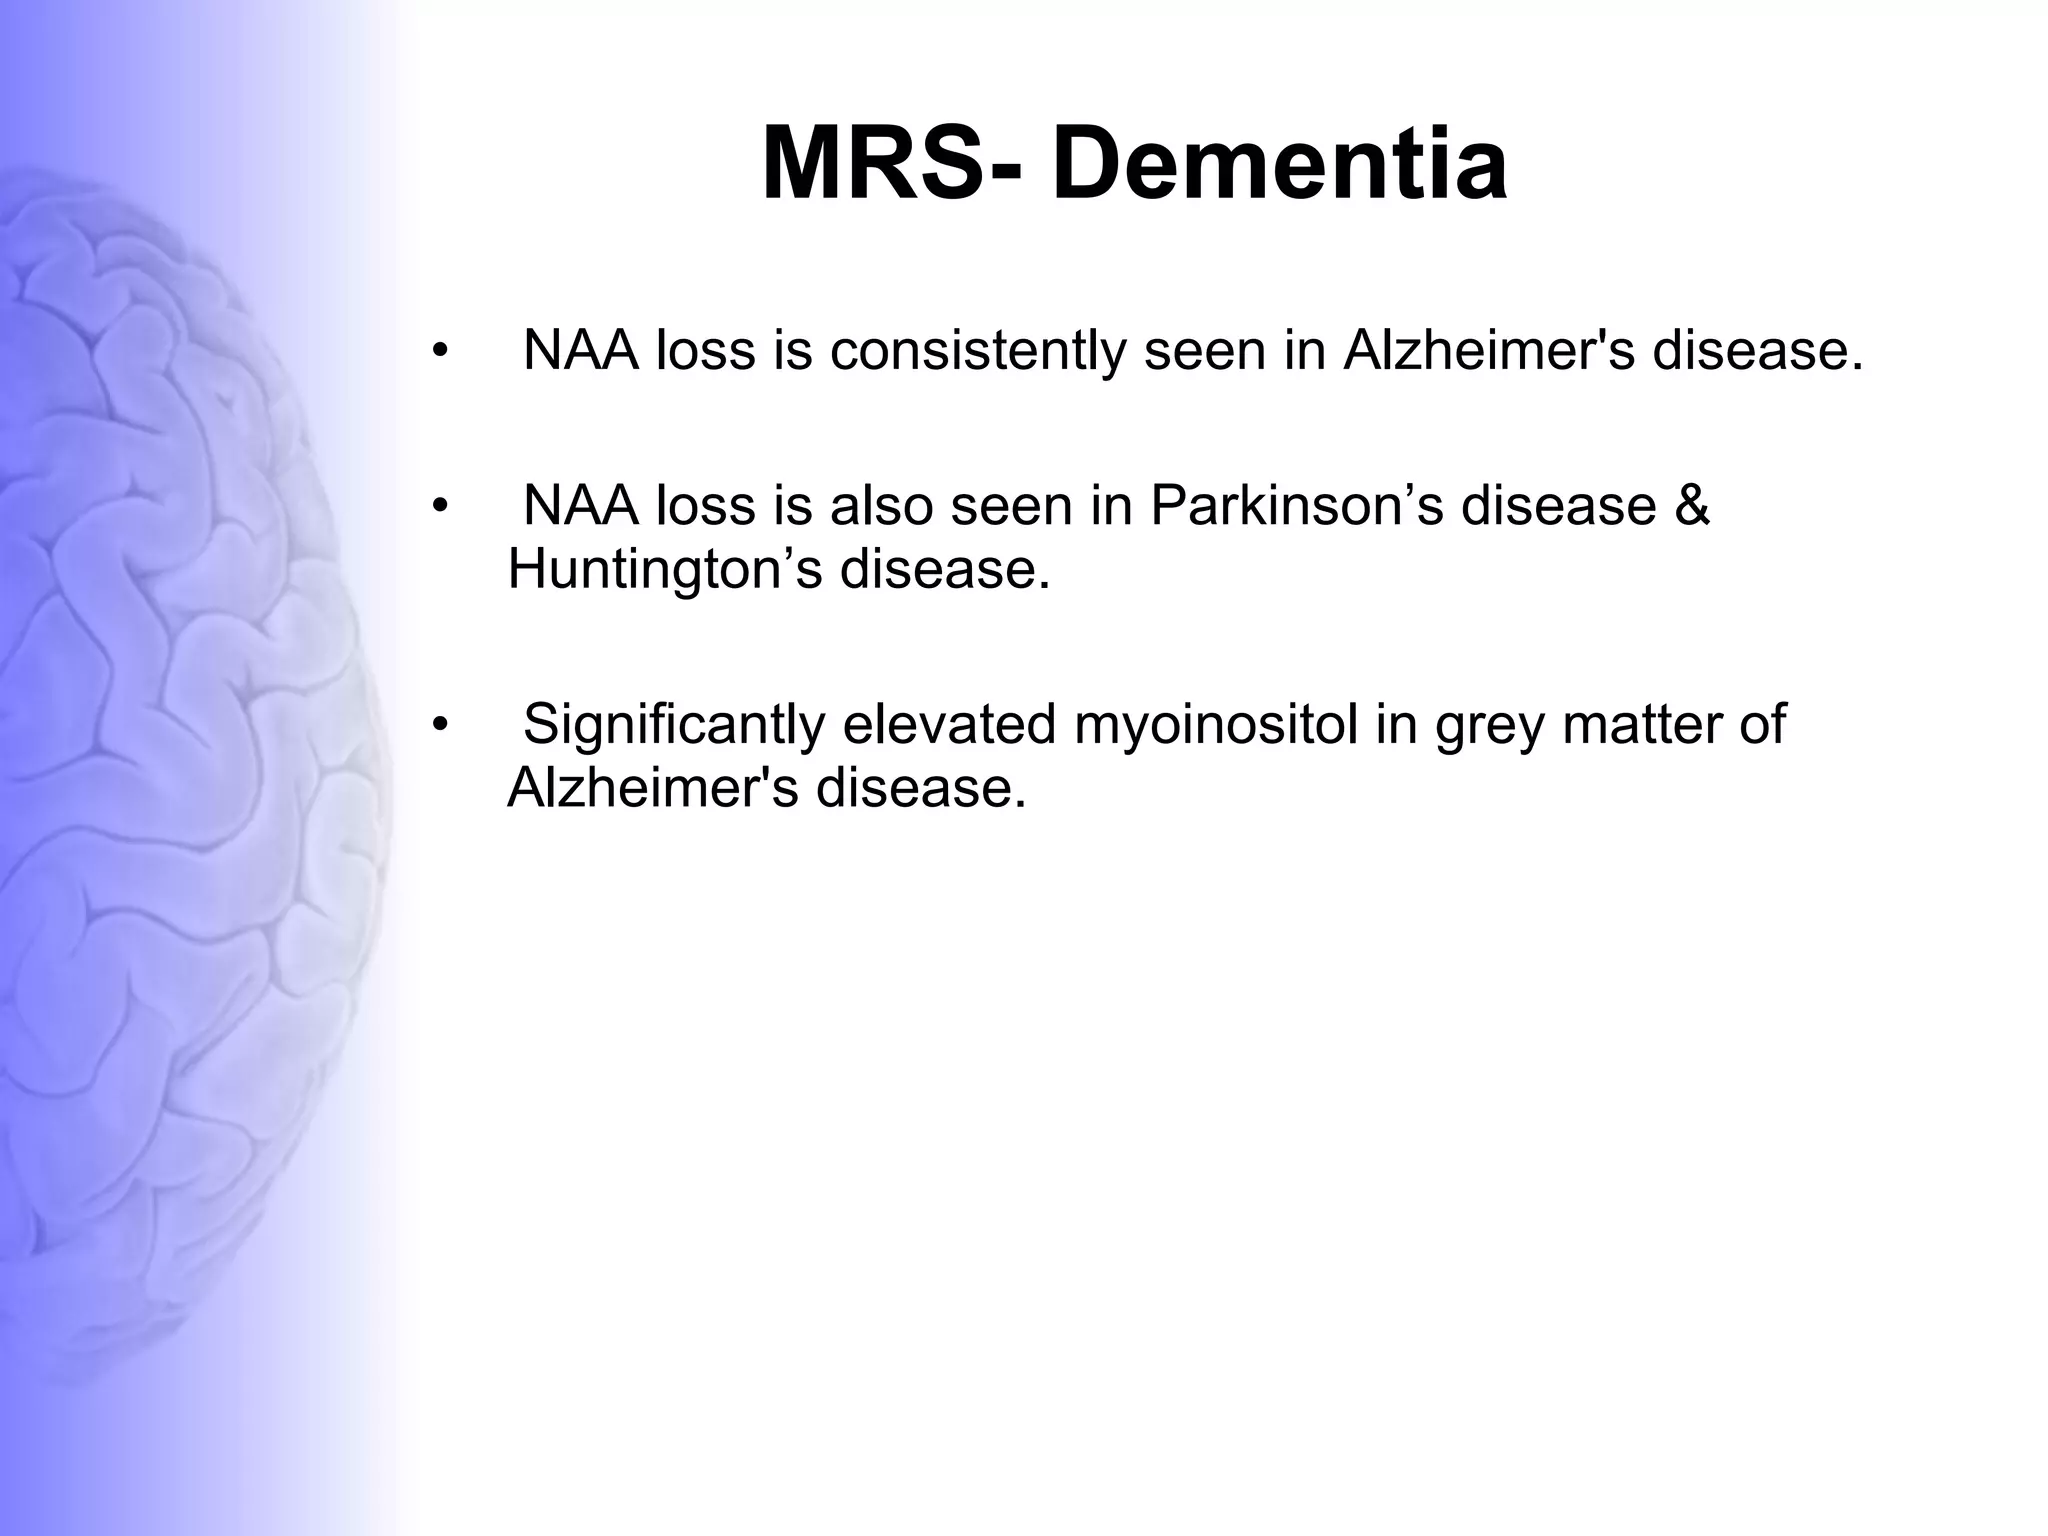
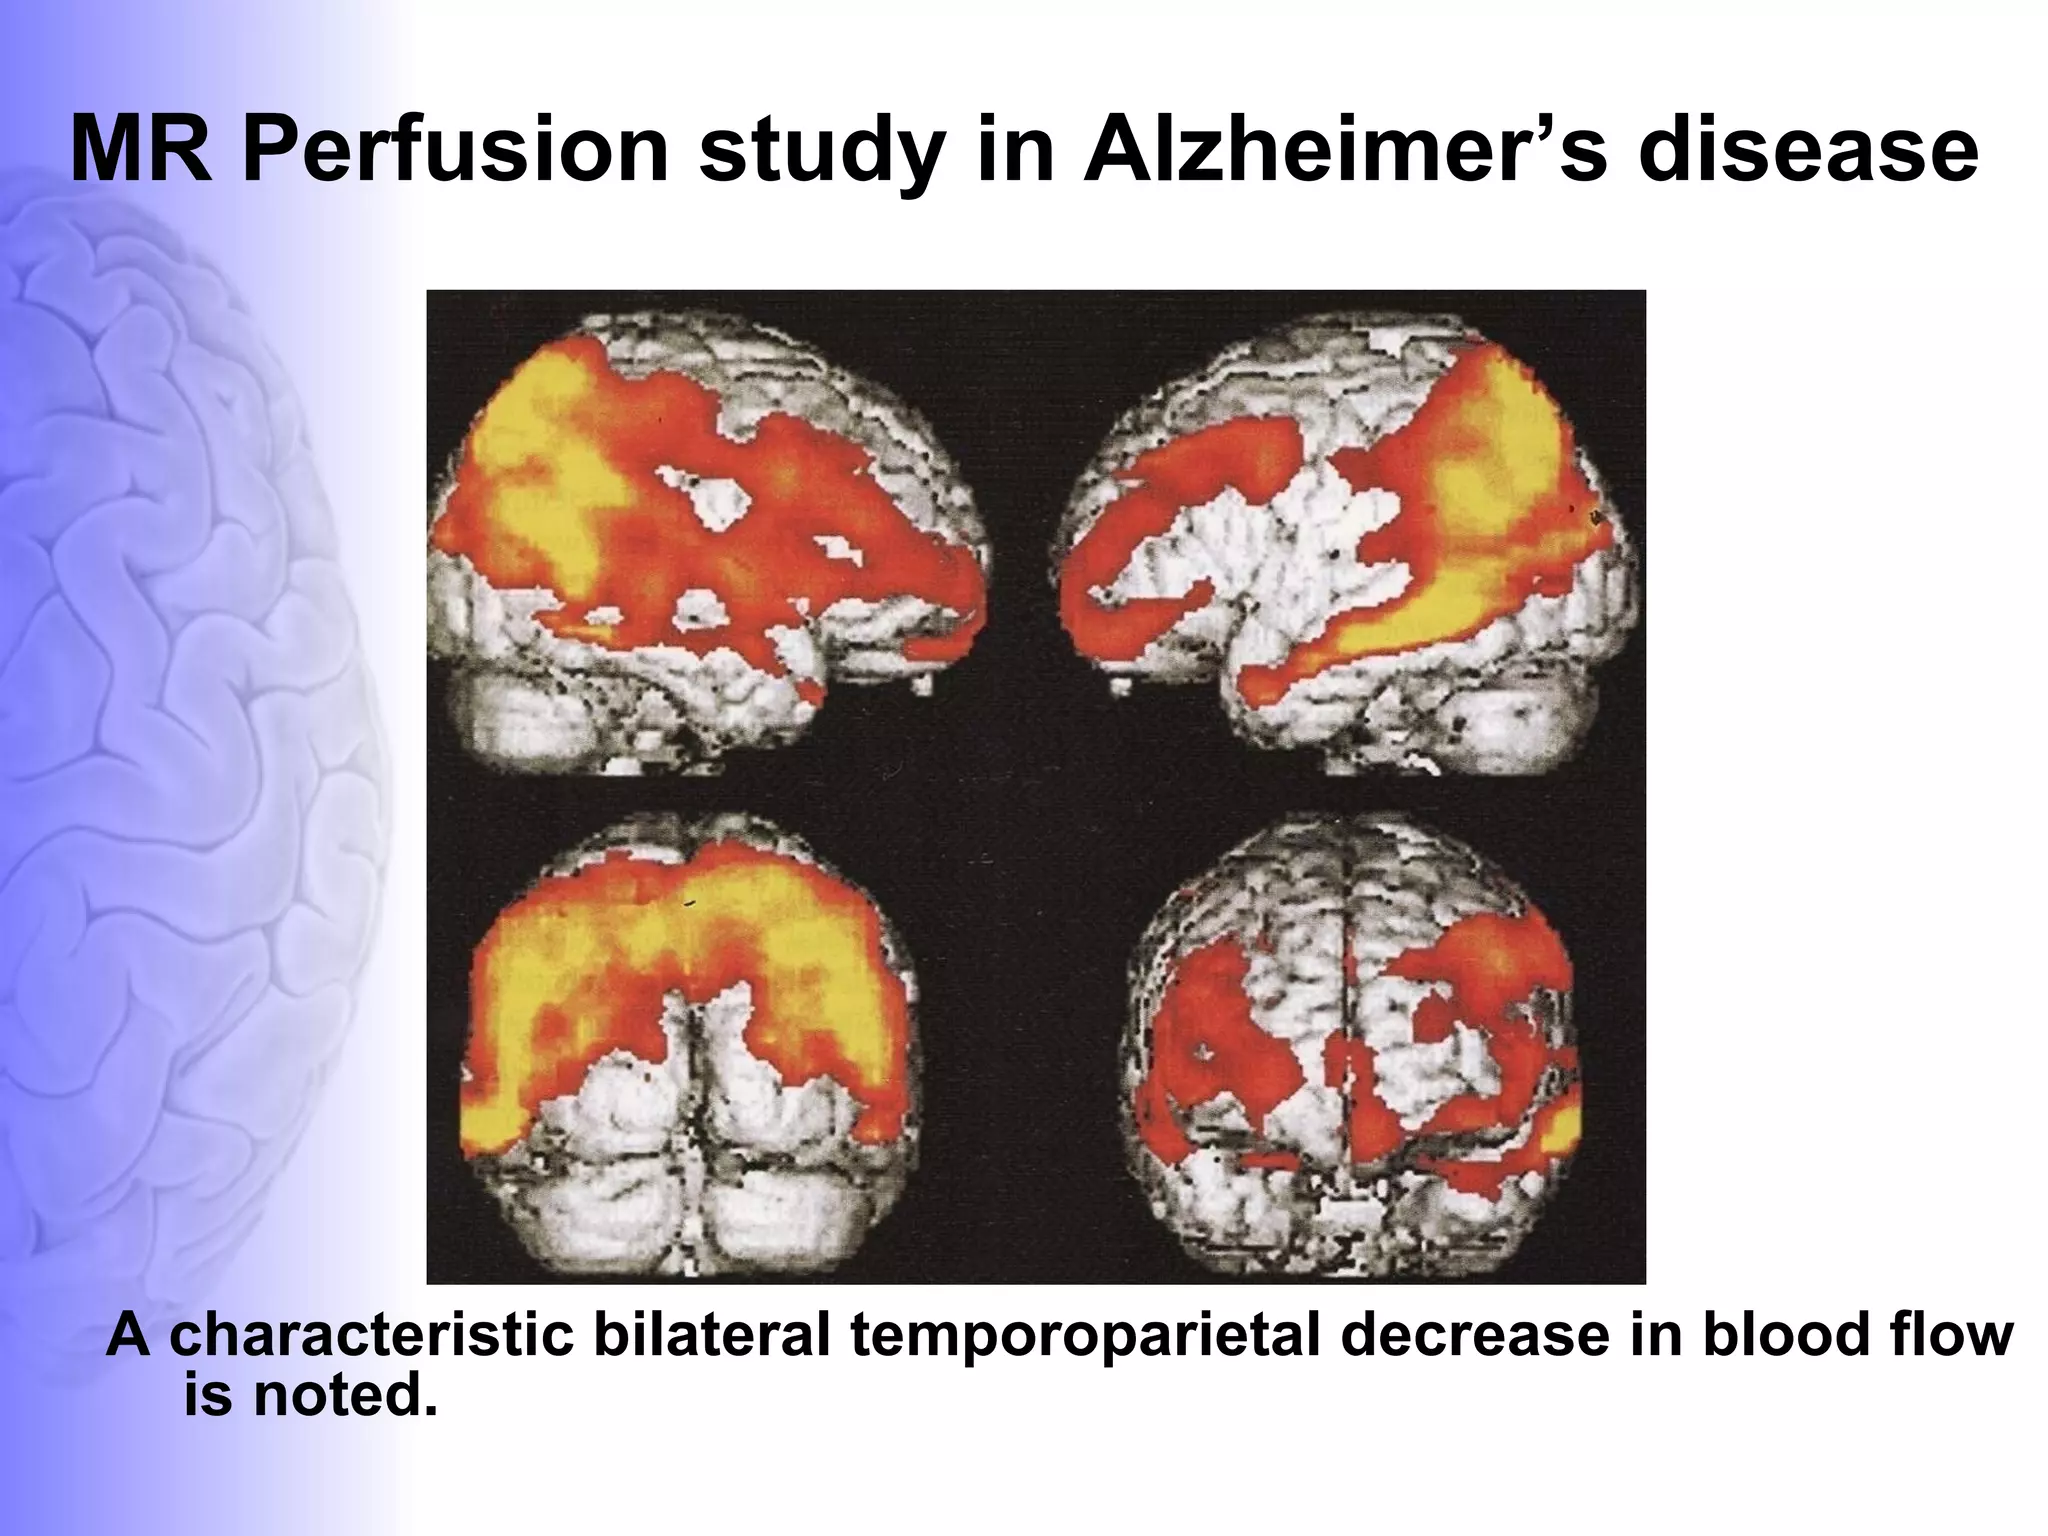
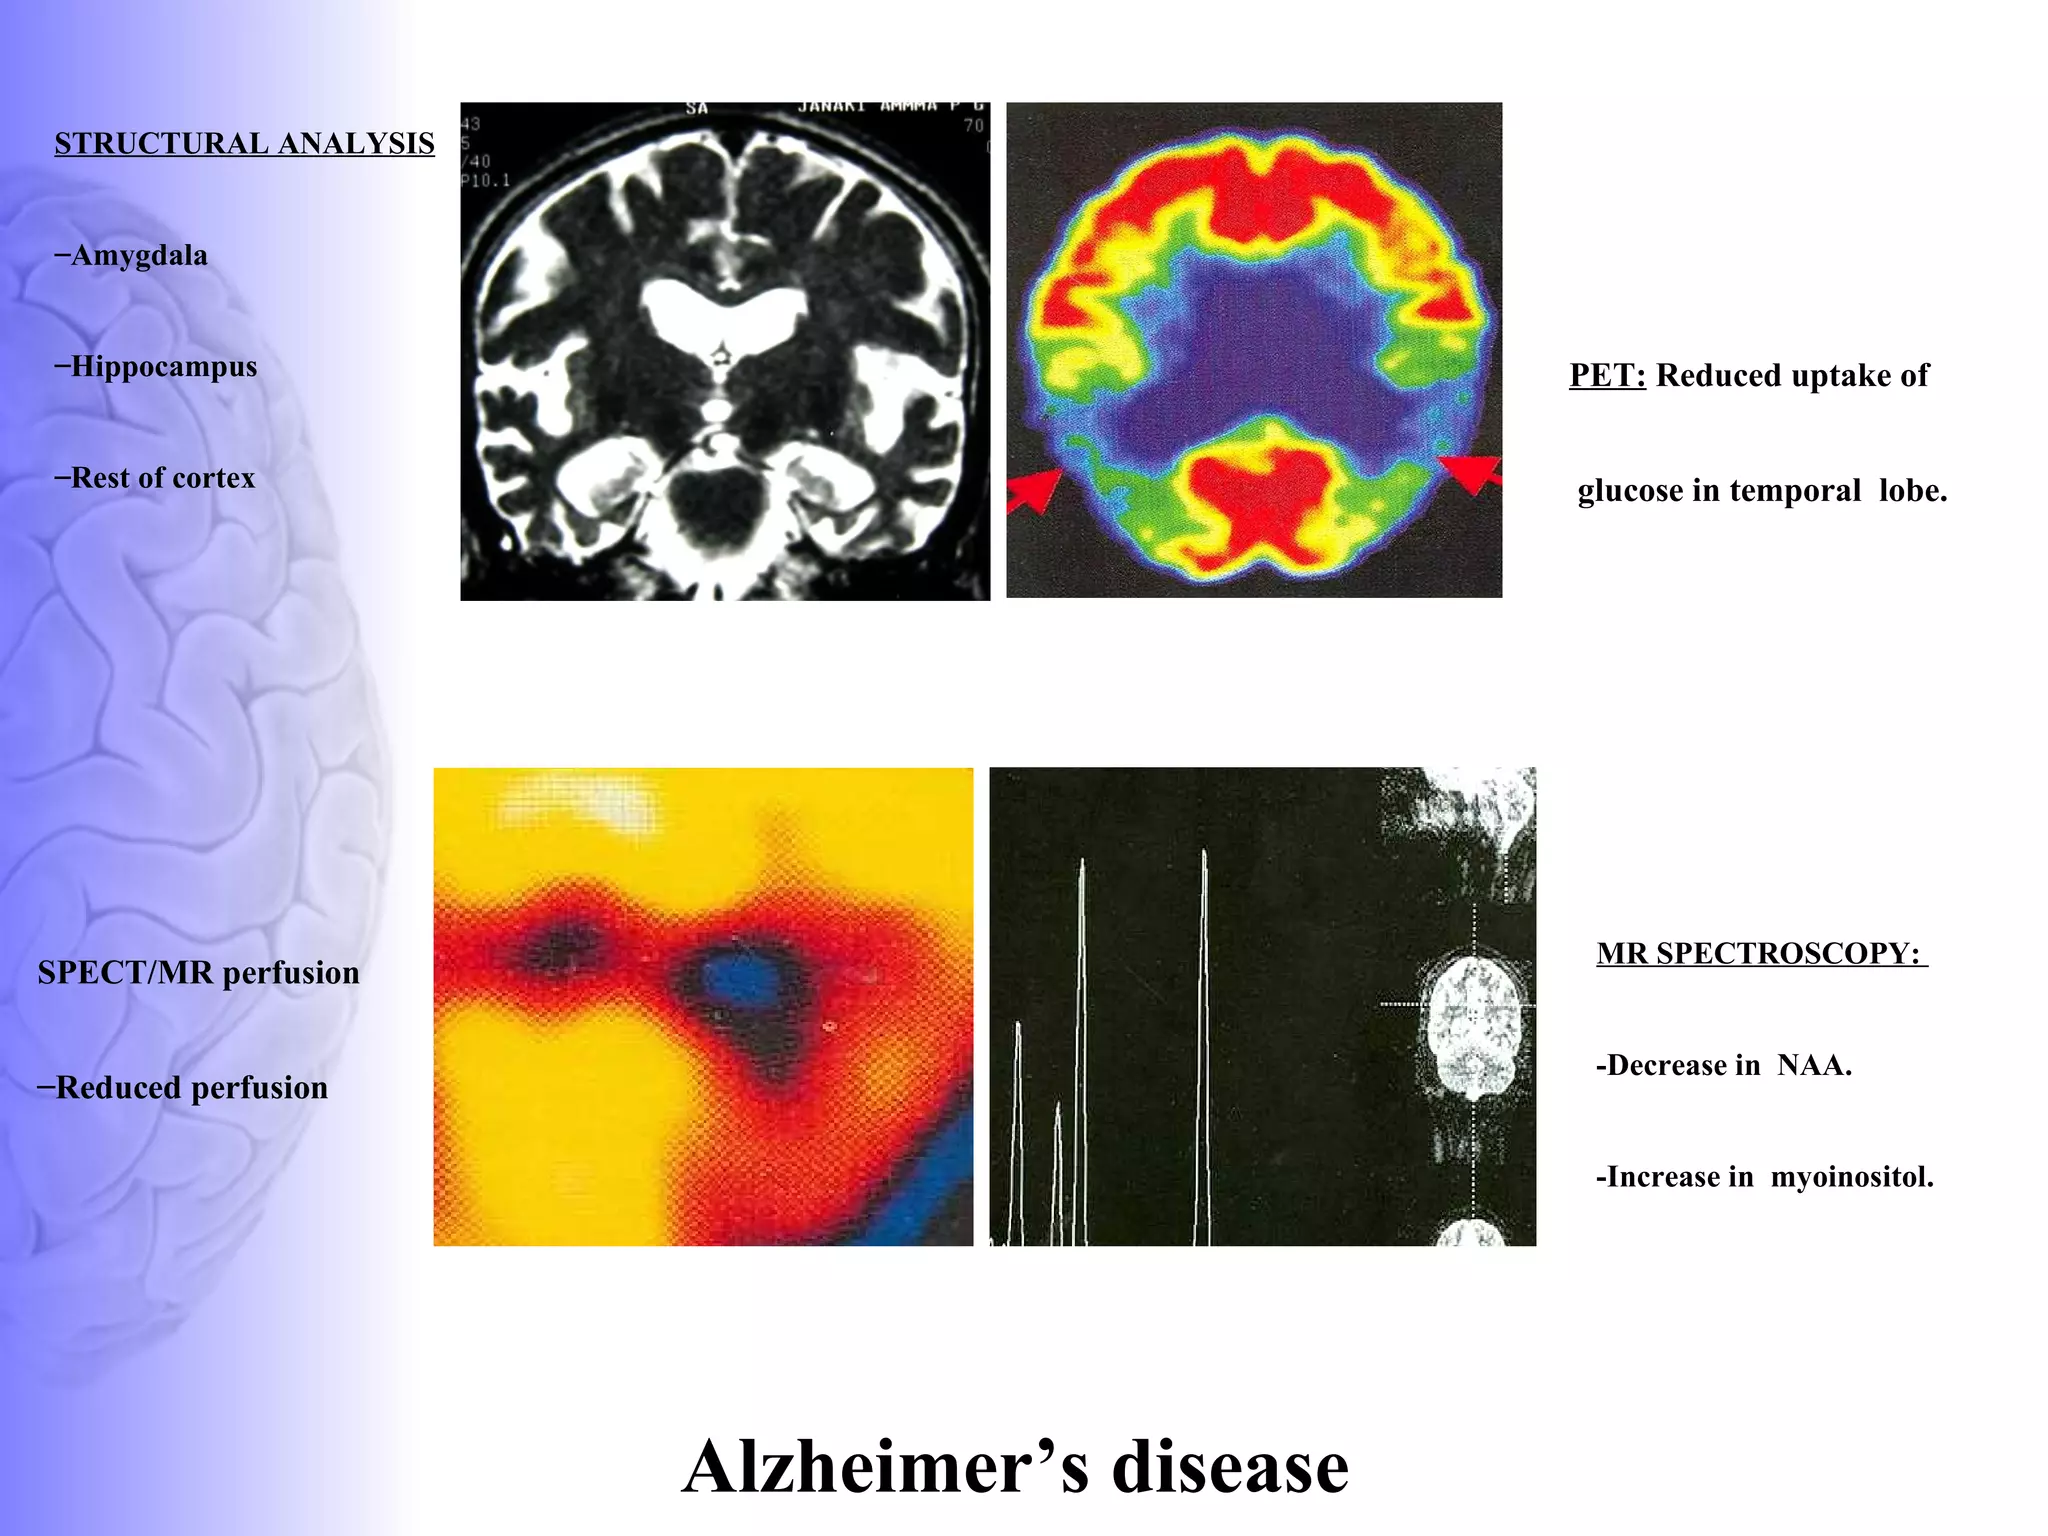
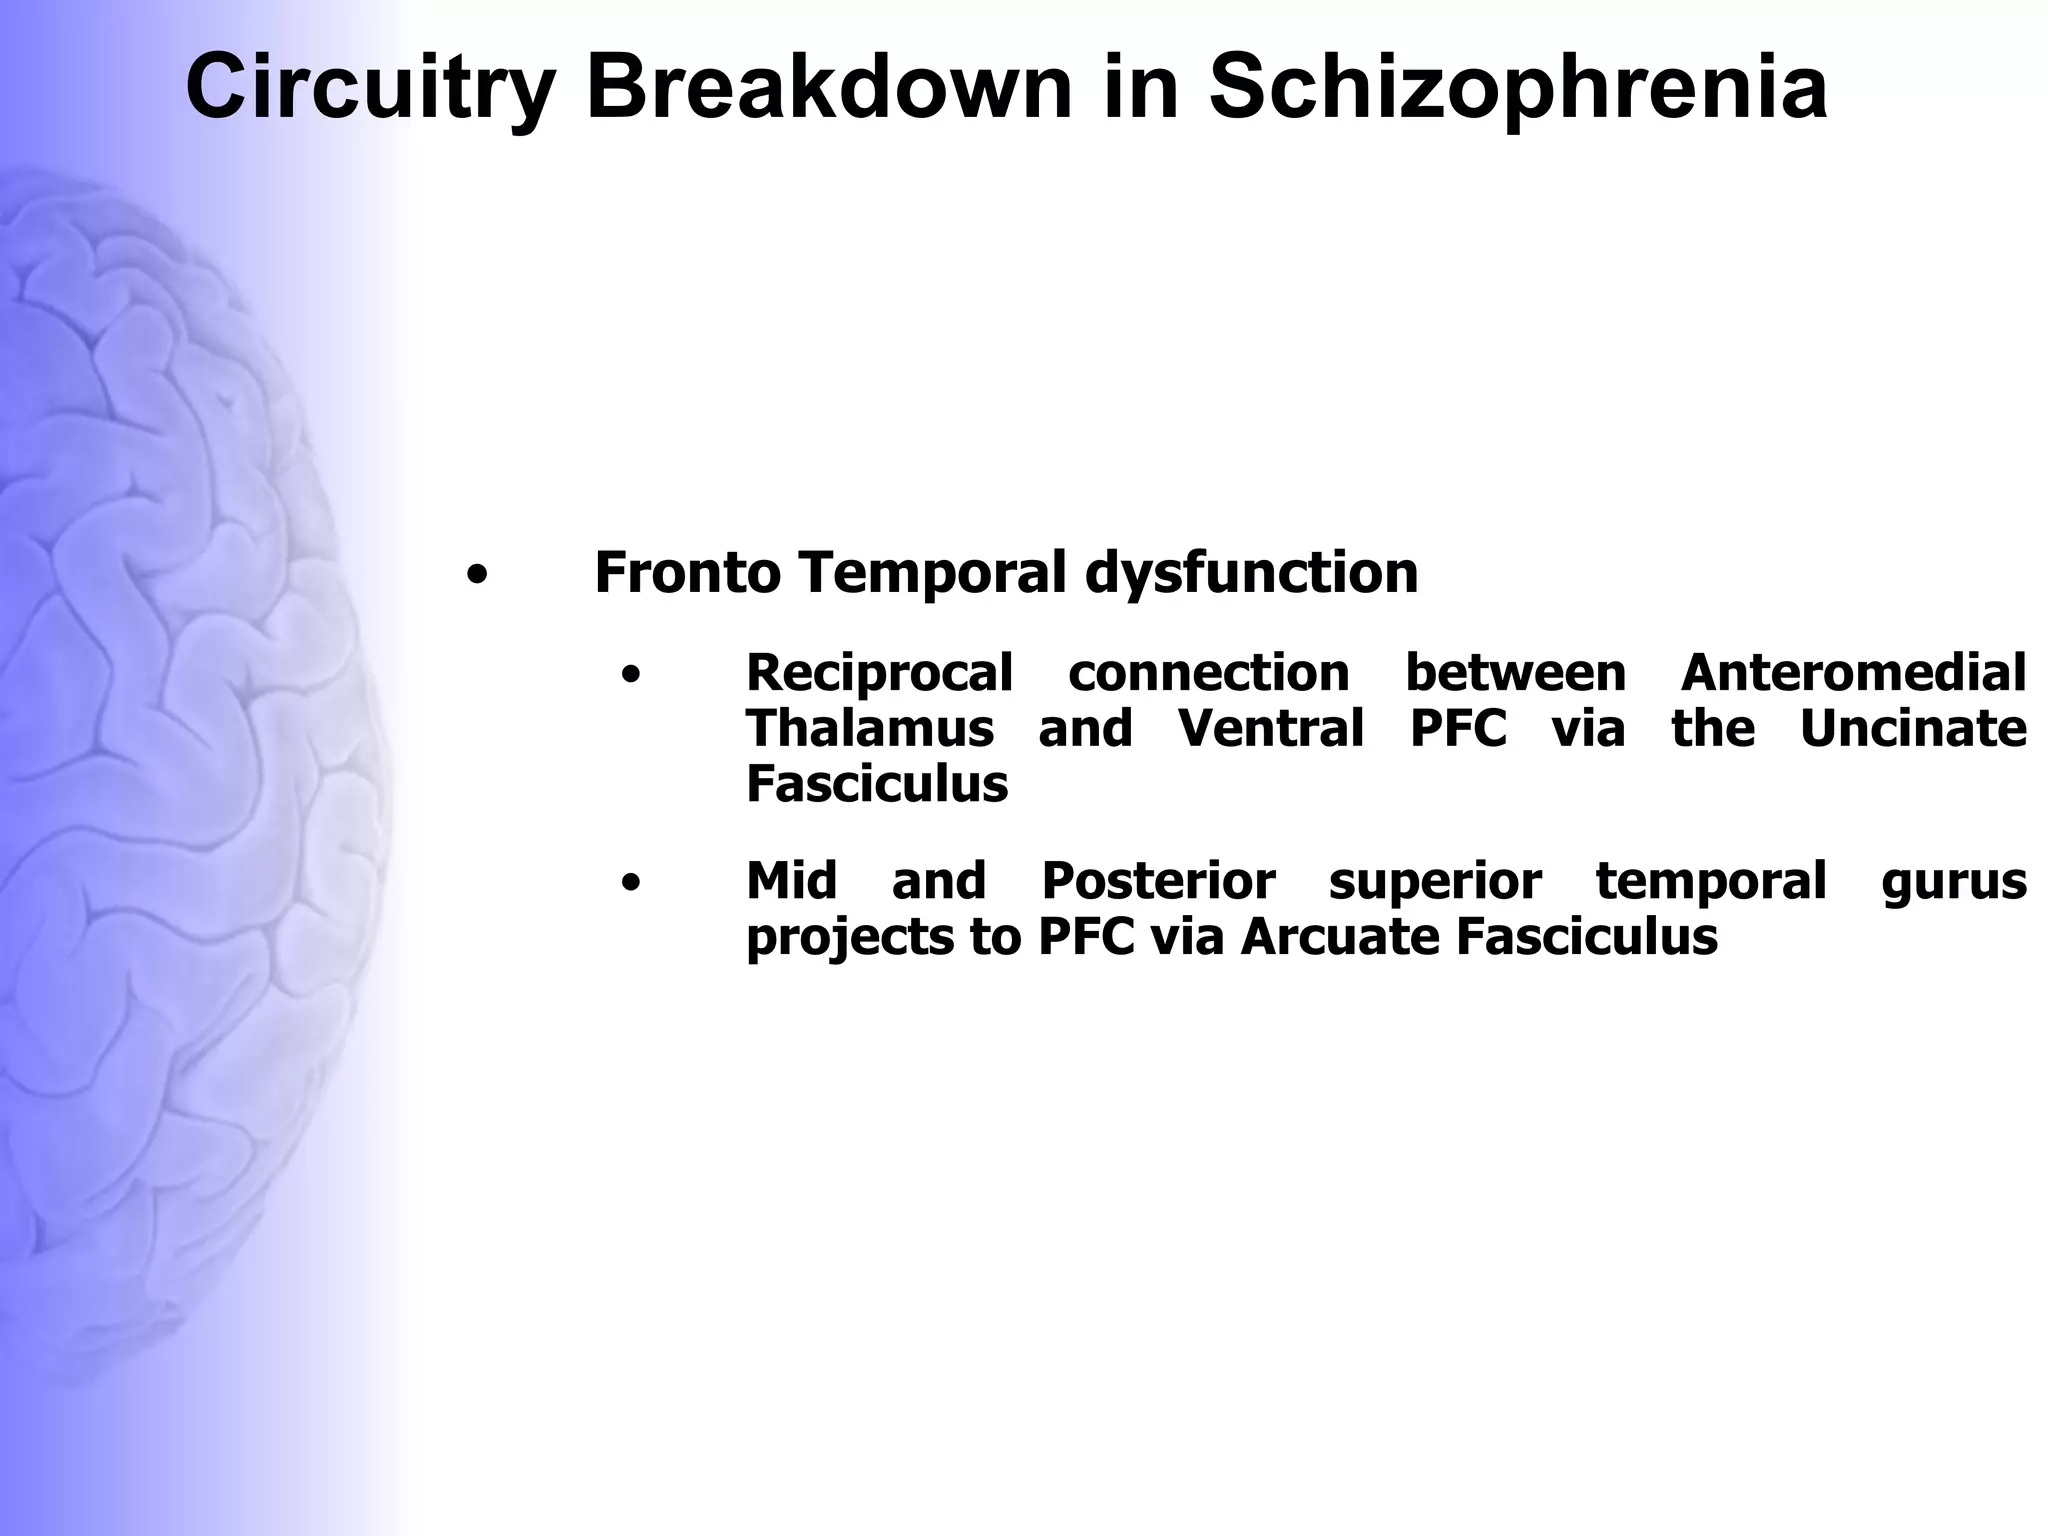
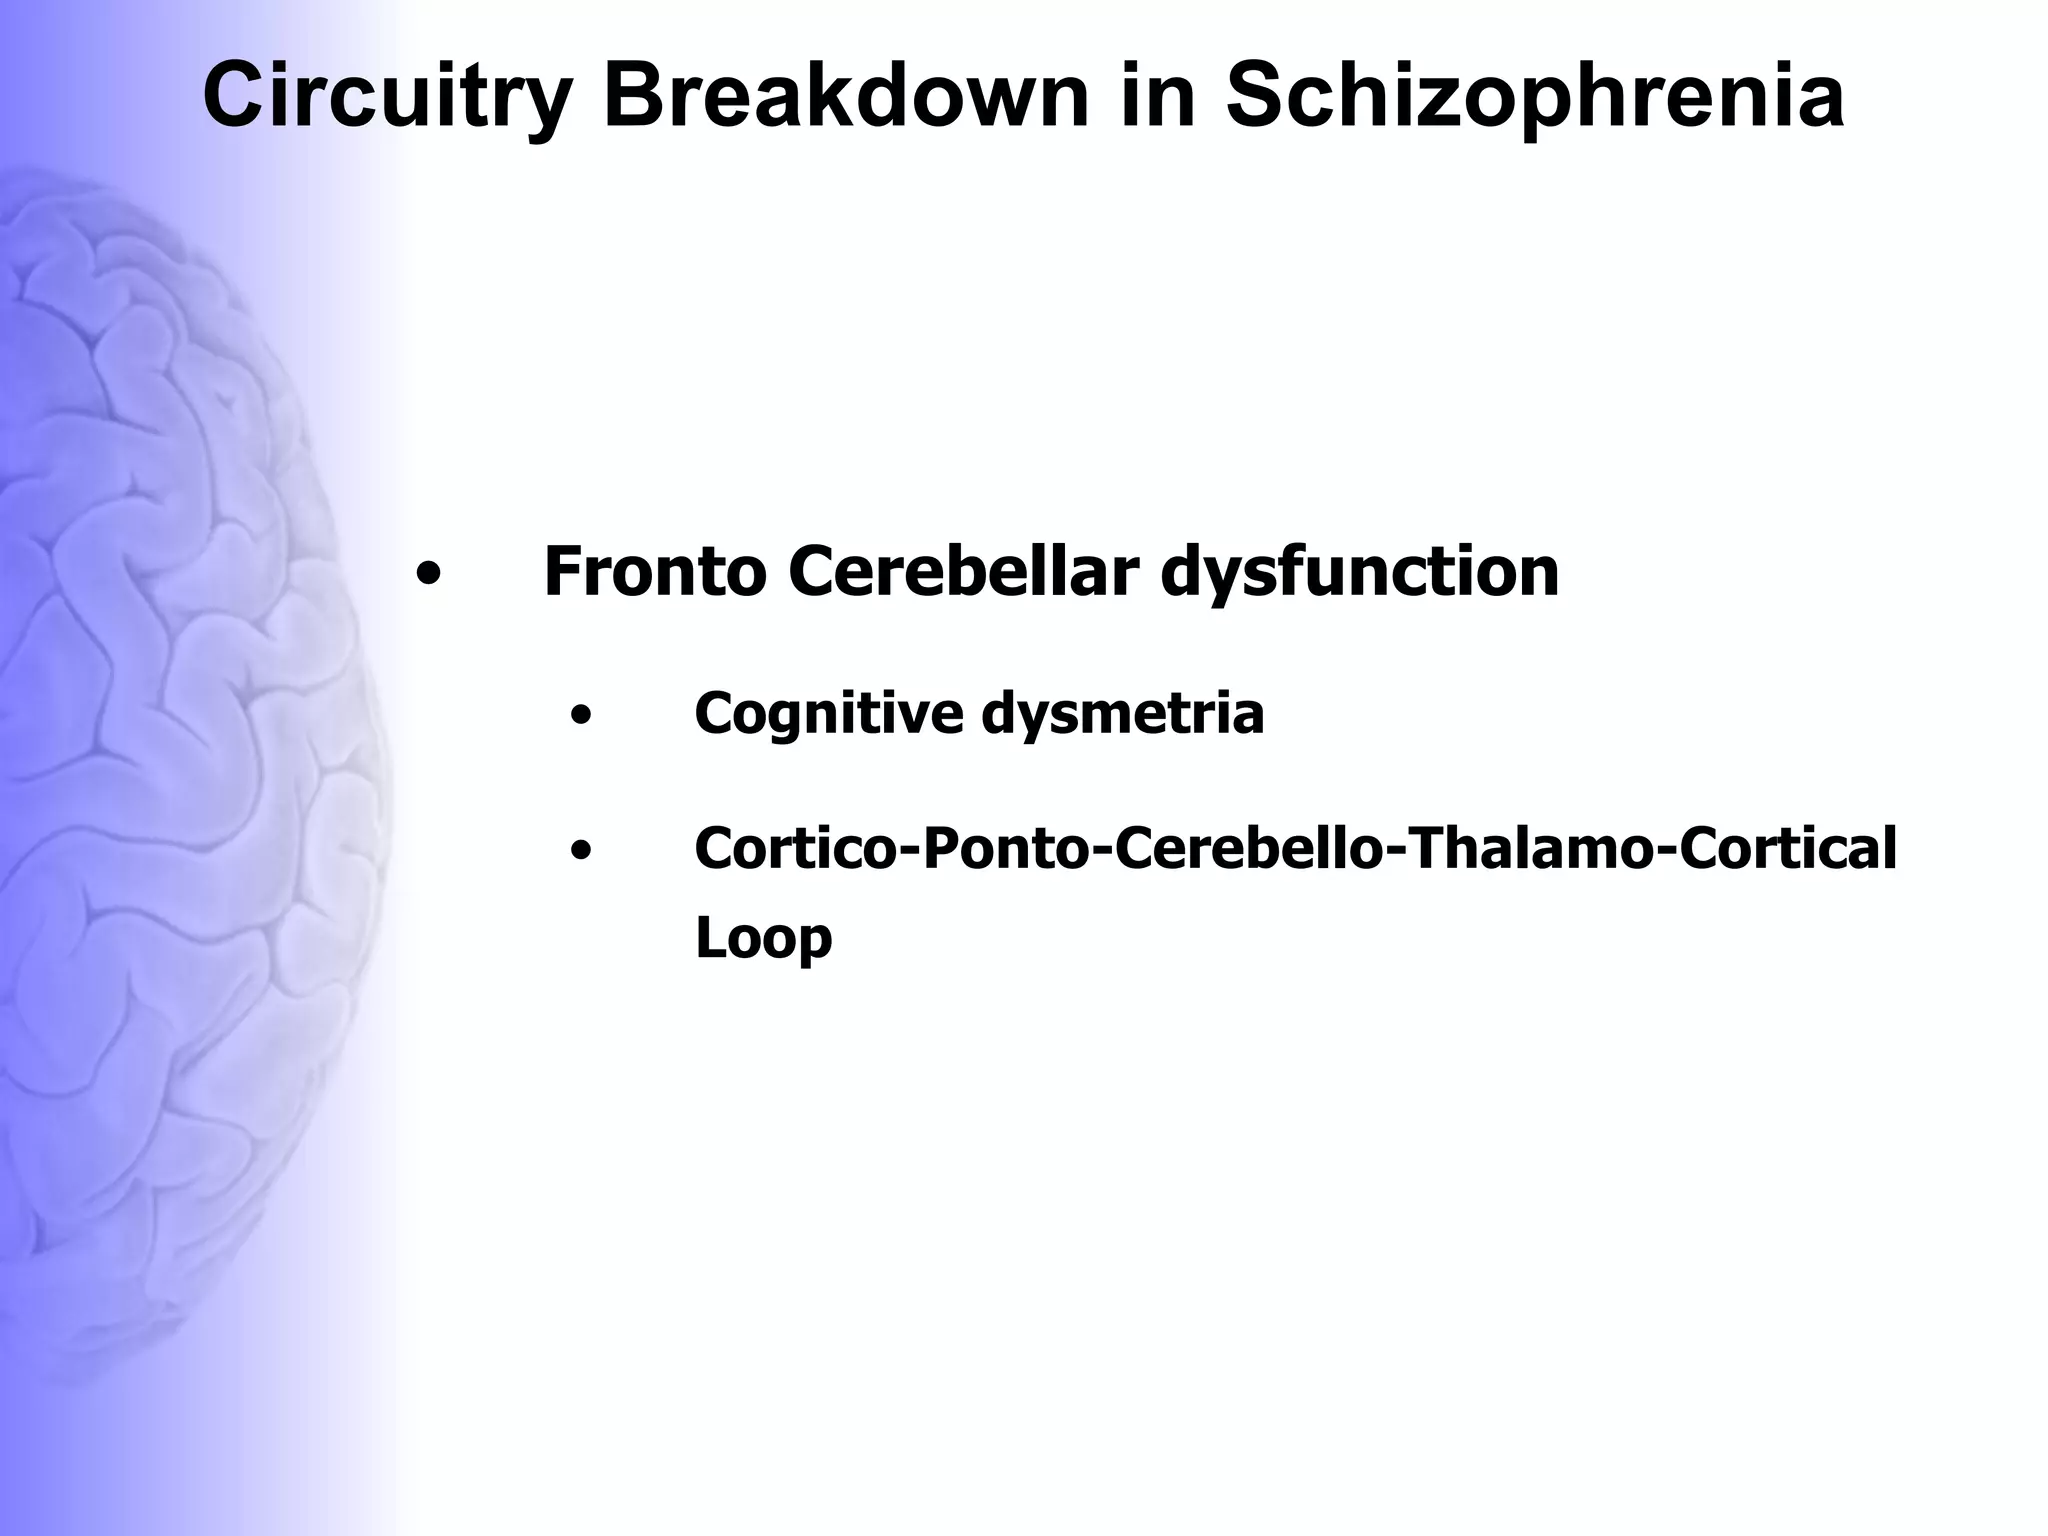
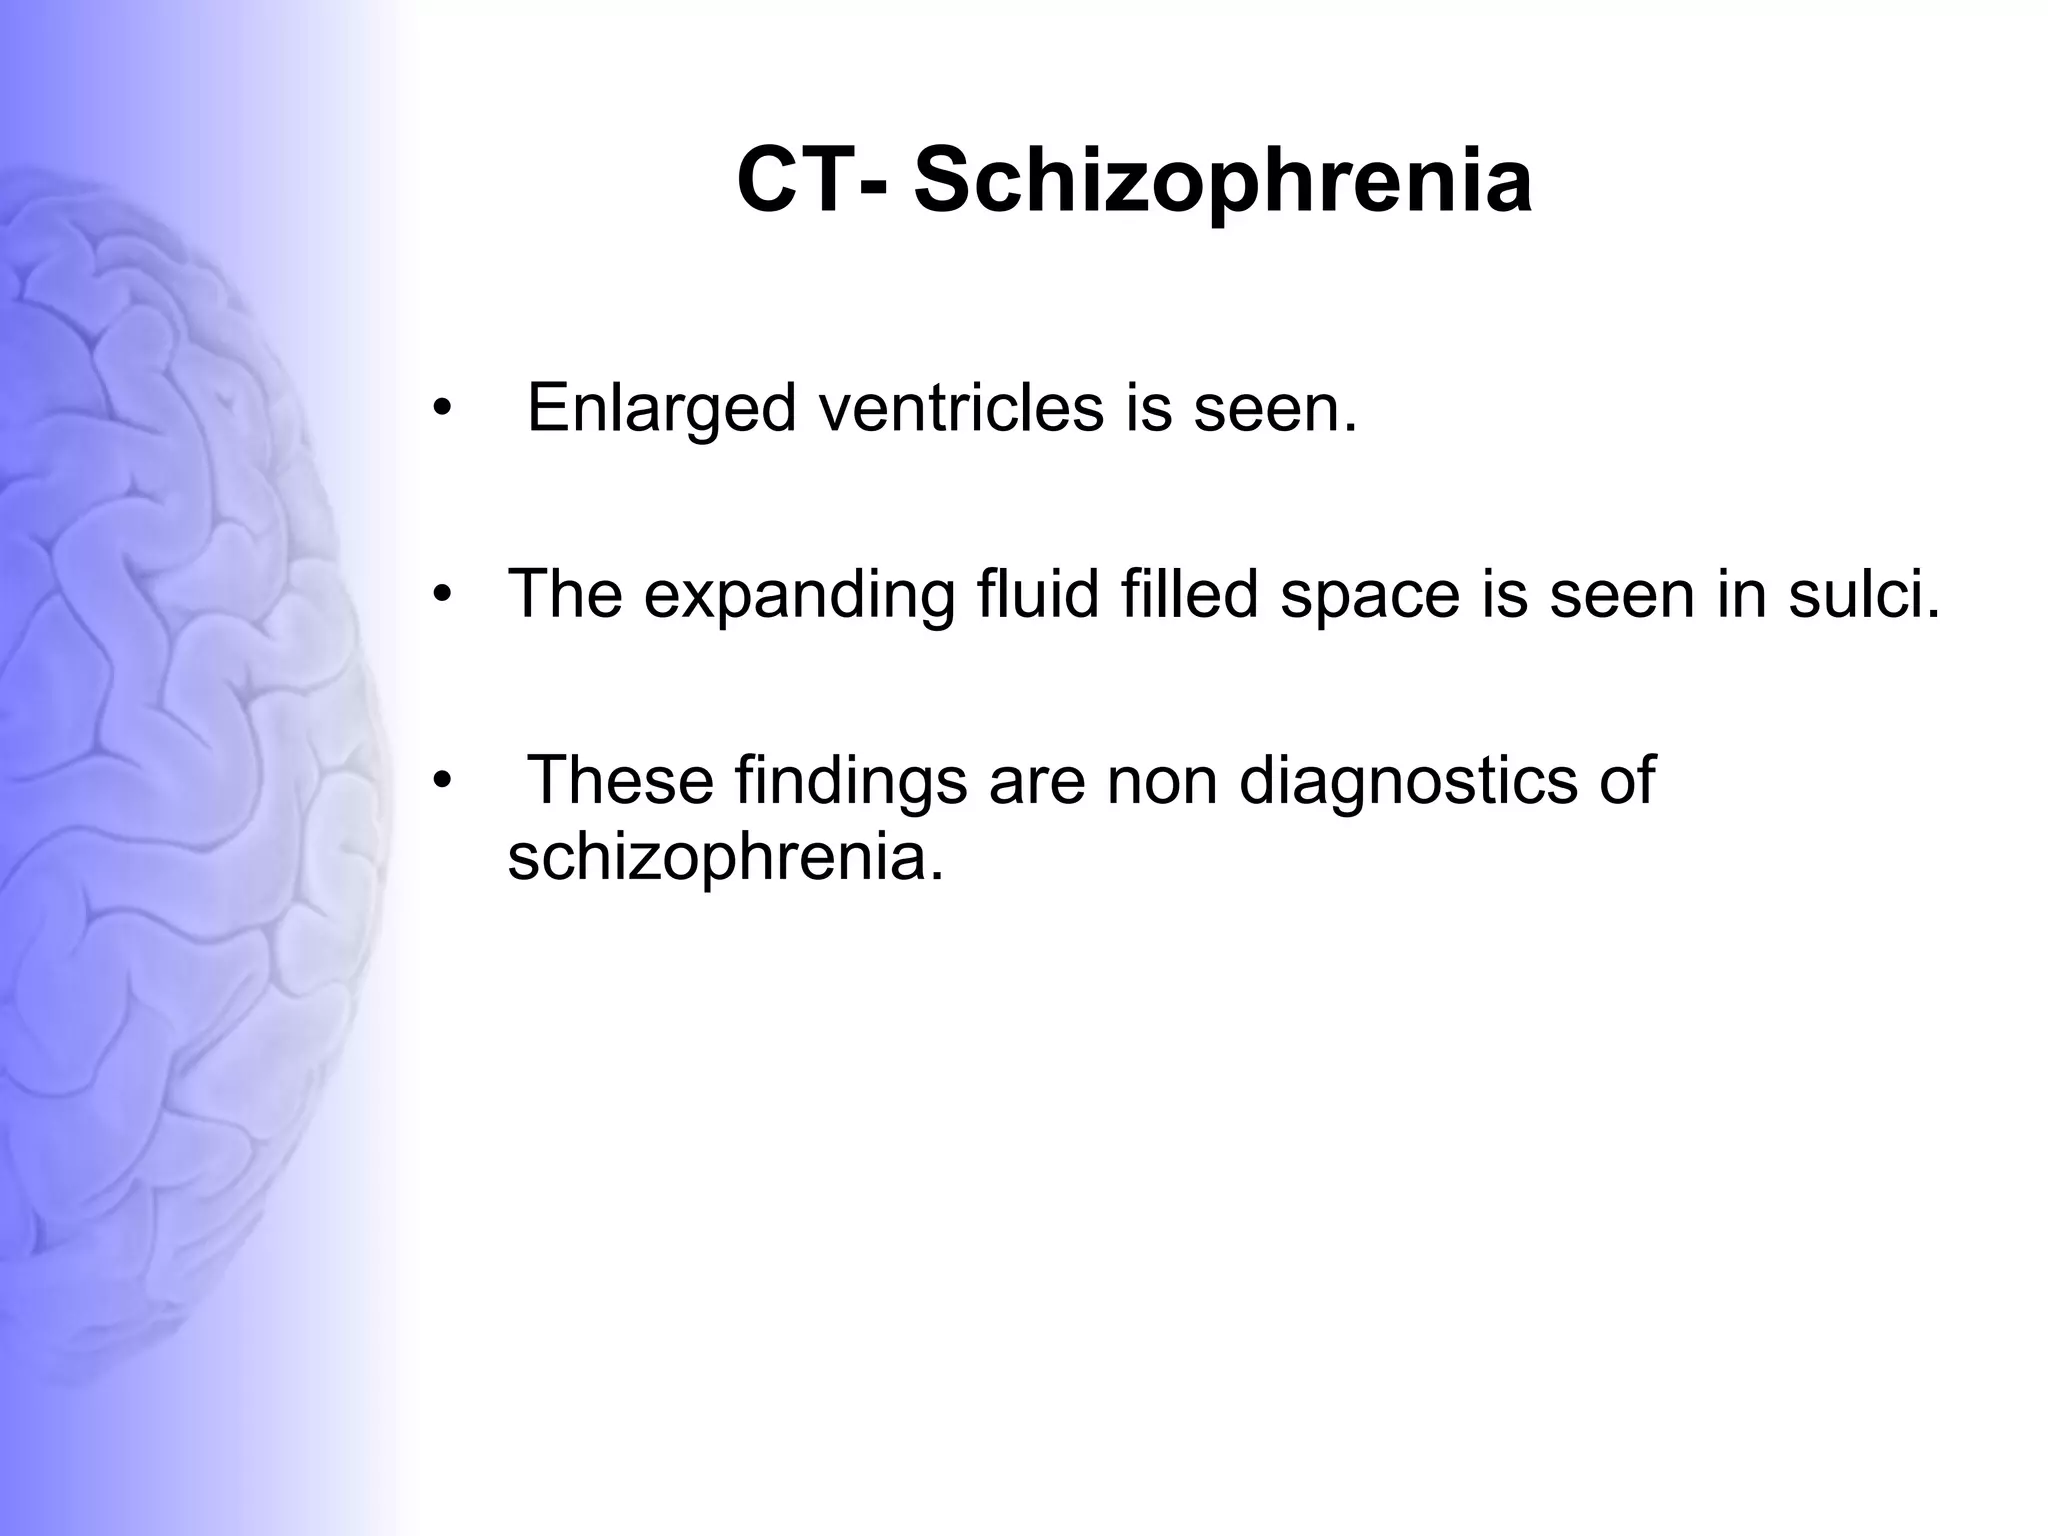
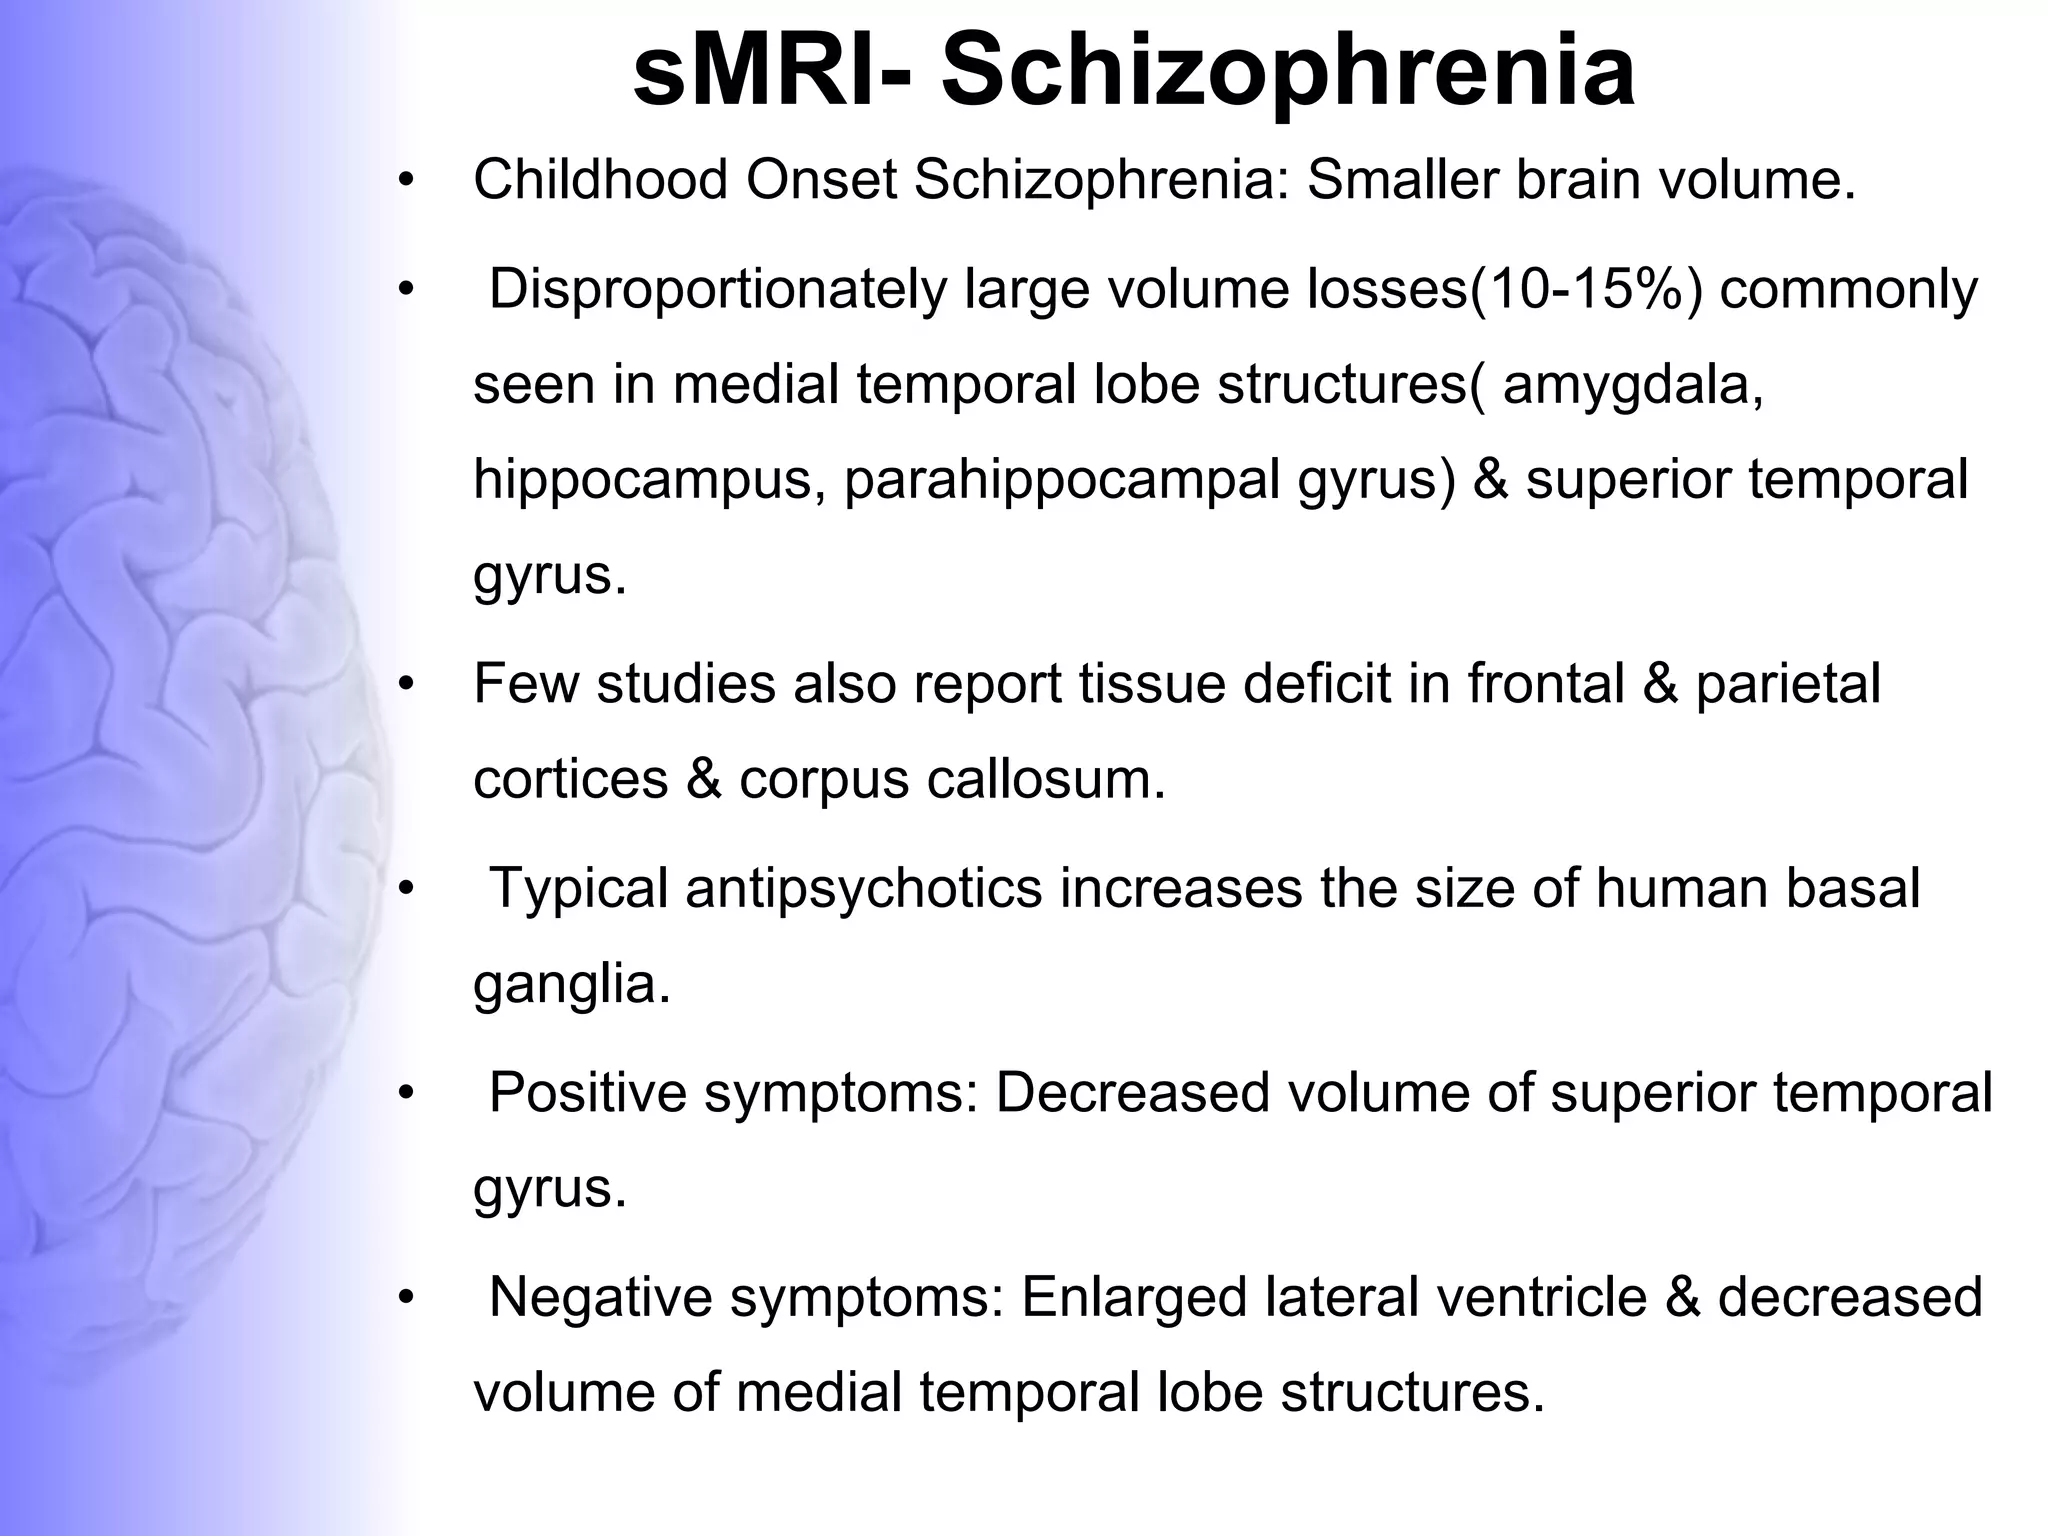
NEUROIMAGING IN PSYCHIATRY Moderator: Dr. J.N. Das Assistant Professor Assam Medical College & Hospital 10 th  September 2009 Presenter: Dr. Santanu Ghosh Post Graduate Student
Overview of Presentation Introduction Key questions for  psychiatric neuroimaging Milestones in Neuroimaging. Types of neuroimaging Basic principles Imaging in Different Psychiatric conditions Conclusion Bibliography
Introduction “ A genuine dialogue between biology and psychoanalysis is necessary if we want to achieve a coherent understanding of mind.” Eric Kandel,  Biology and the Future of Psychoanalysis,  1999 If we can look  at a patient’s brain, it might improve the diagnosis of psychiatric ailments. Functional MRI shows the location, and sometimes magnitude of increased neuronal activaties arising from specific tasks (e.g. visual, motor or cognitive).
Key questions for  psychiatric neuroimaging:  Phenomenology, nosology what is/are schizophrenia(s) as distinct from “normality” and manic-depressive and other psychoses? are there disease entities or dimensions of psychopathology? how does disorder relate to normal variability in the population? Etiology, pathogenesis what are the causes of psychiatric disorder? Therapeutics how do effective drug treatments work? how can we identify new treatments both clinically and industrially?
Milestones of Neuroimaging: 1946 MR phenomenon - Bloch & Purcell  1952 Nobel Prize - Bloch & Purcell  1950--1970  NMR developed as analytical tool  1963 First instance of SPECT using the Anger Camera - Kuhl and Edwards  1972 Computerized Tomography  (Godfrey Hounsfield, Allan McLeod Cormack, 1979- Nobel Prize-Medicine ) 1973 Backprojection MRI - Lauterbur  1983 Compton Camera for SPECT - Manbir Singh and David Doria  1985 DTI- Le Bihan D & Breton   E  1986  Gradient Echo Imaging ,NMR Microscope  1987 MR Angiography - Dumoulin  1991 Nobel Prize - Ernst  1992 Functional MRI (fMRI)  1994 Hyperpolarized  129 Xe Imaging  2003 Nobel Prize - Lauterbur & Mansfield
Computed Tomography(CT) Scan. Magnetic Resonance Imaging (MRI) Scans. Structural Magnetic Resonance Imaging(sMRI)  2.  Functional Magnetic Resonance Imaging(fMRI)  Magnetic Resonance Spectroscopy (MRS) Single Photon Emission Computed Tomography (SPECT)Scanning Positron Emission Tomography(PET) Scanning
Basics- CT It is as simple as passing X-rays through the patient and obtaining information with a detector on the other side.  The X-ray source and the detector are interconnected and rotated around the patient during scanning period. Digital computers then assemble the data that is obtained and integrated it to provide a cross sectional image (tomogram) that is displayed on a computer screen. The image can be photographed or stored for later retrieval and use as the case may be.
Basics- CT  contd… The main reason why X-rays is used in diagnosis is because all substances and tissues differ in their ability to absorb X-rays. Some substances are more permeable to X-rays while some others impermeable. Owing to this difference, different tissues seem different when the X-ray film is developed. Dense tissues such as the bones appear white on a CT film while the soft tissues such as the brain or kidney appear gray. The cavities   filled with air such as the lungs appear black.
Basics - MRI Put subject in big magnetic field  Transmit radio waves into subject  [about 3  3) Turn off radio wave transmitter
Basics - MRI 4) Receive radio waves re-transmitted by subject -  Manipulate retransmission with magnetic fields during this  readout  interval  5) Store measured radio wave data vs. time Now go back to 2) to get some more data 6) Process raw data to reconstruct images
Basics - MRI MRI primarily images the NMR signal from the hydrogen nuclei (abundant in fat & water) Protons (nuclei of hydrogen atoms) usually rotate randomly Head placed in magnetic field, protons line up Radio frequency pulse makes aligned protons wobble (precession) When pulse stops, protons relax and realign to original magnetic field MRI measures the electrical signal as protons return to original state
Basics - MRI Magnetic Field Strength is the measured intensity of magnetic field. Magnetic field strength is measured in Tesla(T) or Gauss(G) (1T = 10,000G) Earth’s magnetic field = 0.6 Gauss FDA approved clinical MRI scanner <= 3T 3T = 50,000 * earth magnetic field
Basics - MRI MRI-images of a slice through the human body Each slice has a thickness (Thk) Voxels - Volume elements (several volume elements that compose a slice)  Voxel - approx 3 mm 3 Pixels- Picture elements that constitute an MRI image
Basics - MRI T1 weighted imaging- Basis is the longitudinal relaxation (spin lattice relaxation) T1  image created typically by using short TE and TR times (TE –echo time ::TR – repetition time ) Fat (larger longitudinal and transverse magnetization) - Bright on a T1  Water (less longitudinal magnetization)-Dark on T1
Basics - MRI T2 weighted imaging- Basis is the transverse relaxation (spin spin relaxation) T2 created typically by using longer TE and TR times. Fat (larger longitudinal) - Dark on a T2  Water (less longitudinal magnetization)-White on T2
T1- weighted MR  T2- weighted MR  CT Scan
Basics - fMRI fMRI - indirect measure of neural activity measuring changes in local blood oxygenation. - blood oxygen level-dependent (BOLD)    Neural activity-    oxygen consumption  Causes a change of oxy- and deoxyhaemoglobin concentrations in local vasculature. Oxygenated blood (HbO 2 ) is magnetically transparent (diamagnetic), deoxygenated blood (Hb) is paramagnetic
Basics - fMRI After ~2 seconds a large increase in local blood flow follows, roughly proportional to an increase in glucose consumption. The blood flow increase overcompensates the oxygen consumption
Basics-MRS MRI - Signal from protons to form anatomic images  MRS - Signal from protons to determine the concentration of brain metabolites such as N-acetyl aspartate (NAA), choline (Cho), creatine (Cr) and lactate in the tissue examined
Basics-PET Nuclear medicine medical imaging technique which produces a three dimensional image or map of functional processes in the body Injection of short-lived radioactive tracer isotope, which decays by emitting a positron, which also has been chemically incorporated into a metabolically active molecule Waiting period while the metabolically active molecule becomes concentrated  Subject or patient is placed in the imaging scanner.
Basics-PET The molecule most commonly used for this purpose is fluorodeoxyglucose (FDG), a sugar, for which the waiting period is typically an hour Carbon-11 (~20 min), nitrogen-13 (~10 min), oxygen-15 (~2 min), and fluorine-18 (~110 min)  Radionuclides must be produced in a cyclotron - not too far away in delivery-time to the PET scanner.
Basics-PET Limitations to the widespread use of PET arise from the high costs of cyclotrons needed to produce the short-lived radionuclide Need for specially adapted on-site chemical synthesis apparatus to produce the radiopharmaceuticals.
Basics-SPECT Nuclear medicine tomographic imaging technique using gamma rays  Image obtained by a gamma camera image is a 2-D view of 3-D distribution of a radionuclide SPECT - Gamma camera to acquire multiple 2-D images (also called projections), from multiple angles.  A computer is then used to apply a tomographic reconstruction algorithm to the multiple projections, yielding a 3-D dataset
Basics-SPECT Gamma camera is rotated around the patient Projections acquired at defined points during the rotation, typically every 3-6 degrees Full 360 degree rotation is used to obtain an optimal reconstruction Each projection - 15 – 20 seconds Total scan time - 15-20 minutes  Gamma-emitting tracer used in functional brain imaging is 99mTc-HMPAO ( hexamethylpropylene amine oxime) Reconstructed images typically have resolutions of 64x64 or 128x128 pixels, with the pixel sizes ranging from 3-6 mm
Basics-SPECT Tc-HMPAO SPECT scanning competes with  FDG  PET scanning of the brain, which works to assess regional brain glucose metabolism SPECT is more widely available,  Radioisotope generation technology is longer-lasting and far less expensive in SPECT Gamma scanning equipment is less expensive as well
MRI technique that enables the measurement of the restricted diffusion of water in tissue  Principal application is in the imaging of white matter where the location, orientation, and anisotropy of the tracts can be measured  The architecture of the axons in parallel bundles, and their myelin sheaths, facilitate the diffusion of the water molecules preferentially along their main direction. Such preferentially oriented diffusion is called anisotropic diffusion.  Basics-DTI(Diffusion Tensor Imaging)
DTI
IMAGING IN OCD
sMRI in OCD Decreased total cerebral white matter volume &  significantly greater total cerebral cortical volume reported. Left orbital frontal cortical volume is  smaller in OCD patients. Corpus callosum: Abnormality in length. Pituitary volume: Abnormality in volume noted.
SPECT in OCD Reduced serotonergic input into the fronto-subcortical circuits in OCD  Reduced midbrain-pons serotonin transporter binding in OCD Hasselbalch SG et al (2007) Acta Psychiatr Scand. 115:388-94
SPECT in OCD Thalamus- Differences in  SERT  availability and  Y-BOCS ratings correlated Midbrain- Significant association  Higher occupancy of SERT by citalopram seems to be associated with better clinical response  Stengler-Wenzke K et al (2006) Neuropsychobiology. 53:40-5  Right basal ganglion hypoperfusion in obsessive compulsive disorder  Topçuoglu V et al (2005) Int J Neurosci.;115:1643-55
PET in OCD 5-HTT availability was significantly reduced in the thalamus and midbrain of OCD patients  Reimold M et al (2007) J Neural Transm. (in press)
Meta-Analysis of PET and SPECT in OCD Differences in radiotracer uptake consistently in the orbital gyrus and the head of the caudate nucleus Head of the caudate- PET studies found greater activity  SPECT study found decreased activity Whiteside SP et al (2004) Psychiatry Res. 132:69-79.
MRS in OCD OCD patients were divided into three groups  Responders to a SSRI Responders to SSRI with an Atypical antipsychotics. Non-responders to either SSRI or SSRI with an AAP MRS was used to measure NAA concentrations in the anterior cingulate, the left basal ganglia and the left prefrontal lobe of subjects Significantly lower NAA concentration in responders to SSRI with an AAP in anterior cingulate gyrus.  Sumitani S et al (2007) Psychiatry Res. 154:85-92
DTI Data OCD Drug-naïve OCD patients showed significant increases in fractional anisotropy (FA) in the  corpus callosum  the internal capsule white matter in the area superolateral to the right caudate  Yoo SY et al (2007) Acta Psychiatr Scand. 116:211-9 .
IMAGING IN DEPRESSION
fMRI in Depression Bilateral Anterior Cingulate Cortex & Rt. amygdala significantly smaller in MDD Tang Y et al (2007) Psychiatry Res. (in press) MDD - greater activation in frontal and anterior temporal areas during inhibitory task
SPECT in Depression Baseline CBF was lower in depressed patients -in frontal cortex and subcortical nuclei bilaterally Medication response - normalization of CBF deficit ECT - additional CBF decrease in the parietotemporal and cerebellar regions bilaterally  Kohn Y et al (2007) J Nucl Med.;48:1273-8 SERT availability in the midbrain area is reduced in depression  Joensuu M et al (2007) Psychiatry Res.154(2):125-31 mPFC abnormality seen most often when healthy subjects experience emotion.  .
PET in Depression  Contd.. BPD- reduced 5-HTT in MDD patient in the vicinity of the pontine raphe nuclei. Depression-severity correlated negatively with 5-HTT  in the thalamus in MDD-subjects.  Depressed phases of MDD and BD both - associated with elevated 5-HTT binding in the insula, thalamus and striatum, but showed distinct abnormalities in the brainstem  Cannon DM et al (2007) Biol Psychiatry (in press )
Imaging in Dementia
PURPOSES OF IMAGING IN DEMENTIA Diagnosis   the cause of dementia.  Monitoring disease  progression SERIAL BRAIN VOLUME MEASUREMENTS  – A SURROGATE MARKER OF DRUG EFFICACY IN THERAPEUTIC TRIALS IS A MAJOR NEW DEVELOPMENT IN STRUCTURAL MRI. Staging of disease  severity in Alzheimer’s disease. MR DEFINED  HIPPOCAMPAL VOLUME MEASUREMENT   REPRESENT A VALID IN VIVO SURROGATE  MARKER FOR THE PATHOLOGIC STATING OF AD .
This group mainly comprises of: Alzheimer’s disease. Dementia with lewy bodies.  Frontotemporal dementia. Dementia of vascular etiology Human prion diseases. Normal pressure hydrocephalus.
1. ALZHEIMERS DISEASE
Alzheimr’s Disease (AD) Is the  most common  cause of dementia. >  90% sporadic  , age usually >65yrs. <10% familial, age usually <60 yrs. Clinically: Initially  normal - develops  ‘Mild Cognitive Impairment’  – goes on to develop  AD .  Pathology: AD is characterized by senile plaques, neurofibrillary  tangles, decreased synaptic density, neuron loss and cerebral atrophy.
sMRI- Alzehimer’s Disease Assessment of cerebral atrophy of hemisphere particularly  posterior temporal and parietal lobes  & specific anatomic areas like  hippocampus  and  medial temporal lobe Visual ranking system:  Mild / moderate / severe.  2.  Quantitative measurement :  Linear / area / volumetric* . Measurements must be adjusted for age, gender and head size and then referenced to an appropriate control population.
Among these  measurements of hippocampus  was most sensitive marker of pathology of AD early in disease.  Normal ALZHEIMER’S DISEASE
ALZHEIMER’S DISEASE  NORMAL
2. DEMENTIA WITH LEWY BODIES
It is characterized by  presence of lewy bodies  in the cortical neurons on histology.  It is  2 nd  / 3 rd   most common  cause of dementia in elderly. To date,  no MRI features  have been identified that to characterize DLB.  “ THE ABSENCE OF SIGNIFICANT MEDIAL TEMPORAL LOBE ATROPHY”  in a elderly demented patient suggests DLB etiology rather than AD etiology.
3. FRONTOTEMPORAL DEMENTIA
Age of onset:  50-65 yrs . Genetically linked to  chromosome 3 and 17 FTD is a term used to describe a family of neurodegenerative disorders characterized by  degeneration of frontal and temporal lobes.  The  three  most common  HISTOLOGICALLY   classified (Not radiological)  FTD syndromes are Pick's disease.  Frontal-lobe degeneration & FTD with amyotrophic lateral sclerosis.
MRI features of FTD MR features :  Severe sharply localized atrophy- bilaterally symmetric-  “knife-blade atrophy.”  Hyperintense signal in the cortex and underlying white matter of the affected areas. Areas involved : frontal lobe, anterior temporal lobes, extra pyramidal nuclei especially the caudate nucleus, insular cortex & anterior corpus callosum. Areas spared : Posterior two thirds of the superior temporal gyrus, occipital lobes, parietal lobes & perirolandic region These  MR findings  in an  appropriate clinical setting  may support the diagnosis of FTD.
 
Frontotemporal dementia
4 .  DEMENTIA OF VASCULAR ETIOLOGY
Dementia due to chronic cerebrovascular disease  is  2 nd  / 3 rd   most common  cause of dementia in elderly(AD and dementia with Lewy bodies).  Three main forms are recognized: Multi infarct dementia.  Sub cortical vascular dementia/ Binswanger’s disease Cerebral amyloid angiopathy.
 
SPECT-Vascular Dementia 99mTc-HMPAO SPECT of the brain in vascular dementia shows multiple patchy perfusion defects.
5. NORMAL PRESSURE HYDROCEPHALUS
TRIAD :  Dementia + gait disturbance + Urinary incontinence. AGE :  usually after 60 yrs. Theories:  Impaired extraventricluar CSF absorption due to prior subarachnoid hemorrhage / meningitis.  Decrease white matter tensile strength due to deep white matter infarction / ischemic changes . Three primary MR findings have been described in NPH:  enlargement of the ventricular system  out of proportion to the subarachnoid space  a prominent  periventricular halo  and a prominent CSF  flow void  in the cerebral aqueduct.
 
MRS- Dementia NAA loss is consistently seen in Alzheimer's disease. NAA loss is also seen in Parkinson’s disease & Huntington’s disease. Significantly elevated myoinositol in grey matter of Alzheimer's disease.
MR Perfusion study in Alzheimer’s disease A characteristic bilateral temporoparietal decrease in blood flow is noted.
STRUCTURAL ANALYSIS Amygdala Hippocampus Rest of cortex PET:  Reduced uptake of  glucose in temporal  lobe.  SPECT/MR perfusion Reduced perfusion MR SPECTROSCOPY:  -Decrease in  NAA. -Increase in  myoinositol.   Alzheimer’s disease
IMAGING IN ANXIETY DISORDER
sMRI- Anxiety Disorder Smaller hippocampal volume was attributed to the neurotoxic  effects of elevated levels of cortisol & excitatory amino acid. Smaller left hippocampal volume reported in adult women with childhood sexual abuse & in women with PTSD secondary to  childhood sexual abuse. Panic Disorder: Smaller temporal lobe, hippocampus:WNL
IMAGING IN SCHIZOPHRENIA
Multi-system dysfunctions involving the Frontal Lobe, Temporal Lobe, Thalamus and Basal Ganglia Involvement of Prefrontal and Limbic cortices Circuitry Breakdown in Schizophrenia
Circuitry Breakdown in Schizophrenia Fronto Temporal dysfunction Reciprocal connection between Anteromedial Thalamus and Ventral PFC via the Uncinate Fasciculus Mid and Posterior superior temporal gurus projects to PFC via Arcuate Fasciculus
Circuitry Breakdown in Schizophrenia Fronto Cerebellar dysfunction Cognitive dysmetria  Cortico-Ponto-Cerebello-Thalamo-Cortical Loop
CT- Schizophrenia Enlarged ventricles is seen. The expanding fluid filled space is seen in sulci. These findings are non diagnostics of schizophrenia.
sMRI- Schizophrenia Childhood Onset Schizophrenia: Smaller brain volume. Disproportionately large volume losses(10-15%) commonly seen in medial temporal lobe structures( amygdala, hippocampus, parahippocampal gyrus) & superior temporal gyrus. Few studies also report tissue deficit in frontal & parietal cortices & corpus callosum. Typical antipsychotics increases the size of human basal ganglia. Positive symptoms: Decreased volume of superior temporal gyrus. Negative symptoms: Enlarged lateral ventricle & decreased volume of medial temporal lobe structures.
IMAGING IN ADHD
sMRI- ADHD Increased cortical grey & white matter volumes from 5 years of age with a peak at apprx. 12-15 yrs of age. Early onset ADHD is associated with smaller total brain volume- 4% cases. Decrease in the volume of the posterior inferior cerebellar vermis noted.
sMRI- Autism NONSPECIFIC Focal hypoplasia of the superior vermian lobules VI and VII (declive. Folium & tuber) has been reported.  In the cerebrum, volume loss of the parietal lobe cortex ,white matter, as well as the posterior corpus callosum has been reported  Another group reported that the midbrain and medulla were significantly smaller. The brainstem and cerebellar vermis (lobules VIII to X) were significantly smaller in  autistics  than in controls .
PET- Autism Increase in diffuse cortical metabolism noted.
Psychotropic Drugs & fMRI CBF & metabolism can be reduced by acute & chronic administration of BZD receptor agonist & antipsychotic drugs. fMRI studies conversely be designed to investigate  neuropsychological effects of psychotropic treatments. By imaging before & during treatment, the effects of psychotropic drugs on basal perfusion or hemodynamic responses to sensory & cognitive events can be characterized.
Conclusion For psychiatry, the advent of safe functional brain imaging is an historically unprecedented opportunity to define neural substrates of disorder - this process may entail a revolution in definition of disorder The conjunction of fMRI and genomics is a major research opportunity for understanding causation of disorders Emergence of psychiatric disorders needs to be characterised in context of normal, variable, neurodevelopmental processes - which can be directly visualised by fMRI Pharmacological fMRI has promise scientifically, clinically and commercially.
Bibliography CTP- Kaplan & Sadock, 8 th  ed Page 201-221.    Synopsis of Psychiatry, Kaplan & Sadock, 10 th  ed Page  110- 117.  Diagnostic MRI- osborn,1 st   ed. Internet: www.medscape.com www.emedicine.com www.wikipedia.com www.googleimage.com www.ips.com
 

Neuroimaging in psychiatry

  • 1.
    NEUROIMAGING IN PSYCHIATRYModerator: Dr. J.N. Das Assistant Professor Assam Medical College & Hospital 10 th September 2009 Presenter: Dr. Santanu Ghosh Post Graduate Student
  • 2.
    Overview of PresentationIntroduction Key questions for psychiatric neuroimaging Milestones in Neuroimaging. Types of neuroimaging Basic principles Imaging in Different Psychiatric conditions Conclusion Bibliography
  • 3.
    Introduction “ Agenuine dialogue between biology and psychoanalysis is necessary if we want to achieve a coherent understanding of mind.” Eric Kandel, Biology and the Future of Psychoanalysis, 1999 If we can look at a patient’s brain, it might improve the diagnosis of psychiatric ailments. Functional MRI shows the location, and sometimes magnitude of increased neuronal activaties arising from specific tasks (e.g. visual, motor or cognitive).
  • 4.
    Key questions for psychiatric neuroimaging: Phenomenology, nosology what is/are schizophrenia(s) as distinct from “normality” and manic-depressive and other psychoses? are there disease entities or dimensions of psychopathology? how does disorder relate to normal variability in the population? Etiology, pathogenesis what are the causes of psychiatric disorder? Therapeutics how do effective drug treatments work? how can we identify new treatments both clinically and industrially?
  • 5.
    Milestones of Neuroimaging:1946 MR phenomenon - Bloch & Purcell 1952 Nobel Prize - Bloch & Purcell 1950--1970 NMR developed as analytical tool 1963 First instance of SPECT using the Anger Camera - Kuhl and Edwards 1972 Computerized Tomography (Godfrey Hounsfield, Allan McLeod Cormack, 1979- Nobel Prize-Medicine ) 1973 Backprojection MRI - Lauterbur 1983 Compton Camera for SPECT - Manbir Singh and David Doria 1985 DTI- Le Bihan D & Breton E 1986 Gradient Echo Imaging ,NMR Microscope 1987 MR Angiography - Dumoulin 1991 Nobel Prize - Ernst 1992 Functional MRI (fMRI) 1994 Hyperpolarized 129 Xe Imaging 2003 Nobel Prize - Lauterbur & Mansfield
  • 6.
    Computed Tomography(CT) Scan.Magnetic Resonance Imaging (MRI) Scans. Structural Magnetic Resonance Imaging(sMRI) 2. Functional Magnetic Resonance Imaging(fMRI) Magnetic Resonance Spectroscopy (MRS) Single Photon Emission Computed Tomography (SPECT)Scanning Positron Emission Tomography(PET) Scanning
  • 7.
    Basics- CT Itis as simple as passing X-rays through the patient and obtaining information with a detector on the other side. The X-ray source and the detector are interconnected and rotated around the patient during scanning period. Digital computers then assemble the data that is obtained and integrated it to provide a cross sectional image (tomogram) that is displayed on a computer screen. The image can be photographed or stored for later retrieval and use as the case may be.
  • 8.
    Basics- CT contd… The main reason why X-rays is used in diagnosis is because all substances and tissues differ in their ability to absorb X-rays. Some substances are more permeable to X-rays while some others impermeable. Owing to this difference, different tissues seem different when the X-ray film is developed. Dense tissues such as the bones appear white on a CT film while the soft tissues such as the brain or kidney appear gray. The cavities filled with air such as the lungs appear black.
  • 9.
    Basics - MRIPut subject in big magnetic field Transmit radio waves into subject [about 3 3) Turn off radio wave transmitter
  • 10.
    Basics - MRI4) Receive radio waves re-transmitted by subject - Manipulate retransmission with magnetic fields during this readout interval 5) Store measured radio wave data vs. time Now go back to 2) to get some more data 6) Process raw data to reconstruct images
  • 11.
    Basics - MRIMRI primarily images the NMR signal from the hydrogen nuclei (abundant in fat & water) Protons (nuclei of hydrogen atoms) usually rotate randomly Head placed in magnetic field, protons line up Radio frequency pulse makes aligned protons wobble (precession) When pulse stops, protons relax and realign to original magnetic field MRI measures the electrical signal as protons return to original state
  • 12.
    Basics - MRIMagnetic Field Strength is the measured intensity of magnetic field. Magnetic field strength is measured in Tesla(T) or Gauss(G) (1T = 10,000G) Earth’s magnetic field = 0.6 Gauss FDA approved clinical MRI scanner <= 3T 3T = 50,000 * earth magnetic field
  • 13.
    Basics - MRIMRI-images of a slice through the human body Each slice has a thickness (Thk) Voxels - Volume elements (several volume elements that compose a slice) Voxel - approx 3 mm 3 Pixels- Picture elements that constitute an MRI image
  • 14.
    Basics - MRIT1 weighted imaging- Basis is the longitudinal relaxation (spin lattice relaxation) T1 image created typically by using short TE and TR times (TE –echo time ::TR – repetition time ) Fat (larger longitudinal and transverse magnetization) - Bright on a T1 Water (less longitudinal magnetization)-Dark on T1
  • 15.
    Basics - MRIT2 weighted imaging- Basis is the transverse relaxation (spin spin relaxation) T2 created typically by using longer TE and TR times. Fat (larger longitudinal) - Dark on a T2 Water (less longitudinal magnetization)-White on T2
  • 16.
    T1- weighted MR T2- weighted MR CT Scan
  • 17.
    Basics - fMRIfMRI - indirect measure of neural activity measuring changes in local blood oxygenation. - blood oxygen level-dependent (BOLD)  Neural activity-  oxygen consumption Causes a change of oxy- and deoxyhaemoglobin concentrations in local vasculature. Oxygenated blood (HbO 2 ) is magnetically transparent (diamagnetic), deoxygenated blood (Hb) is paramagnetic
  • 18.
    Basics - fMRIAfter ~2 seconds a large increase in local blood flow follows, roughly proportional to an increase in glucose consumption. The blood flow increase overcompensates the oxygen consumption
  • 19.
    Basics-MRS MRI -Signal from protons to form anatomic images MRS - Signal from protons to determine the concentration of brain metabolites such as N-acetyl aspartate (NAA), choline (Cho), creatine (Cr) and lactate in the tissue examined
  • 20.
    Basics-PET Nuclear medicinemedical imaging technique which produces a three dimensional image or map of functional processes in the body Injection of short-lived radioactive tracer isotope, which decays by emitting a positron, which also has been chemically incorporated into a metabolically active molecule Waiting period while the metabolically active molecule becomes concentrated Subject or patient is placed in the imaging scanner.
  • 21.
    Basics-PET The moleculemost commonly used for this purpose is fluorodeoxyglucose (FDG), a sugar, for which the waiting period is typically an hour Carbon-11 (~20 min), nitrogen-13 (~10 min), oxygen-15 (~2 min), and fluorine-18 (~110 min) Radionuclides must be produced in a cyclotron - not too far away in delivery-time to the PET scanner.
  • 22.
    Basics-PET Limitations tothe widespread use of PET arise from the high costs of cyclotrons needed to produce the short-lived radionuclide Need for specially adapted on-site chemical synthesis apparatus to produce the radiopharmaceuticals.
  • 23.
    Basics-SPECT Nuclear medicinetomographic imaging technique using gamma rays Image obtained by a gamma camera image is a 2-D view of 3-D distribution of a radionuclide SPECT - Gamma camera to acquire multiple 2-D images (also called projections), from multiple angles. A computer is then used to apply a tomographic reconstruction algorithm to the multiple projections, yielding a 3-D dataset
  • 24.
    Basics-SPECT Gamma camerais rotated around the patient Projections acquired at defined points during the rotation, typically every 3-6 degrees Full 360 degree rotation is used to obtain an optimal reconstruction Each projection - 15 – 20 seconds Total scan time - 15-20 minutes Gamma-emitting tracer used in functional brain imaging is 99mTc-HMPAO ( hexamethylpropylene amine oxime) Reconstructed images typically have resolutions of 64x64 or 128x128 pixels, with the pixel sizes ranging from 3-6 mm
  • 25.
    Basics-SPECT Tc-HMPAO SPECTscanning competes with FDG PET scanning of the brain, which works to assess regional brain glucose metabolism SPECT is more widely available, Radioisotope generation technology is longer-lasting and far less expensive in SPECT Gamma scanning equipment is less expensive as well
  • 26.
    MRI technique thatenables the measurement of the restricted diffusion of water in tissue Principal application is in the imaging of white matter where the location, orientation, and anisotropy of the tracts can be measured The architecture of the axons in parallel bundles, and their myelin sheaths, facilitate the diffusion of the water molecules preferentially along their main direction. Such preferentially oriented diffusion is called anisotropic diffusion. Basics-DTI(Diffusion Tensor Imaging)
  • 27.
  • 28.
  • 29.
    sMRI in OCDDecreased total cerebral white matter volume & significantly greater total cerebral cortical volume reported. Left orbital frontal cortical volume is smaller in OCD patients. Corpus callosum: Abnormality in length. Pituitary volume: Abnormality in volume noted.
  • 30.
    SPECT in OCDReduced serotonergic input into the fronto-subcortical circuits in OCD Reduced midbrain-pons serotonin transporter binding in OCD Hasselbalch SG et al (2007) Acta Psychiatr Scand. 115:388-94
  • 31.
    SPECT in OCDThalamus- Differences in SERT availability and Y-BOCS ratings correlated Midbrain- Significant association Higher occupancy of SERT by citalopram seems to be associated with better clinical response Stengler-Wenzke K et al (2006) Neuropsychobiology. 53:40-5 Right basal ganglion hypoperfusion in obsessive compulsive disorder Topçuoglu V et al (2005) Int J Neurosci.;115:1643-55
  • 32.
    PET in OCD5-HTT availability was significantly reduced in the thalamus and midbrain of OCD patients Reimold M et al (2007) J Neural Transm. (in press)
  • 33.
    Meta-Analysis of PETand SPECT in OCD Differences in radiotracer uptake consistently in the orbital gyrus and the head of the caudate nucleus Head of the caudate- PET studies found greater activity SPECT study found decreased activity Whiteside SP et al (2004) Psychiatry Res. 132:69-79.
  • 34.
    MRS in OCDOCD patients were divided into three groups Responders to a SSRI Responders to SSRI with an Atypical antipsychotics. Non-responders to either SSRI or SSRI with an AAP MRS was used to measure NAA concentrations in the anterior cingulate, the left basal ganglia and the left prefrontal lobe of subjects Significantly lower NAA concentration in responders to SSRI with an AAP in anterior cingulate gyrus. Sumitani S et al (2007) Psychiatry Res. 154:85-92
  • 35.
    DTI Data OCDDrug-naïve OCD patients showed significant increases in fractional anisotropy (FA) in the corpus callosum the internal capsule white matter in the area superolateral to the right caudate Yoo SY et al (2007) Acta Psychiatr Scand. 116:211-9 .
  • 36.
  • 37.
    fMRI in DepressionBilateral Anterior Cingulate Cortex & Rt. amygdala significantly smaller in MDD Tang Y et al (2007) Psychiatry Res. (in press) MDD - greater activation in frontal and anterior temporal areas during inhibitory task
  • 38.
    SPECT in DepressionBaseline CBF was lower in depressed patients -in frontal cortex and subcortical nuclei bilaterally Medication response - normalization of CBF deficit ECT - additional CBF decrease in the parietotemporal and cerebellar regions bilaterally Kohn Y et al (2007) J Nucl Med.;48:1273-8 SERT availability in the midbrain area is reduced in depression Joensuu M et al (2007) Psychiatry Res.154(2):125-31 mPFC abnormality seen most often when healthy subjects experience emotion. .
  • 39.
    PET in Depression Contd.. BPD- reduced 5-HTT in MDD patient in the vicinity of the pontine raphe nuclei. Depression-severity correlated negatively with 5-HTT in the thalamus in MDD-subjects. Depressed phases of MDD and BD both - associated with elevated 5-HTT binding in the insula, thalamus and striatum, but showed distinct abnormalities in the brainstem Cannon DM et al (2007) Biol Psychiatry (in press )
  • 40.
  • 41.
    PURPOSES OF IMAGINGIN DEMENTIA Diagnosis the cause of dementia. Monitoring disease progression SERIAL BRAIN VOLUME MEASUREMENTS – A SURROGATE MARKER OF DRUG EFFICACY IN THERAPEUTIC TRIALS IS A MAJOR NEW DEVELOPMENT IN STRUCTURAL MRI. Staging of disease severity in Alzheimer’s disease. MR DEFINED HIPPOCAMPAL VOLUME MEASUREMENT REPRESENT A VALID IN VIVO SURROGATE MARKER FOR THE PATHOLOGIC STATING OF AD .
  • 42.
    This group mainlycomprises of: Alzheimer’s disease. Dementia with lewy bodies. Frontotemporal dementia. Dementia of vascular etiology Human prion diseases. Normal pressure hydrocephalus.
  • 43.
  • 44.
    Alzheimr’s Disease (AD)Is the most common cause of dementia. > 90% sporadic , age usually >65yrs. <10% familial, age usually <60 yrs. Clinically: Initially normal - develops ‘Mild Cognitive Impairment’ – goes on to develop AD . Pathology: AD is characterized by senile plaques, neurofibrillary tangles, decreased synaptic density, neuron loss and cerebral atrophy.
  • 45.
    sMRI- Alzehimer’s DiseaseAssessment of cerebral atrophy of hemisphere particularly posterior temporal and parietal lobes & specific anatomic areas like hippocampus and medial temporal lobe Visual ranking system: Mild / moderate / severe. 2. Quantitative measurement : Linear / area / volumetric* . Measurements must be adjusted for age, gender and head size and then referenced to an appropriate control population.
  • 46.
    Among these measurements of hippocampus was most sensitive marker of pathology of AD early in disease. Normal ALZHEIMER’S DISEASE
  • 47.
  • 48.
    2. DEMENTIA WITHLEWY BODIES
  • 49.
    It is characterizedby presence of lewy bodies in the cortical neurons on histology. It is 2 nd / 3 rd most common cause of dementia in elderly. To date, no MRI features have been identified that to characterize DLB. “ THE ABSENCE OF SIGNIFICANT MEDIAL TEMPORAL LOBE ATROPHY” in a elderly demented patient suggests DLB etiology rather than AD etiology.
  • 50.
  • 51.
    Age of onset: 50-65 yrs . Genetically linked to chromosome 3 and 17 FTD is a term used to describe a family of neurodegenerative disorders characterized by degeneration of frontal and temporal lobes. The three most common HISTOLOGICALLY classified (Not radiological) FTD syndromes are Pick's disease. Frontal-lobe degeneration & FTD with amyotrophic lateral sclerosis.
  • 52.
    MRI features ofFTD MR features : Severe sharply localized atrophy- bilaterally symmetric- “knife-blade atrophy.” Hyperintense signal in the cortex and underlying white matter of the affected areas. Areas involved : frontal lobe, anterior temporal lobes, extra pyramidal nuclei especially the caudate nucleus, insular cortex & anterior corpus callosum. Areas spared : Posterior two thirds of the superior temporal gyrus, occipital lobes, parietal lobes & perirolandic region These MR findings in an appropriate clinical setting may support the diagnosis of FTD.
  • 53.
  • 54.
  • 55.
    4 . DEMENTIA OF VASCULAR ETIOLOGY
  • 56.
    Dementia due tochronic cerebrovascular disease is 2 nd / 3 rd most common cause of dementia in elderly(AD and dementia with Lewy bodies). Three main forms are recognized: Multi infarct dementia. Sub cortical vascular dementia/ Binswanger’s disease Cerebral amyloid angiopathy.
  • 57.
  • 58.
    SPECT-Vascular Dementia 99mTc-HMPAOSPECT of the brain in vascular dementia shows multiple patchy perfusion defects.
  • 59.
    5. NORMAL PRESSUREHYDROCEPHALUS
  • 60.
    TRIAD : Dementia + gait disturbance + Urinary incontinence. AGE : usually after 60 yrs. Theories: Impaired extraventricluar CSF absorption due to prior subarachnoid hemorrhage / meningitis. Decrease white matter tensile strength due to deep white matter infarction / ischemic changes . Three primary MR findings have been described in NPH: enlargement of the ventricular system out of proportion to the subarachnoid space a prominent periventricular halo and a prominent CSF flow void in the cerebral aqueduct.
  • 61.
  • 62.
    MRS- Dementia NAAloss is consistently seen in Alzheimer's disease. NAA loss is also seen in Parkinson’s disease & Huntington’s disease. Significantly elevated myoinositol in grey matter of Alzheimer's disease.
  • 63.
    MR Perfusion studyin Alzheimer’s disease A characteristic bilateral temporoparietal decrease in blood flow is noted.
  • 64.
    STRUCTURAL ANALYSIS AmygdalaHippocampus Rest of cortex PET: Reduced uptake of glucose in temporal lobe. SPECT/MR perfusion Reduced perfusion MR SPECTROSCOPY: -Decrease in NAA. -Increase in myoinositol. Alzheimer’s disease
  • 65.
  • 66.
    sMRI- Anxiety DisorderSmaller hippocampal volume was attributed to the neurotoxic effects of elevated levels of cortisol & excitatory amino acid. Smaller left hippocampal volume reported in adult women with childhood sexual abuse & in women with PTSD secondary to childhood sexual abuse. Panic Disorder: Smaller temporal lobe, hippocampus:WNL
  • 67.
  • 68.
    Multi-system dysfunctions involvingthe Frontal Lobe, Temporal Lobe, Thalamus and Basal Ganglia Involvement of Prefrontal and Limbic cortices Circuitry Breakdown in Schizophrenia
  • 69.
    Circuitry Breakdown inSchizophrenia Fronto Temporal dysfunction Reciprocal connection between Anteromedial Thalamus and Ventral PFC via the Uncinate Fasciculus Mid and Posterior superior temporal gurus projects to PFC via Arcuate Fasciculus
  • 70.
    Circuitry Breakdown inSchizophrenia Fronto Cerebellar dysfunction Cognitive dysmetria Cortico-Ponto-Cerebello-Thalamo-Cortical Loop
  • 71.
    CT- Schizophrenia Enlargedventricles is seen. The expanding fluid filled space is seen in sulci. These findings are non diagnostics of schizophrenia.
  • 72.
    sMRI- Schizophrenia ChildhoodOnset Schizophrenia: Smaller brain volume. Disproportionately large volume losses(10-15%) commonly seen in medial temporal lobe structures( amygdala, hippocampus, parahippocampal gyrus) & superior temporal gyrus. Few studies also report tissue deficit in frontal & parietal cortices & corpus callosum. Typical antipsychotics increases the size of human basal ganglia. Positive symptoms: Decreased volume of superior temporal gyrus. Negative symptoms: Enlarged lateral ventricle & decreased volume of medial temporal lobe structures.
  • 73.
  • 74.
    sMRI- ADHD Increasedcortical grey & white matter volumes from 5 years of age with a peak at apprx. 12-15 yrs of age. Early onset ADHD is associated with smaller total brain volume- 4% cases. Decrease in the volume of the posterior inferior cerebellar vermis noted.
  • 75.
    sMRI- Autism NONSPECIFICFocal hypoplasia of the superior vermian lobules VI and VII (declive. Folium & tuber) has been reported. In the cerebrum, volume loss of the parietal lobe cortex ,white matter, as well as the posterior corpus callosum has been reported Another group reported that the midbrain and medulla were significantly smaller. The brainstem and cerebellar vermis (lobules VIII to X) were significantly smaller in autistics than in controls .
  • 76.
    PET- Autism Increasein diffuse cortical metabolism noted.
  • 77.
    Psychotropic Drugs &fMRI CBF & metabolism can be reduced by acute & chronic administration of BZD receptor agonist & antipsychotic drugs. fMRI studies conversely be designed to investigate neuropsychological effects of psychotropic treatments. By imaging before & during treatment, the effects of psychotropic drugs on basal perfusion or hemodynamic responses to sensory & cognitive events can be characterized.
  • 78.
    Conclusion For psychiatry,the advent of safe functional brain imaging is an historically unprecedented opportunity to define neural substrates of disorder - this process may entail a revolution in definition of disorder The conjunction of fMRI and genomics is a major research opportunity for understanding causation of disorders Emergence of psychiatric disorders needs to be characterised in context of normal, variable, neurodevelopmental processes - which can be directly visualised by fMRI Pharmacological fMRI has promise scientifically, clinically and commercially.
  • 79.
    Bibliography CTP- Kaplan& Sadock, 8 th ed Page 201-221. Synopsis of Psychiatry, Kaplan & Sadock, 10 th ed Page 110- 117. Diagnostic MRI- osborn,1 st ed. Internet: www.medscape.com www.emedicine.com www.wikipedia.com www.googleimage.com www.ips.com
  • 80.