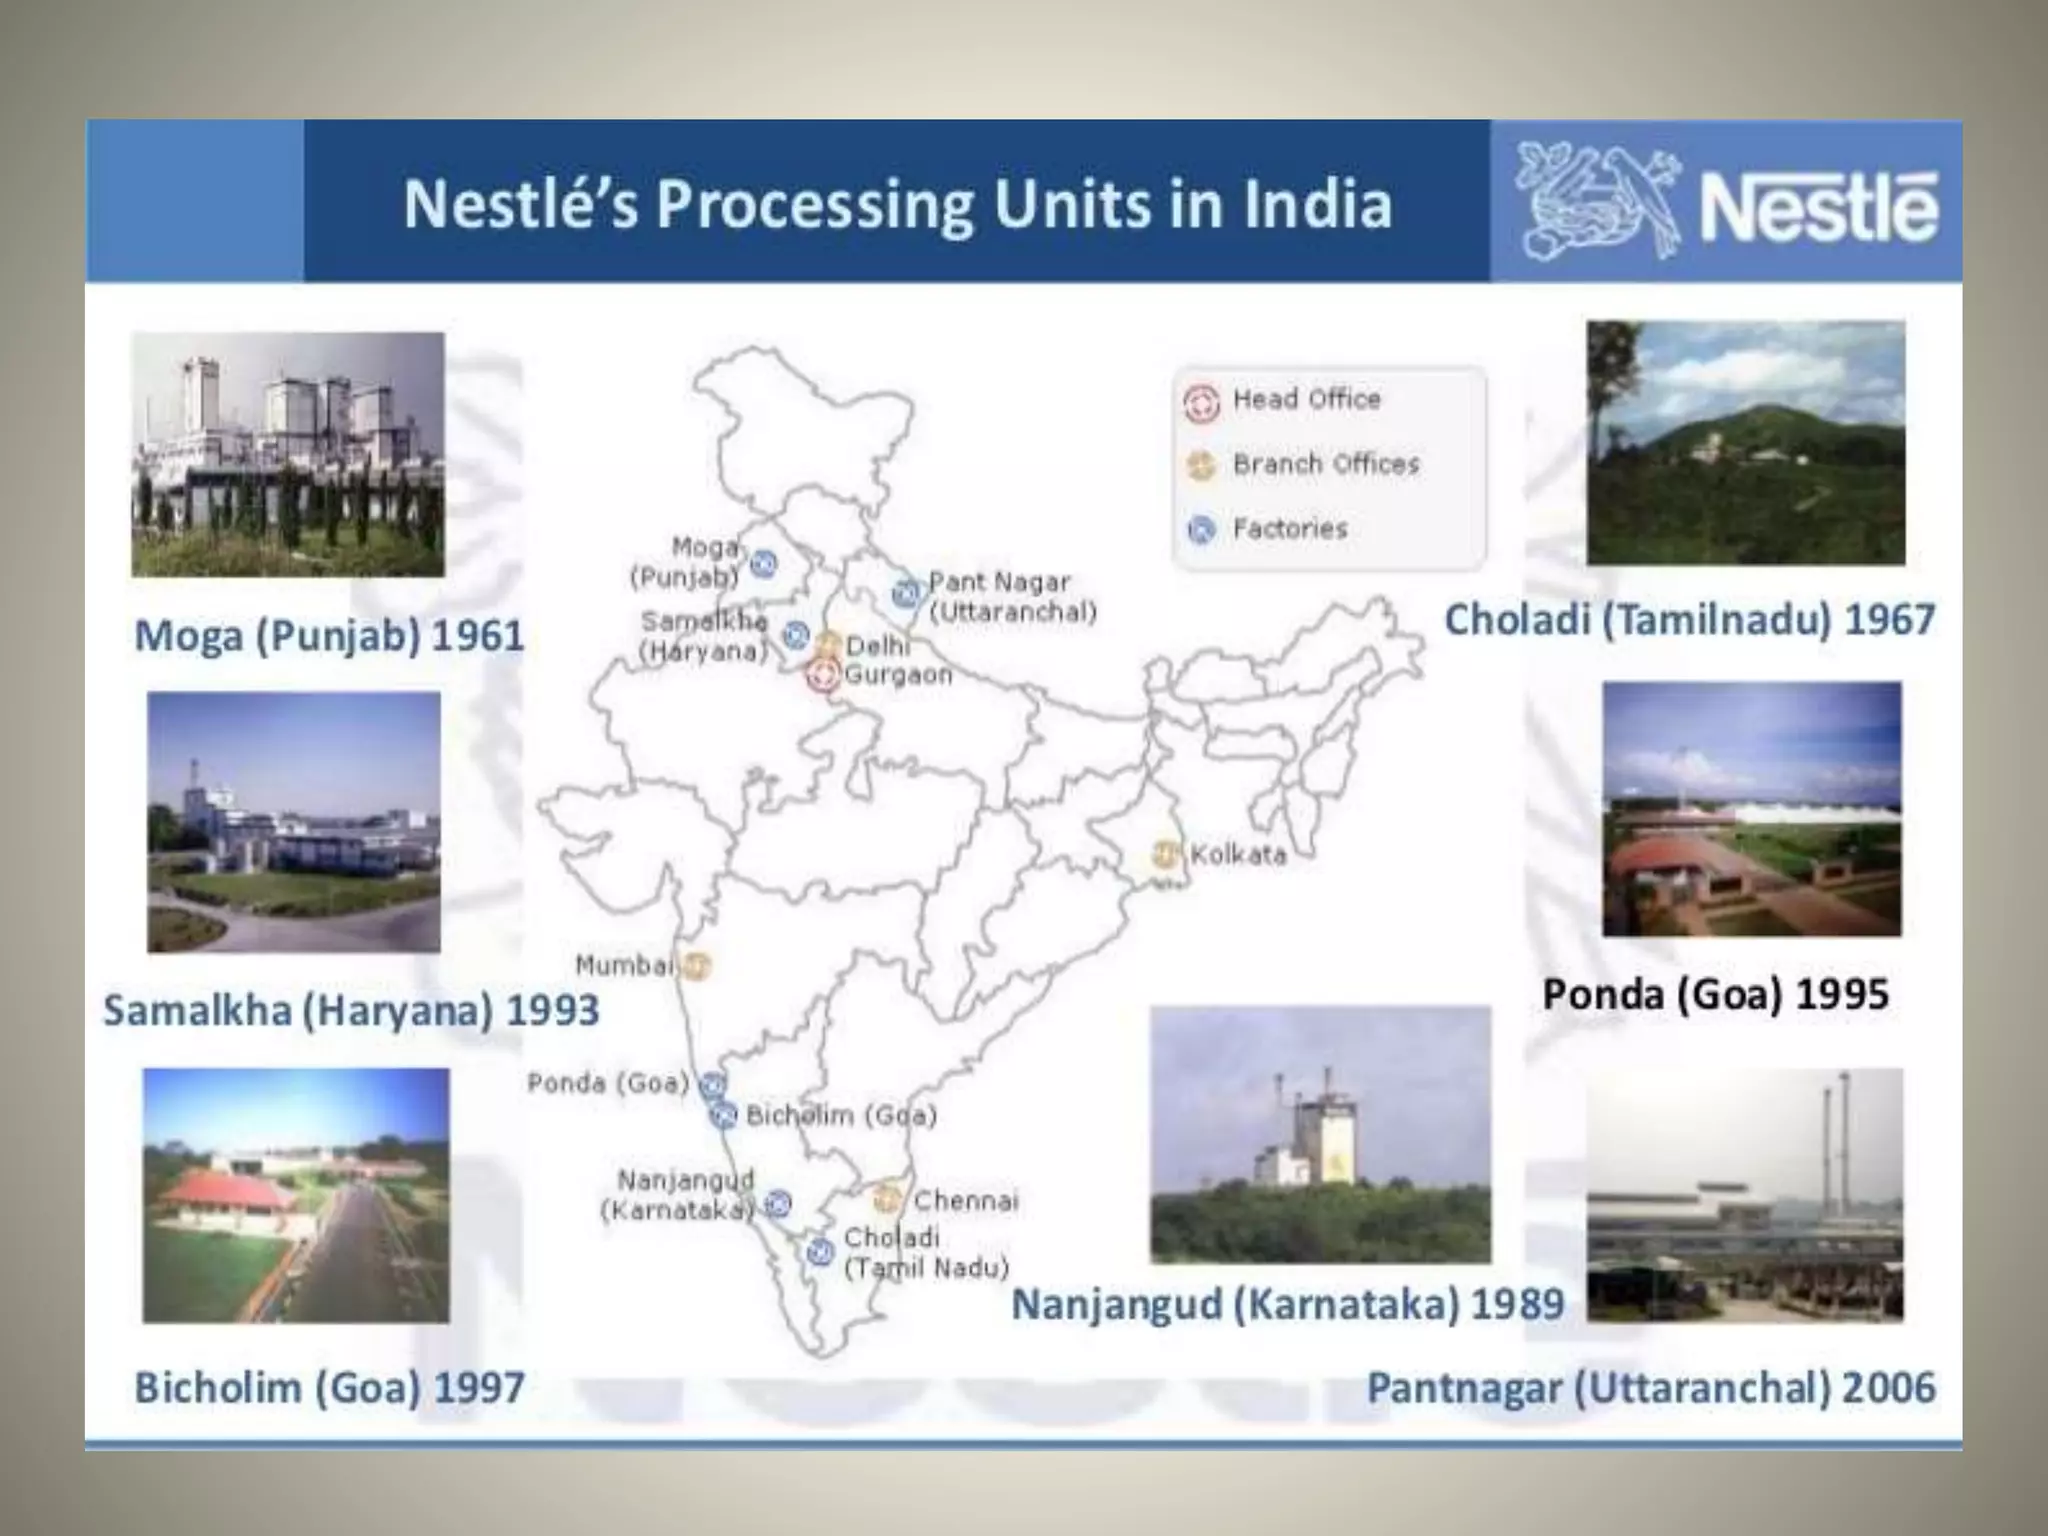
HENRY O NESTLE
• Founded in 1867
• Had an Objective in mind:
 To Be the Largest and Best
Brand Food Manufacturer
 Eight of the thirty selling
products should include
Nestle Logo
 Not only make well selling
products but be the best in
food market
Henry O Nestle
History
• Farine Lactee Nestle - 1st product
• Substitute for Mother's Milk
• Other products:
 Carbonated Mineral water
 Nuts Oil, Rum and Vinegar
 World’s First Instant Coffee in 1938
• In 1960 -- Switzerland’s Biggest company with 200
Factories
Entry in India
• In 1905,Nestle acquired the Anglo-Swiss Condensed
Milk Company.
• Nestlé's relationship with India started in 1912
• 1947-local production
• 1961- Moga, Punjab
Company Profile
• is a Swiss multinational
food and beverage
company headquartered
in Vevey.
• largest food company in
the world measured by
re
• grew significantly during
the First World War
venues.
• Nestlé has a primary
listing on the SIX Swizz
Exchange and is a
constituent of the Swiss
Market Index
• In 2011 - Nestlé was
listed No. 1 in the
Fortune Global 500
• In 2013 - Nestlé ranked
No. 9 in the FT Global
500
Nestlé's CEO
• Born-1954
• Nestle 20 September 2007
 OBJECTIVES
• Creating Shared Value
• Focusing on Nutrition
• Water, Rural Development
and More
• Meeting our Commitments
• Sharing your views Paul Bulcke
NESTLE BRANDS
Marketing Strategies
Beverages
 Nescafe Coffee
• First instant coffee(1938)
• NO demand
• Aim - Mass Marketing
• After 10years need for
innovation………
Marketing Strategies
Beverages
• Introduced in 1952
• Nondairy creamers
What r these??
• Substitute for milk
Marketing Strategies
Beverages (new innovations)
Nespresso (1976) The Nescafe(2006)
Marketing Strategies
Milkshakes and other beverages
• Company had
introduced Milo in 1996
as energy drink
• Competitors were
Bournvita and Boost
• Advertisement problem
………………..
• Thus a dead product in
India
Marketing Strategies
Chocolate
• Began as chocolate in
1948(U.S.A) as►
• Launched in 1950 in
Europe
• name was changed to
the worldwide brand
Nesquik in 1997
• In 1999-Nesquik Cereal
Marketing Strategies
Chocolates
Galak
KitKat
Marketing Strategies
Milk and Nutrition(Icecreams)
Marketing Strategies
Milk and Nutrition(Sweeteners)
• Milkmaid and Caramel
• Condensed milk
• For tea and coffee
• Sweets
• Change in cover
 Back cover-recipes
 Front cover-sweets
 Faltering demand
Marketing Strategies
Milk and Nutrition(Cereals)
• Aimed at
mothers and
children
• Animation
Marketing Strategies
“Taste Bhi Health Bhi”
• Prepared dishes
• NO demand
• Failed terribly
• Change-----
• FREE SAMPLES
 Masala
 Atta Noodles
Marketing Strategies
“Taste Bhi Health Bhi”
Marketing Strategies
“Taste Bhi Health Bhi”
Marketing Strategies
“Its different”
Marketing Strategies
Water
• Yet 64 brands such as Nestlé Pure Life, Poland Spring,
AcquaPanna, S.Pellegrino, Perrier, Vittel,
Buxton.
• Yet to cover Indian Markets due to other competitors.
Nestle mineral
waters formed by
1845 by Henri
Nestle.
Promotion Strategy
(Nestle Pure Life – NPL)
Promotion
important and crucial element
the company establishes its image in the mind
of the customers.
Slogan is Pure Life is
“fresh and rejuvenating taste”
“Embrace the pure life”.
PRISING STRATEGY
• Jan2011-Sept2011
Domestic market:
Sales rose 9.5% year-on-year while value rose 21.5%.
Exports market.
Sales declined 10.2% year-on-year, but it rose 8.9% in value
terms.
Conclusion
Nestle has been hiking prices sharply, a strategy that runs
the risk of hurting consumer demand and even becoming
uncompetitive.
Net Sales (in Crores)
0
1000
2000
3000
4000
5000
6000
7000
8000
9000
2008 2009 2010 2011 2012
Net Sales (in Crores)
5129.4
6254.7
7490.8
8302
4324.24
Net Sales (Increase in % )
23.4
21.9
19.8
10.8
0
5
10
15
20
25
2008 2009 2010 2011 2012
Net Sales (increase in % )
18.6
Net Sales (in Crores )
0
200
400
600
800
1000
1200
2008 2009 2010 2011 2012
Net Profit (in Crores)
655
818.7
961.8
1068
534.08
Net Profit (increase in %)
29.1
22.6
24.99
17.48
11.04
0
5
10
15
20
25
30
35
2008 2009 2010 2011 2012
Net Profit (increase in % )
Domestic Sales
0
1000
2000
3000
4000
5000
6000
7000
8000
9000
2008 2009 2010 2011 2012
Domestic Sales (in Crores )
Domestic Sales (in Crores )3985.85
4800.8
5901
7095
7877
Export Sales
338.39 328.6
353.54
0
380.42
0
50
100
150
200
250
300
350
400
2008 2009 2010 2011 2012
Export Sales (in Crores)
Contribution of Product Categories.
27%
26%18%
12%
11%
6%
2%
Sales (in %)
Drinks
Dairy & Food Products
Prepared dishes & Cooked
Dishes
Chocolates
Pet Products
Pharmaceuticals
Sales by Geographic Area.
0
5
10
15
20
25
30
35
Europe America US Asia Rest of
the world
Sales by Geographic Area (in %)
Sales by Geographic Area
(in %)
Share Price of Nestle India Ltd.
0
1000
2000
3000
4000
5000
6000
2008 2009 2010 2011 2012
Share Price as on 31st December
Share Price2445.67
3686.99
4103.60
4960.10
19 September 203-
19th September 2013.
-5
1362.72
Earning Per Shares
0
20
40
60
80
100
120
2008 2009 2010 2011 2012
EPS in %
EPS in %
55.39
67.94
84.91
99.73 110.76
Dividend Per shares
39
40
41
42
43
44
45
46
47
48
49
2008 2009 2010 2011 2012
DPS in %
DPS in %42.5
48.5 48.5 48.5 48.5
Interim Dividend
11.7
11.8
11.9
12
12.1
12.2
12.3
12.4
12.5
12.6
2008 2009 2010 2011 2012
Interim Dividend
Interim Dividend
12
12.5 12.5 12.5
Nestle India Income and Expenses
4361.56
5169.53
6296.67
7537.02
8357.58
3491.7
4126.52
5013.52
5952.86
6501.21
0
1000
2000
3000
4000
5000
6000
7000
8000
9000
2008 2009 2010 2011 2012
Income Expenses
Earning Before Tax and Profit After Tax Details
869.86
1043.02
1283.14
1584.16
1856.37
777.5
931.75
1155.39
1430.83
1579.22
775.86
930.35
1154.32
1421.77
1552.62
534.08
655
818.66
961.55
1067.93
0
200
400
600
800
1000
1200
1400
1600
1800
2000
2008 2009 2010 2011 2012
EBITDA EBIT EBT PAT
Secured Loan and Unsecured Loan(in Crores)
0
100
200
300
400
500
600
700
800
900
1000
1100
2008 2009 2010 2011 2012
Secured Loan
Unsecured loan
0.82 0.84 0.24
970.03
1049.95
Fixed Assets & Current Assets (in Crores)
0
1000
2000
3000
4000
5000
2008 2009 2010 2011 2012
Nestle India Assets
Fixed Assets Current Assets
1404.85
1640.79
1854.70
2552.21
4368.68
422.89
597.82 656.91
883.93 1064.61
Operating Profit Per shares
86.81
105.31
129.3
159.51
189.32
0
20
40
60
80
100
120
140
160
180
200
2008 2009 2010 2011 2012
Operting Profit Per Share
Current Ratio and Quick Ratio
0.66
0.6 0.62 0.6
0.54
0.28
0.23
0.26 0.24
0.21
0
0.1
0.2
0.3
0.4
0.5
0.6
0.7
2008 2009 2010 2011 2012
Current Ratio Quick Ratio
CR = CA
CL
QR = QA
QL
Ratio (in %)
Fixed Asset Turnover ratio
0
1
2
3
4
5
6
7
8
9
2008 2009 2010 2011 2012
3.2 3.24
8.71
4.83
3.27
Fixed Asset Turnover Ratio
Ratio (in %)
Owners Fund Ratio
99.82 100
100
56.75
63.13
0
20
40
60
80
100
120
2008 2009 2010 2011 2012
Owners fund as % of total source
Owners fund as % of total
source
Nestle India Investments
0
50
100
150
200
250
300
350
400
2008 2009 2010 2011 2012
Investments (in Crores)
34.90
203.26
150.68 134.37
364.86
Future Investment
•Nestle plans Rs 500-cr plant in Gujarat for Maggi
Noodles.
INVESTMENT IN MILK PLANT
• Antonio Helio Waszyk, Chairman & Managing
Director, Nestle India Ltd , said the company had
made investment of Rs 9,500 crore in the country,
according to an official statement.
• said the company had made investment of Rs 9,500
crore in the country, according to an official
statement.
INVESTMENT IN OTHER PRODUCTS
•RS 200cr in chocolates.
•RS 600cr in Green field
Facility programme.
•$50M in R&D unit in
Karnataka.
Final Conclusion
• Nestle India owns very strong brands.
• Earnings as much as 25-30 times increases
every year.
• Increase in P/E ratio.
• Example-For example if you bought Nestle in
2009 at Rs. 1,989 and sold in 2012 at Rs. 4,540
you earned a 32% compounded annual
growth rate on your investment in three years.

Nestle India LTD.

  • 2.
    HENRY O NESTLE •Founded in 1867 • Had an Objective in mind:  To Be the Largest and Best Brand Food Manufacturer  Eight of the thirty selling products should include Nestle Logo  Not only make well selling products but be the best in food market Henry O Nestle
  • 3.
    History • Farine LacteeNestle - 1st product • Substitute for Mother's Milk • Other products:  Carbonated Mineral water  Nuts Oil, Rum and Vinegar  World’s First Instant Coffee in 1938 • In 1960 -- Switzerland’s Biggest company with 200 Factories
  • 5.
    Entry in India •In 1905,Nestle acquired the Anglo-Swiss Condensed Milk Company. • Nestlé's relationship with India started in 1912 • 1947-local production • 1961- Moga, Punjab
  • 8.
    Company Profile • isa Swiss multinational food and beverage company headquartered in Vevey. • largest food company in the world measured by re • grew significantly during the First World War venues. • Nestlé has a primary listing on the SIX Swizz Exchange and is a constituent of the Swiss Market Index • In 2011 - Nestlé was listed No. 1 in the Fortune Global 500 • In 2013 - Nestlé ranked No. 9 in the FT Global 500
  • 9.
    Nestlé's CEO • Born-1954 •Nestle 20 September 2007  OBJECTIVES • Creating Shared Value • Focusing on Nutrition • Water, Rural Development and More • Meeting our Commitments • Sharing your views Paul Bulcke
  • 10.
  • 14.
    Marketing Strategies Beverages  NescafeCoffee • First instant coffee(1938) • NO demand • Aim - Mass Marketing • After 10years need for innovation………
  • 15.
    Marketing Strategies Beverages • Introducedin 1952 • Nondairy creamers What r these?? • Substitute for milk
  • 16.
    Marketing Strategies Beverages (newinnovations) Nespresso (1976) The Nescafe(2006)
  • 17.
    Marketing Strategies Milkshakes andother beverages • Company had introduced Milo in 1996 as energy drink • Competitors were Bournvita and Boost • Advertisement problem ……………….. • Thus a dead product in India
  • 18.
    Marketing Strategies Chocolate • Beganas chocolate in 1948(U.S.A) as► • Launched in 1950 in Europe • name was changed to the worldwide brand Nesquik in 1997 • In 1999-Nesquik Cereal
  • 19.
  • 20.
    Marketing Strategies Milk andNutrition(Icecreams)
  • 21.
    Marketing Strategies Milk andNutrition(Sweeteners) • Milkmaid and Caramel • Condensed milk • For tea and coffee • Sweets • Change in cover  Back cover-recipes  Front cover-sweets  Faltering demand
  • 22.
    Marketing Strategies Milk andNutrition(Cereals) • Aimed at mothers and children • Animation
  • 23.
    Marketing Strategies “Taste BhiHealth Bhi” • Prepared dishes • NO demand • Failed terribly • Change----- • FREE SAMPLES  Masala  Atta Noodles
  • 24.
  • 25.
  • 26.
  • 27.
    Marketing Strategies Water • Yet64 brands such as Nestlé Pure Life, Poland Spring, AcquaPanna, S.Pellegrino, Perrier, Vittel, Buxton. • Yet to cover Indian Markets due to other competitors. Nestle mineral waters formed by 1845 by Henri Nestle.
  • 28.
    Promotion Strategy (Nestle PureLife – NPL) Promotion important and crucial element the company establishes its image in the mind of the customers. Slogan is Pure Life is “fresh and rejuvenating taste” “Embrace the pure life”.
  • 29.
    PRISING STRATEGY • Jan2011-Sept2011 Domesticmarket: Sales rose 9.5% year-on-year while value rose 21.5%. Exports market. Sales declined 10.2% year-on-year, but it rose 8.9% in value terms. Conclusion Nestle has been hiking prices sharply, a strategy that runs the risk of hurting consumer demand and even becoming uncompetitive.
  • 30.
    Net Sales (inCrores) 0 1000 2000 3000 4000 5000 6000 7000 8000 9000 2008 2009 2010 2011 2012 Net Sales (in Crores) Net Sales (in Crores) 5129.4 6254.7 7490.8 8302 4324.24
  • 31.
    Net Sales (Increasein % ) 23.4 21.9 19.8 10.8 0 5 10 15 20 25 2008 2009 2010 2011 2012 Net Sales (increase in % ) Net Sales (increase in % ) 18.6
  • 32.
    Net Sales (inCrores ) 0 200 400 600 800 1000 1200 2008 2009 2010 2011 2012 Net Profit (in Crores) Net Profit (in Crores) 655 818.7 961.8 1068 534.08
  • 33.
    Net Profit (increasein %) 29.1 22.6 24.99 17.48 11.04 0 5 10 15 20 25 30 35 2008 2009 2010 2011 2012 Net Profit (increase in % )
  • 34.
    Domestic Sales 0 1000 2000 3000 4000 5000 6000 7000 8000 9000 2008 20092010 2011 2012 Domestic Sales (in Crores ) Domestic Sales (in Crores )3985.85 4800.8 5901 7095 7877
  • 35.
  • 36.
    Contribution of ProductCategories. 27% 26%18% 12% 11% 6% 2% Sales (in %) Drinks Dairy & Food Products Prepared dishes & Cooked Dishes Chocolates Pet Products Pharmaceuticals
  • 37.
    Sales by GeographicArea. 0 5 10 15 20 25 30 35 Europe America US Asia Rest of the world Sales by Geographic Area (in %) Sales by Geographic Area (in %)
  • 38.
    Share Price ofNestle India Ltd. 0 1000 2000 3000 4000 5000 6000 2008 2009 2010 2011 2012 Share Price as on 31st December Share Price2445.67 3686.99 4103.60 4960.10 19 September 203- 19th September 2013. -5 1362.72
  • 39.
    Earning Per Shares 0 20 40 60 80 100 120 20082009 2010 2011 2012 EPS in % EPS in % 55.39 67.94 84.91 99.73 110.76
  • 40.
    Dividend Per shares 39 40 41 42 43 44 45 46 47 48 49 20082009 2010 2011 2012 DPS in % DPS in %42.5 48.5 48.5 48.5 48.5
  • 41.
    Interim Dividend 11.7 11.8 11.9 12 12.1 12.2 12.3 12.4 12.5 12.6 2008 20092010 2011 2012 Interim Dividend Interim Dividend 12 12.5 12.5 12.5
  • 42.
    Nestle India Incomeand Expenses 4361.56 5169.53 6296.67 7537.02 8357.58 3491.7 4126.52 5013.52 5952.86 6501.21 0 1000 2000 3000 4000 5000 6000 7000 8000 9000 2008 2009 2010 2011 2012 Income Expenses
  • 43.
    Earning Before Taxand Profit After Tax Details 869.86 1043.02 1283.14 1584.16 1856.37 777.5 931.75 1155.39 1430.83 1579.22 775.86 930.35 1154.32 1421.77 1552.62 534.08 655 818.66 961.55 1067.93 0 200 400 600 800 1000 1200 1400 1600 1800 2000 2008 2009 2010 2011 2012 EBITDA EBIT EBT PAT
  • 44.
    Secured Loan andUnsecured Loan(in Crores) 0 100 200 300 400 500 600 700 800 900 1000 1100 2008 2009 2010 2011 2012 Secured Loan Unsecured loan 0.82 0.84 0.24 970.03 1049.95
  • 45.
    Fixed Assets &Current Assets (in Crores) 0 1000 2000 3000 4000 5000 2008 2009 2010 2011 2012 Nestle India Assets Fixed Assets Current Assets 1404.85 1640.79 1854.70 2552.21 4368.68 422.89 597.82 656.91 883.93 1064.61
  • 46.
    Operating Profit Pershares 86.81 105.31 129.3 159.51 189.32 0 20 40 60 80 100 120 140 160 180 200 2008 2009 2010 2011 2012 Operting Profit Per Share Operting Profit Per Share
  • 47.
    Current Ratio andQuick Ratio 0.66 0.6 0.62 0.6 0.54 0.28 0.23 0.26 0.24 0.21 0 0.1 0.2 0.3 0.4 0.5 0.6 0.7 2008 2009 2010 2011 2012 Current Ratio Quick Ratio CR = CA CL QR = QA QL Ratio (in %)
  • 48.
    Fixed Asset Turnoverratio 0 1 2 3 4 5 6 7 8 9 2008 2009 2010 2011 2012 3.2 3.24 8.71 4.83 3.27 Fixed Asset Turnover Ratio Ratio (in %)
  • 49.
    Owners Fund Ratio 99.82100 100 56.75 63.13 0 20 40 60 80 100 120 2008 2009 2010 2011 2012 Owners fund as % of total source Owners fund as % of total source
  • 50.
    Nestle India Investments 0 50 100 150 200 250 300 350 400 20082009 2010 2011 2012 Investments (in Crores) Investments (in Crores) 34.90 203.26 150.68 134.37 364.86
  • 51.
    Future Investment •Nestle plansRs 500-cr plant in Gujarat for Maggi Noodles.
  • 52.
    INVESTMENT IN MILKPLANT • Antonio Helio Waszyk, Chairman & Managing Director, Nestle India Ltd , said the company had made investment of Rs 9,500 crore in the country, according to an official statement. • said the company had made investment of Rs 9,500 crore in the country, according to an official statement.
  • 53.
    INVESTMENT IN OTHERPRODUCTS •RS 200cr in chocolates. •RS 600cr in Green field Facility programme. •$50M in R&D unit in Karnataka.
  • 54.
    Final Conclusion • NestleIndia owns very strong brands. • Earnings as much as 25-30 times increases every year. • Increase in P/E ratio. • Example-For example if you bought Nestle in 2009 at Rs. 1,989 and sold in 2012 at Rs. 4,540 you earned a 32% compounded annual growth rate on your investment in three years.