Download as PDF, PPTX
![Information Visualisation is the use of interactive
visual representations to amplify cognition [Card. et. al]
Monday 30 September 13](https://image.slidesharecdn.com/27092013mumeinfovisintrojoris-130930021650-phpapp02/85/Multimedia-les-intro-tot-informatie-visualisatie-4-320.jpg)

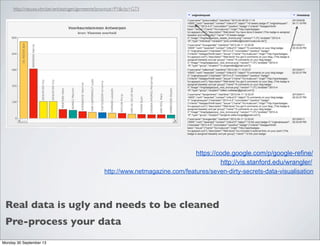
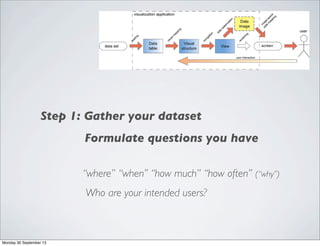
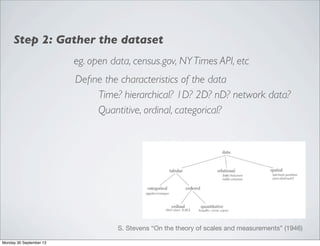
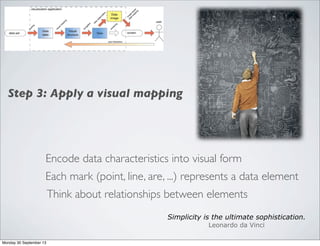
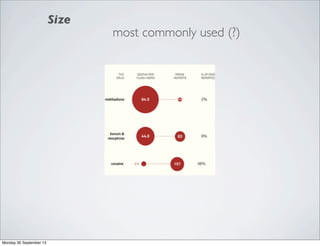
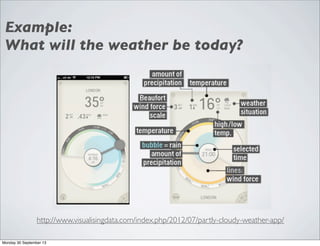
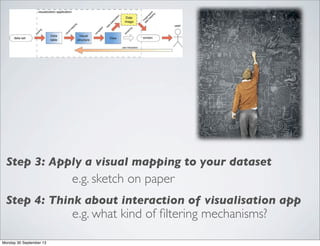
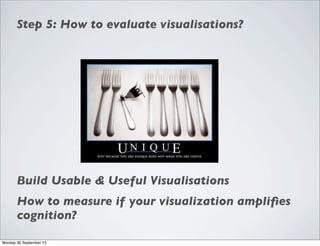
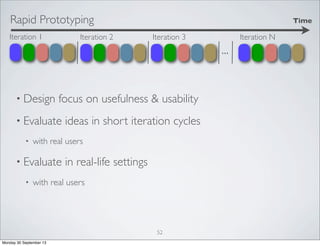
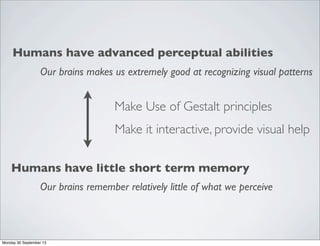


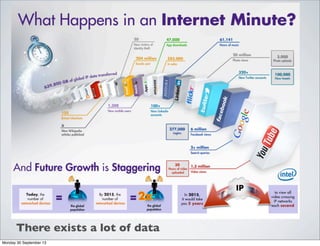
Information visualization uses interactive visual representations to help make sense of large amounts of data. It can help discover patterns, communicate information more effectively, and facilitate exploration and understanding. The visualization process involves gathering and cleaning data, applying visual encodings like size, color and position, and designing for interactivity and usability testing. Key principles include using common sense, avoiding misleading visuals, and leveraging human perceptual strengths through techniques like Gestalt grouping laws.