Download to read offline


![data & content design
LESSON 7
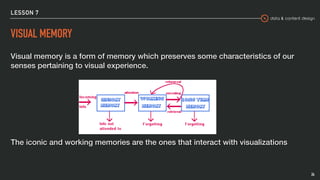
VISUAL SYSTEM
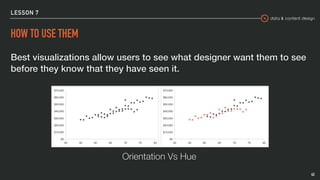
The visual system has its own rules. We can easily see patterns
presented in certain ways, but if they are presented in other ways,
they become invisible. [..]
If we can understand how perception works, our knowledge can be
translated into rules for displaying information. Following perception-
based rules, we can present our data in such a way that the important
and informative patterns stand out. If we disobey these rules, our data
will be incomprehensible or misleading.
▸ https://books.google.it/books/about/Information_Visualization.html?id=qFmS95vf6H8C&redir_esc=y
37](https://image.slidesharecdn.com/07-2019-ita-200504141451/85/How-we-perceive-information-v-2020-ITA-37-320.jpg)
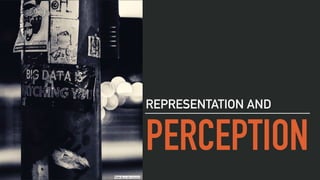

The document discusses visual perception and how information is processed. It covers topics like cognition, cognitive science, learning styles, sensation and perception, visual memory, gestalt principles, and limits of short-term memory. Examples are provided to illustrate concepts like preattentive attributes, chunking, and how visualization can take advantage of human perception to effectively communicate data and patterns.