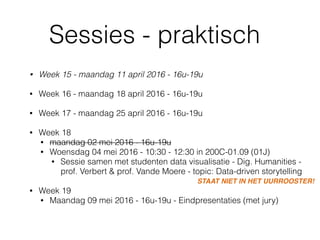
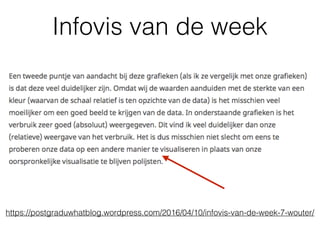
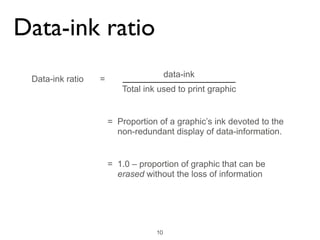
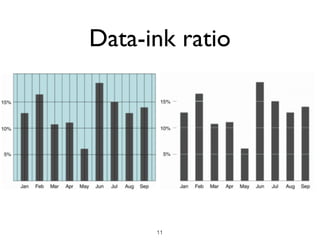
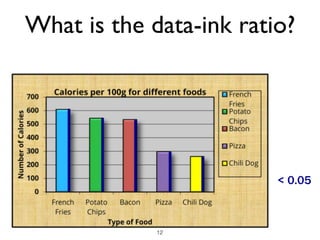
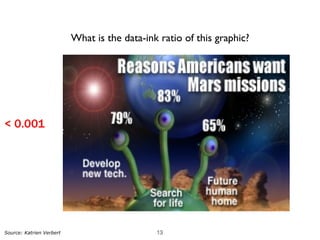
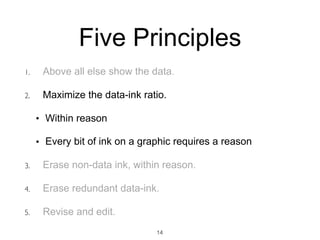
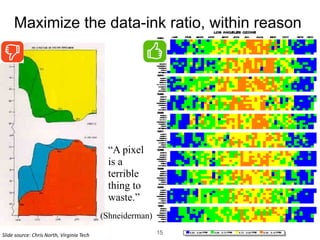
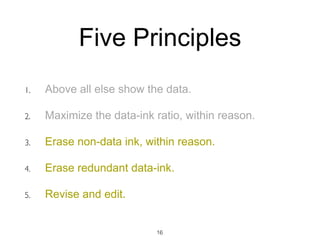
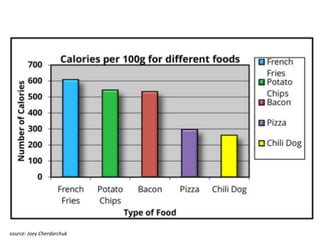
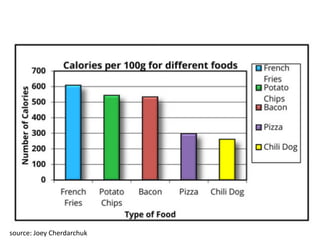
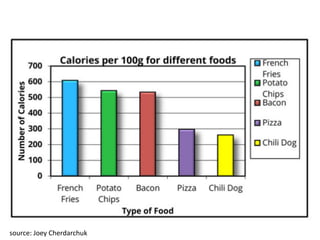
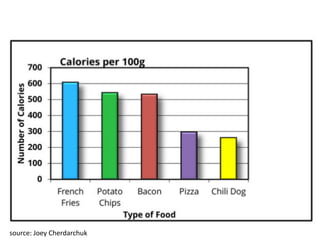
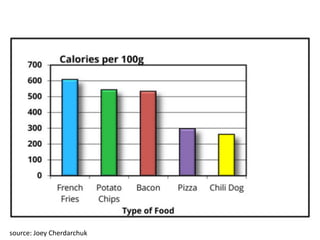
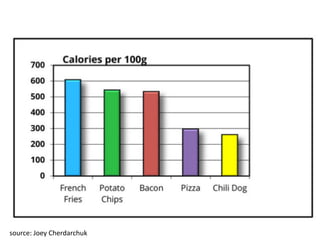
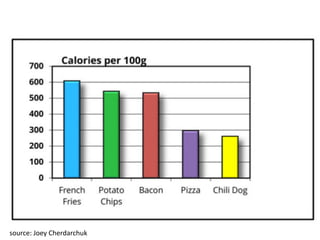
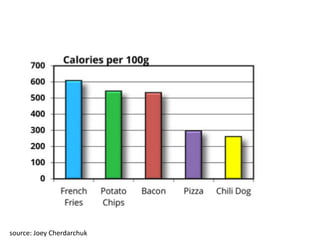
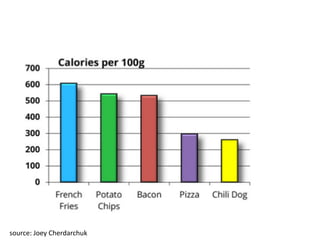
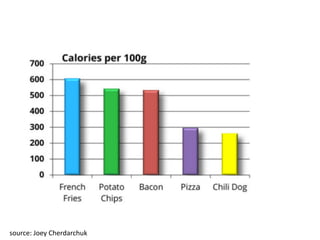
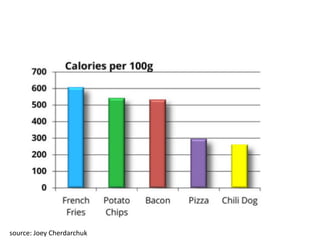
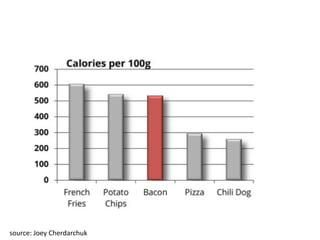
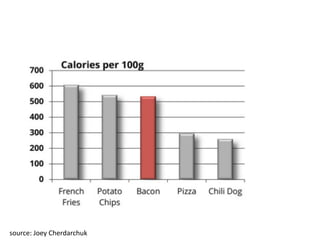
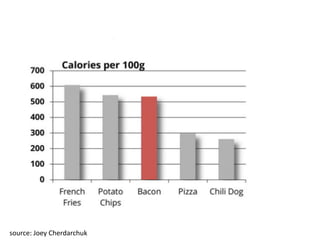
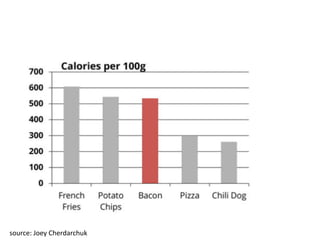
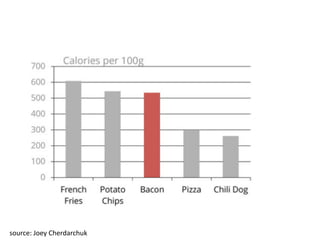
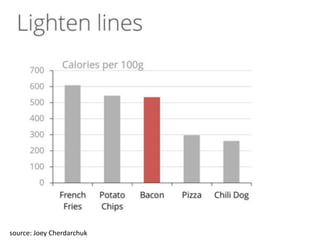
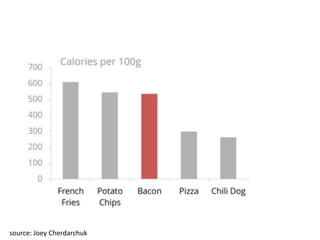
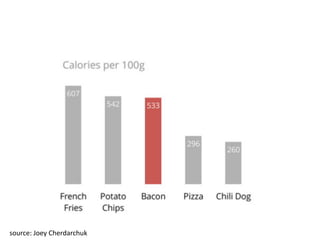
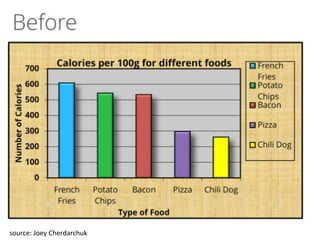
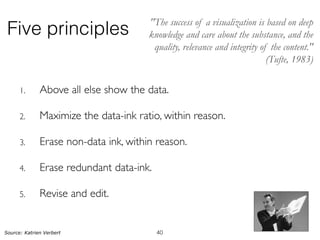
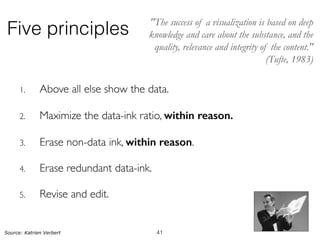
This document contains the schedule and content for an information visualization course. It discusses the following:
- The schedule for practical sessions over several weeks in April and May 2016.
- A summary of the "Data-Ink Design Principles" presented by the instructor, including maximizing the data-ink ratio and erasing non-data ink.
- Student groups presenting their work and receiving feedback on their visualizations from the instructor and other students.
- The assignment for next class, which involves continuing work on an individual spreadsheet and team implementation, as well as preparing a blog post and draft paper.
What tools do I use every day and how should we integrate technology skills into the classroom and content? Answers here in the Slide-Share presentation.
Learn how to "Tackle Classroom Challenges" and engage your students.
Presentation from "Evaluating online engagement: Practical and critical" at the 2013 Science Communication Conference organised by the British Science Association - slides by Shane McCracken and Rosie Schultz
My talk regarding measuring reader engagement through the use of physiological sensors at the one hand, and visualizing this information at the LICT workshop on "Information Processing in Social Media"
Visualisation - techniques, interaction dynamics, big dataJoris Klerkx
Module 3 - cursus Big Data - Visualisation - deel 2
Instituut voor Permanente Vorming
Various visualisation techniques
(adapted from Heer, J., Bostock, M., & Ogievetsjy, V. (2010, May). A Tour through the Visualization Zoo - A survey of powerful visualisation techniques, from the obvious to the obscure. ACM Graphics , 8 (5), https://queue.acm.org/detail.cfm?id=1805128 )
Various interaction techniques
(adapted from Heer, J., & Shneiderman, B. (2012, February). Interactive Dynamics for Visual Analysis. Magazine Queue - Microprocessors , 10 (2), p. 30. http://queue.acm.org/detail.cfm?id=2146416 )
Big data to big to visualize?
Introduction to the course at the KU Leuven on fundamentals of human computer interaction - http://onderwijsaanbod.kuleuven.be/syllabi/n/G0Q55AN.htm#activetab=doelstellingen_idp1326000
Bring your own idea - Visual learning analyticsJoris Klerkx
Workshop on visual learning analytics that was part of LASI 2014 - http://www.solaresearch.org/events/lasi-2/lasi2014/
Examples of learning dashboards were presented during the workshop by Sven Charleer:
http://www.slideshare.net/svencharleer/learning-dashboard-visual-learning-analytics-workshop-lasi2014-h-harvard
Acetabularia Information For Class 9 .docxvaibhavrinwa19
Acetabularia acetabulum is a single-celled green alga that in its vegetative state is morphologically differentiated into a basal rhizoid and an axially elongated stalk, which bears whorls of branching hairs. The single diploid nucleus resides in the rhizoid.
Biological screening of herbal drugs: Introduction and Need for
Phyto-Pharmacological Screening, New Strategies for evaluating
Natural Products, In vitro evaluation techniques for Antioxidants, Antimicrobial and Anticancer drugs. In vivo evaluation techniques
for Anti-inflammatory, Antiulcer, Anticancer, Wound healing, Antidiabetic, Hepatoprotective, Cardio protective, Diuretics and
Antifertility, Toxicity studies as per OECD guidelines
2024.06.01 Introducing a competency framework for languag learning materials ...Sandy Millin
http://sandymillin.wordpress.com/iateflwebinar2024
Published classroom materials form the basis of syllabuses, drive teacher professional development, and have a potentially huge influence on learners, teachers and education systems. All teachers also create their own materials, whether a few sentences on a blackboard, a highly-structured fully-realised online course, or anything in between. Despite this, the knowledge and skills needed to create effective language learning materials are rarely part of teacher training, and are mostly learnt by trial and error.
Knowledge and skills frameworks, generally called competency frameworks, for ELT teachers, trainers and managers have existed for a few years now. However, until I created one for my MA dissertation, there wasn’t one drawing together what we need to know and do to be able to effectively produce language learning materials.
This webinar will introduce you to my framework, highlighting the key competencies I identified from my research. It will also show how anybody involved in language teaching (any language, not just English!), teacher training, managing schools or developing language learning materials can benefit from using the framework.
Synthetic Fiber Construction in lab .pptxPavel ( NSTU)
Synthetic fiber production is a fascinating and complex field that blends chemistry, engineering, and environmental science. By understanding these aspects, students can gain a comprehensive view of synthetic fiber production, its impact on society and the environment, and the potential for future innovations. Synthetic fibers play a crucial role in modern society, impacting various aspects of daily life, industry, and the environment. ynthetic fibers are integral to modern life, offering a range of benefits from cost-effectiveness and versatility to innovative applications and performance characteristics. While they pose environmental challenges, ongoing research and development aim to create more sustainable and eco-friendly alternatives. Understanding the importance of synthetic fibers helps in appreciating their role in the economy, industry, and daily life, while also emphasizing the need for sustainable practices and innovation.
Introduction to AI for Nonprofits with Tapp NetworkTechSoup
Dive into the world of AI! Experts Jon Hill and Tareq Monaur will guide you through AI's role in enhancing nonprofit websites and basic marketing strategies, making it easy to understand and apply.
Normal Labour/ Stages of Labour/ Mechanism of LabourWasim Ak
Normal labor is also termed spontaneous labor, defined as the natural physiological process through which the fetus, placenta, and membranes are expelled from the uterus through the birth canal at term (37 to 42 weeks
Operation “Blue Star” is the only event in the history of Independent India where the state went into war with its own people. Even after about 40 years it is not clear if it was culmination of states anger over people of the region, a political game of power or start of dictatorial chapter in the democratic setup.
The people of Punjab felt alienated from main stream due to denial of their just demands during a long democratic struggle since independence. As it happen all over the word, it led to militant struggle with great loss of lives of military, police and civilian personnel. Killing of Indira Gandhi and massacre of innocent Sikhs in Delhi and other India cities was also associated with this movement.
Read| The latest issue of The Challenger is here! We are thrilled to announce that our school paper has qualified for the NATIONAL SCHOOLS PRESS CONFERENCE (NSPC) 2024. Thank you for your unwavering support and trust. Dive into the stories that made us stand out!
Model Attribute Check Company Auto PropertyCeline George
In Odoo, the multi-company feature allows you to manage multiple companies within a single Odoo database instance. Each company can have its own configurations while still sharing common resources such as products, customers, and suppliers.
6. Vandaag
• (Data-ink) Design Principles (ik)
• Show-and-Tell (jullie)
• 5 mins + 5 mins ‘design-critique’
• Quick feedback per groep
• Opdracht tegen volgende keer (ik)
6
8. Five principles
1. Above all else show the data.
2. Maximize the data-ink ratio, within reason.
3. Erase non-data ink, within reason.
4. Erase redundant data-ink.
5. Revise and edit.
Source: Katrien Verbert
"The success of a visualization is based on deep
knowledge and care about the substance, and the
quality, relevance and integrity of the content."
(Tufte, 1983)
8
9. Data-ink
A large share of ink on a graphic should present data
Information, the ink changing as the data change.
Data-ink is the non-erasable core of a graphic...
(Tufte, 1983)
9
10. Data-ink ratio =
data-ink
Total ink used to print graphic
= Proportion of a graphic’s ink devoted to the
non-redundant display of data-information.
= 1.0 – proportion of graphic that can be
erased without the loss of information
Data-ink ratio
10
13. What is the data-ink ratio of this graphic?
< 0.001
Source: Katrien Verbert 13
14. Five Principles
1. Above all else show the data.
2. Maximize the data-ink ratio.
• Within reason
• Every bit of ink on a graphic requires a reason
3. Erase non-data ink, within reason.
4. Erase redundant data-ink.
5. Revise and edit.
14
15. Maximize the data-ink ratio, within reason
“A pixel
is a
terrible
thing to
waste.”
(Shneiderman)
Slide source: Chris North, Virginia Tech 15
16. Five Principles
1. Above all else show the data.
2. Maximize the data-ink ratio, within reason.
3. Erase non-data ink, within reason.
4. Erase redundant data-ink.
5. Revise and edit.
16
39. “Perfection is achieved not
when there is nothing more
to add, but when there is
nothing left to take away”
– Antoine de Saint-Exupery
39
40. Five principles
1. Above all else show the data.
2. Maximize the data-ink ratio, within reason.
3. Erase non-data ink, within reason.
4. Erase redundant data-ink.
5. Revise and edit.
Source: Katrien Verbert
"The success of a visualization is based on deep
knowledge and care about the substance, and the
quality, relevance and integrity of the content."
(Tufte, 1983)
40
41. Five principles
1. Above all else show the data.
2. Maximize the data-ink ratio, within reason.
3. Erase non-data ink, within reason.
4. Erase redundant data-ink.
5. Revise and edit.
Source: Katrien Verbert
"The success of a visualization is based on deep
knowledge and care about the substance, and the
quality, relevance and integrity of the content."
(Tufte, 1983)
41
42. “A visualization should first-of-all inform, but
if the visualization fails to reach the target
audience, it never reaches the point that it
can inform”
Informative + Attractive ?
45. Vandaag
• (Data-ink) Design Principles (ik)
• Show-and-Tell (jullie)
• 5 mins + 5 mins ‘design-critique’
• Quick feedback per groep
• Opdracht tegen volgende keer (ik)
45
46. Tegen volgende les
• Individueel: - Spreadsheet
• Team:
• Vervolg implementatie
• Draft Paper!
• Blog post
• Vooruitgang - wat geleerd vandaag
• Wat vond je van feedback sessie?
• Show-and-Tell - design critique
(eventueel weerleggen wat je gehoord hebt vandaag)
46