Downloaded 30 times


![A definition...
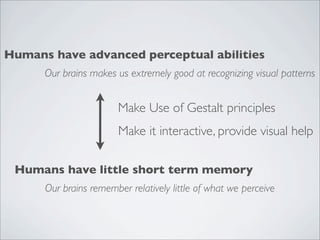
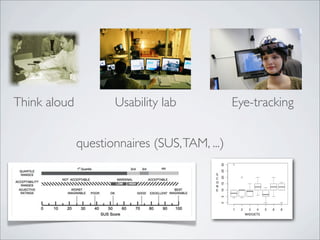
Information Visualisation is the use of interactive
visual representations to amplify cognition [Card. et. al]](https://image.slidesharecdn.com/workshopvisualizationjtelss-120525025352-phpapp01/85/Workshop-on-visualization-in-tel-34-320.jpg)
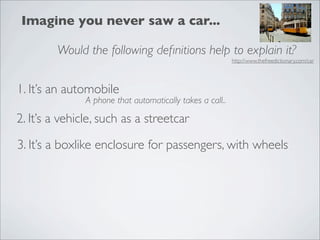
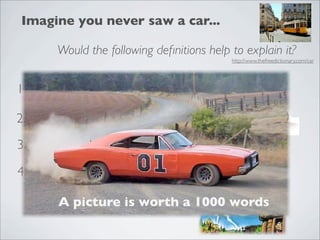
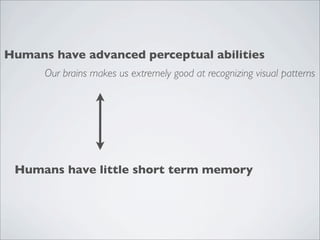
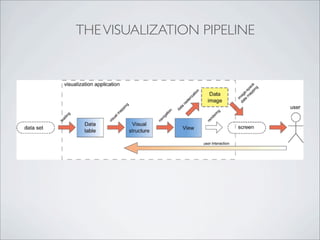
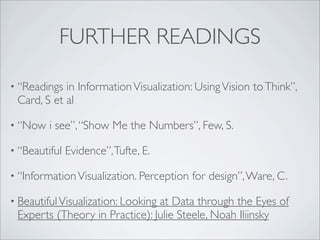
![A definition...
Information Visualisation is the use of interactive
visual representations to amplify cognition [Card. et. al]
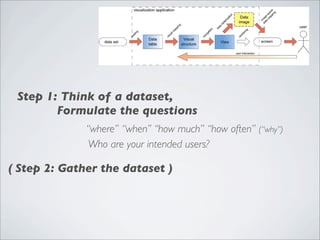
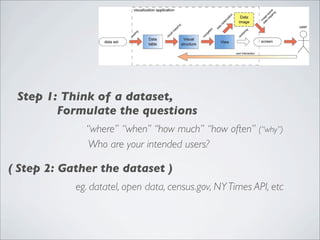
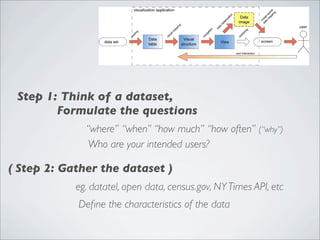
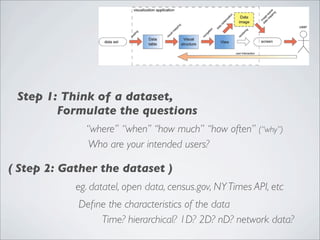
Find out what a data set is about
What are the stories behind the data?
Communicating data
Facilitate human interaction for exploration and understanding
Empower people to make informed decisions](https://image.slidesharecdn.com/workshopvisualizationjtelss-120525025352-phpapp01/85/Workshop-on-visualization-in-tel-35-320.jpg)
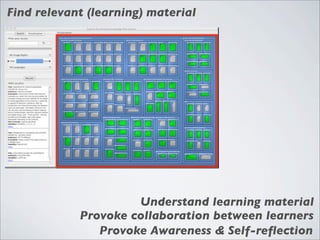
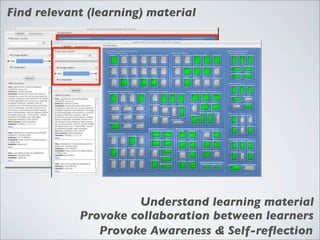
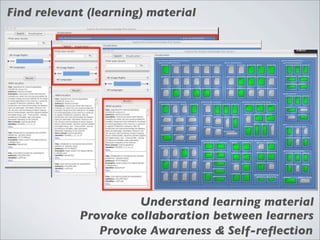
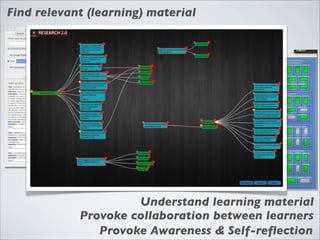
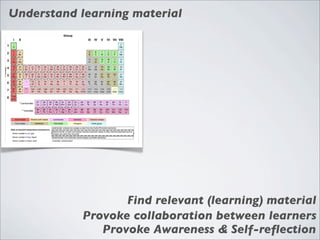
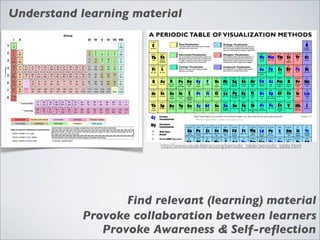
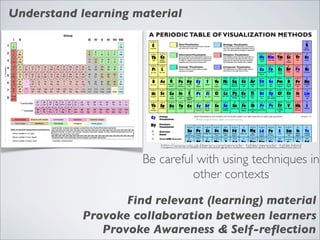
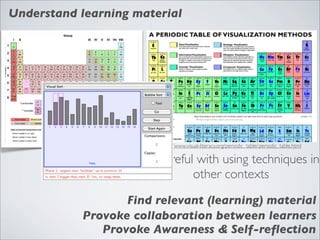
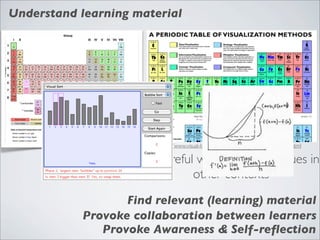
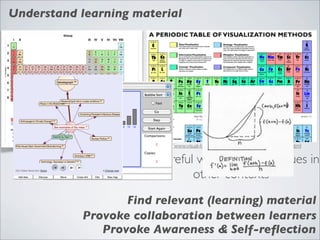
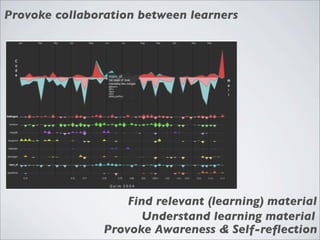
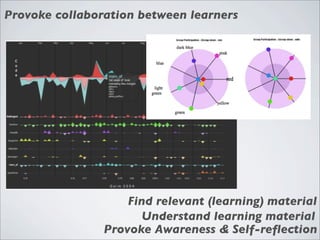
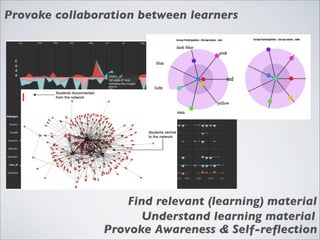
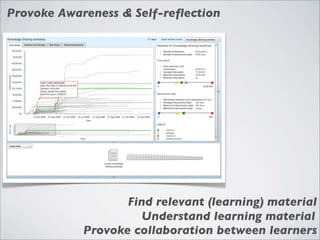
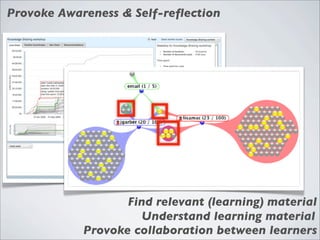
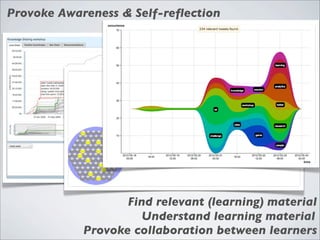

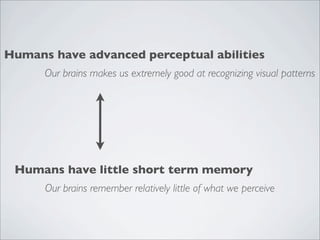
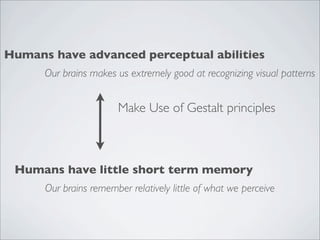

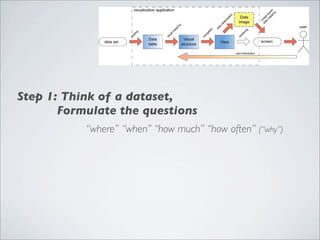
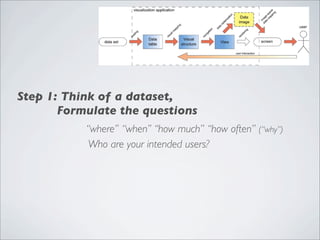
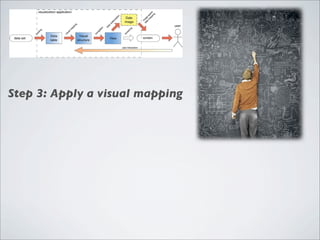

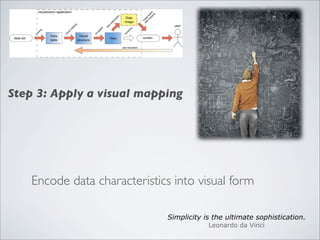
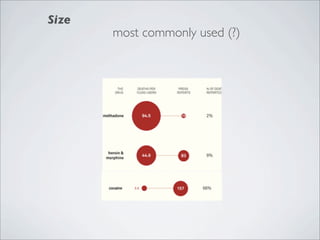
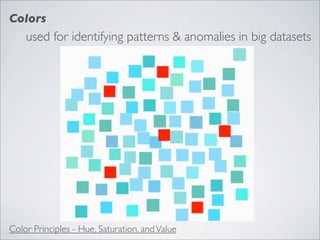
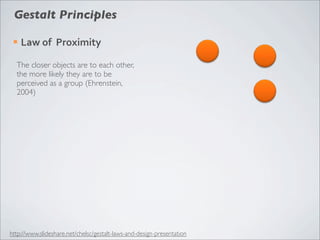
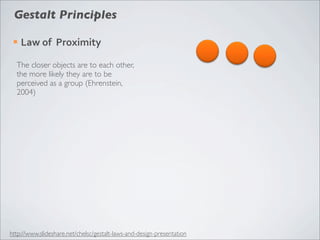
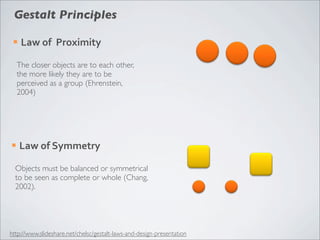
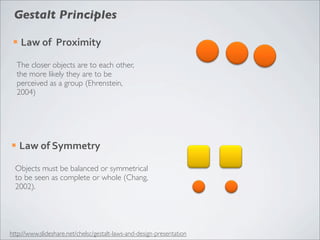
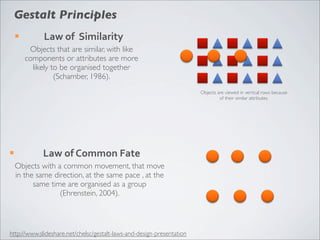
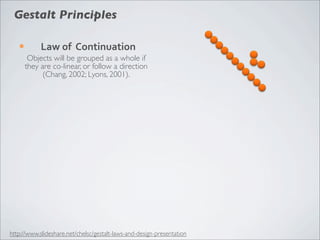
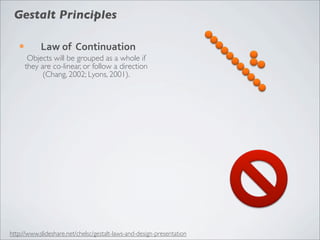
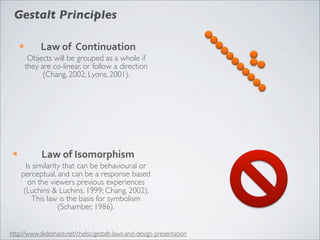
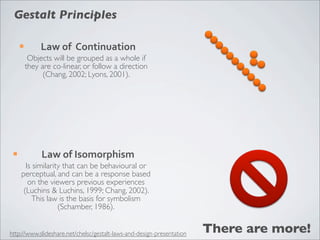
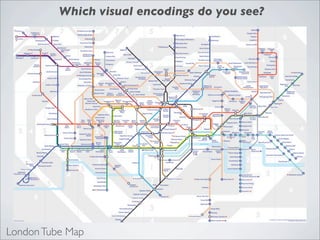
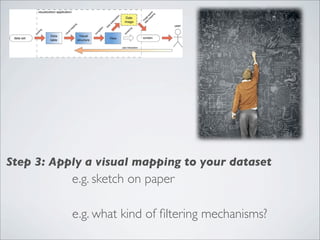
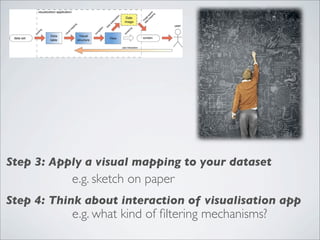

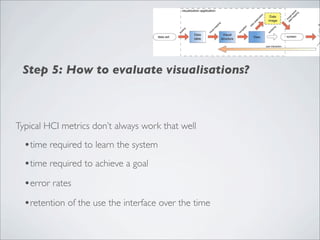
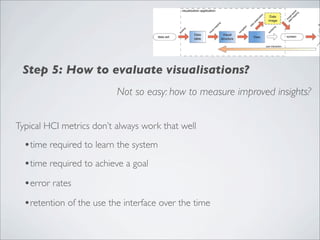


This document discusses human-computer interaction and visualization techniques for teaching and learning (TEL). It introduces concepts like using visualizations to find relevant learning materials, understand learning materials, provoke collaboration between learners, and provoke awareness and self-reflection. It also discusses the visualization pipeline, which involves formulating questions about a dataset, gathering the data, applying visual mappings to encode the data visually using techniques like size, color, and Gestalt principles of proximity, symmetry, similarity, and common fate. The goal is to leverage human perceptual abilities and use interactive visualizations to amplify cognition.


