Download as PDF, PPTX


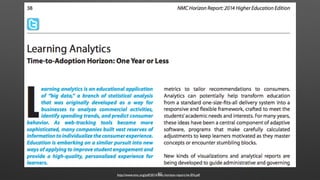


The document discusses learning analytics in the context of technology-enhanced education, emphasizing the collection and analysis of data generated by learners to improve educational outcomes. It covers various metrics used for measuring student engagement, the potential of dashboards, and the importance of self-reflection. Ethical considerations and the impact of data-driven learning are also highlighted.


