Downloaded 18 times


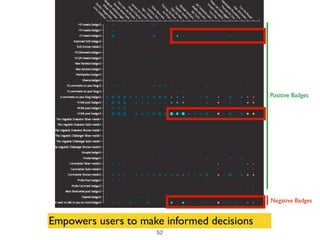
![Information Visualisation is the use
of interactive visual
representations to amplify
cognition [Card. et. al]
Definition
56](https://image.slidesharecdn.com/20160208infovisles1joris-160208164607/85/20160208-informatie-visualisatie-les-1-56-320.jpg)


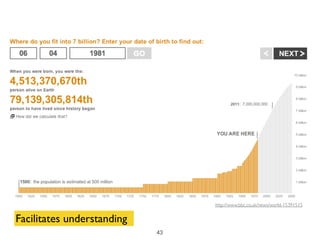
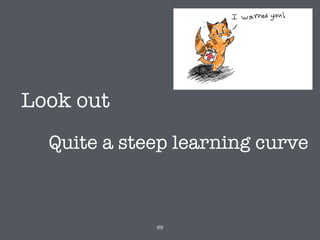
![From data.. to interactive
visualisations
[4, 8, 15, 16, 23, 42];
function(d) {
return d3.time.days(new Date(2012, 0, 1),
new Date(2013, 0, 1));
})
name,economy (mpg),cylinders,displacement (cc),power (hp),weight (lb),0-60 mph (s),year
AMC Ambassador Brougham,13,8,360,175,3821,11,73
AMC Ambassador DPL,15,8,390,190,3850,8.5,70
AMC Ambassador SST,17,8,304,150,3672,11.5,72
AMC Concord DL 6,20.2,6,232,90,3265,18.2,79
AMC Concord DL,18.1,6,258,120,3410,15.1,78
AMC Concord DL,23,4,151,,3035,20.5,82
AMC Concord,19.4,6,232,90,3210,17.2,78
AMC Concord,24.3,4,151,90,3003,20.1,80
CSV
{
"employees": [
{ "firstName":"John" , "lastName":"Doe" },
{ "firstName":"Anna" , "lastName":"Smith" },
{ "firstName":"Peter" , "lastName":"Jones" }
]
}
JSON
65
javascript](https://image.slidesharecdn.com/20160208infovisles1joris-160208164607/85/20160208-informatie-visualisatie-les-1-65-320.jpg)


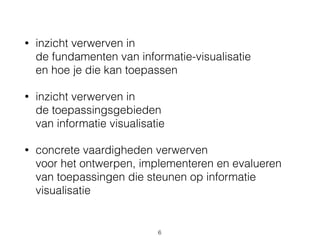
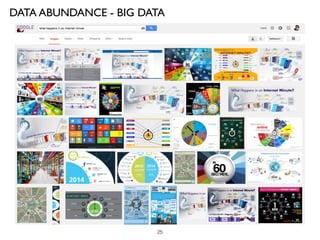
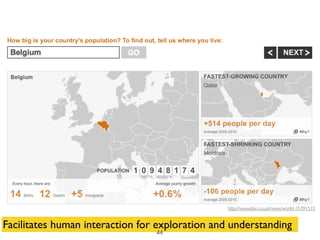
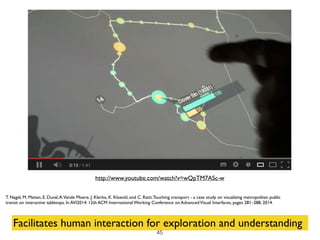
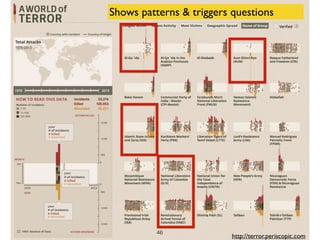
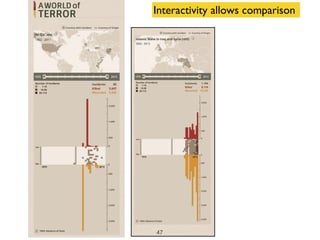
This document provides an introduction to an information visualization course. It outlines the goals of the course, which are to provide insights into fundamentals of infovis and its applications, as well as concrete skills for designing, implementing, and evaluating infovis applications. It discusses topics that will be covered like data abundance, visualization examples, the definition of infovis, and introduces the D3.js library. Students are expected to complete a group project, write a paper, and provide feedback to other groups.


