Download to read offline


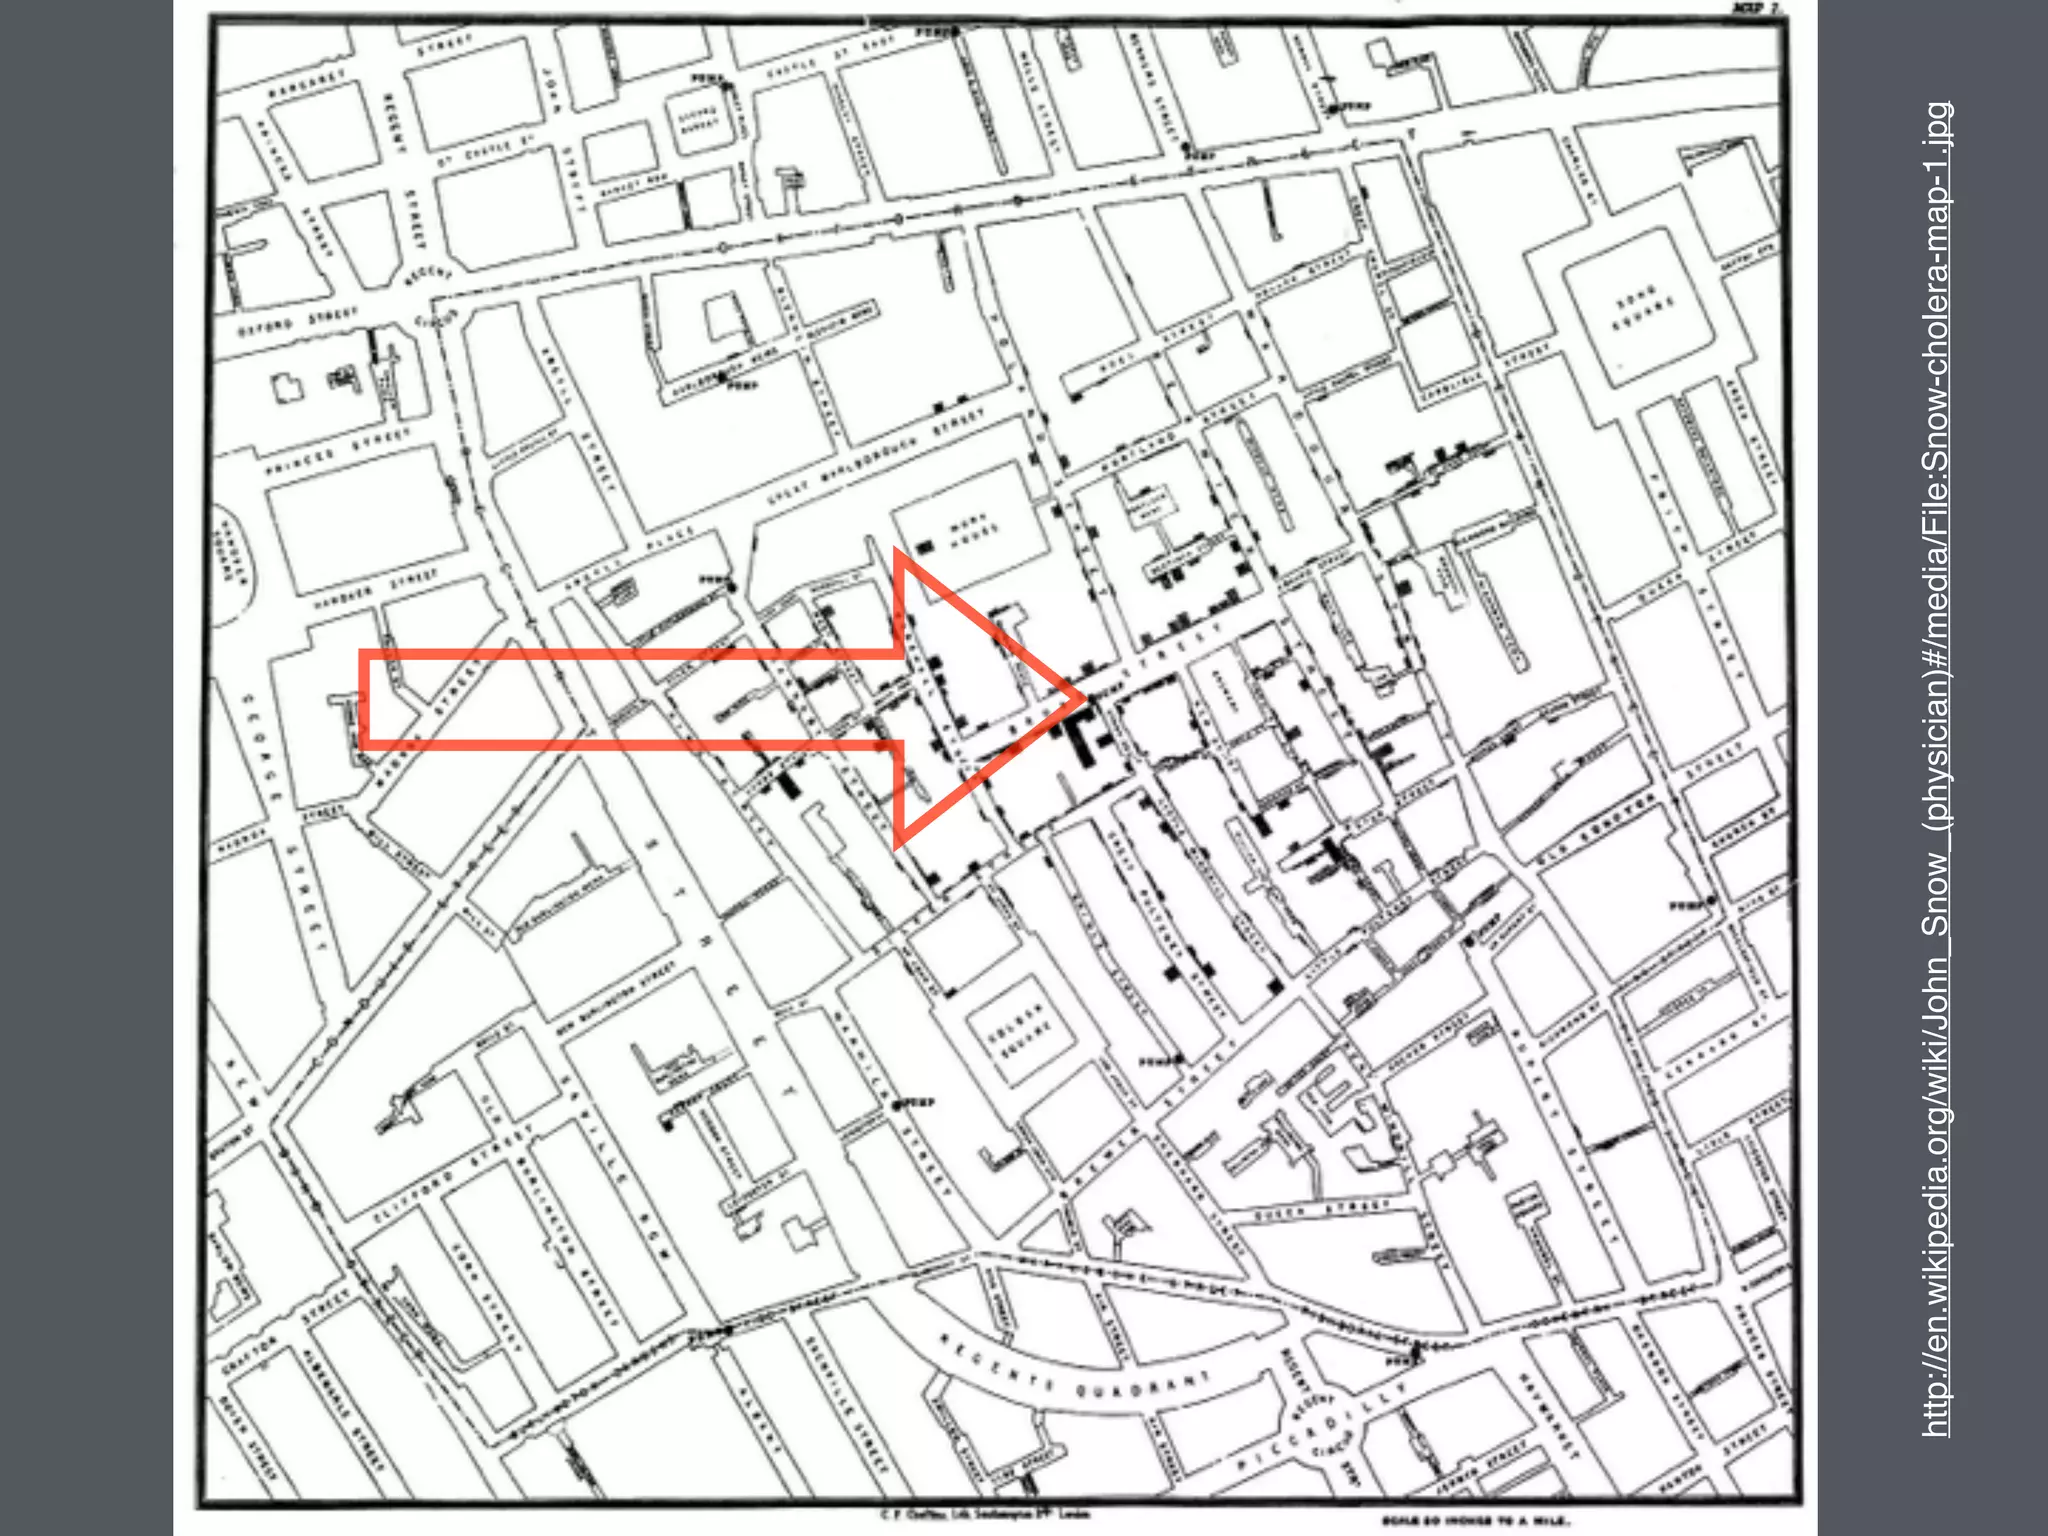
![On proceeding to the spot, I found that nearly all
the deaths had taken place within a short
distance of the [Broad Street] pump.There were
only ten deaths in houses situated decidedly
nearer to another street-pump. In five of these
cases the families of the deceased persons
informed me that they always sent to the pump
in Broad Street, as they preferred the water to
that of the pumps which were nearer. In three
other cases, the deceased were children who
went to school near the pump in Broad Street...](https://image.slidesharecdn.com/20150330infovishistoryerik-150330141843-conversion-gate01/75/A-short-history-and-even-shorter-future-of-information-visualisation-17-2048.jpg)
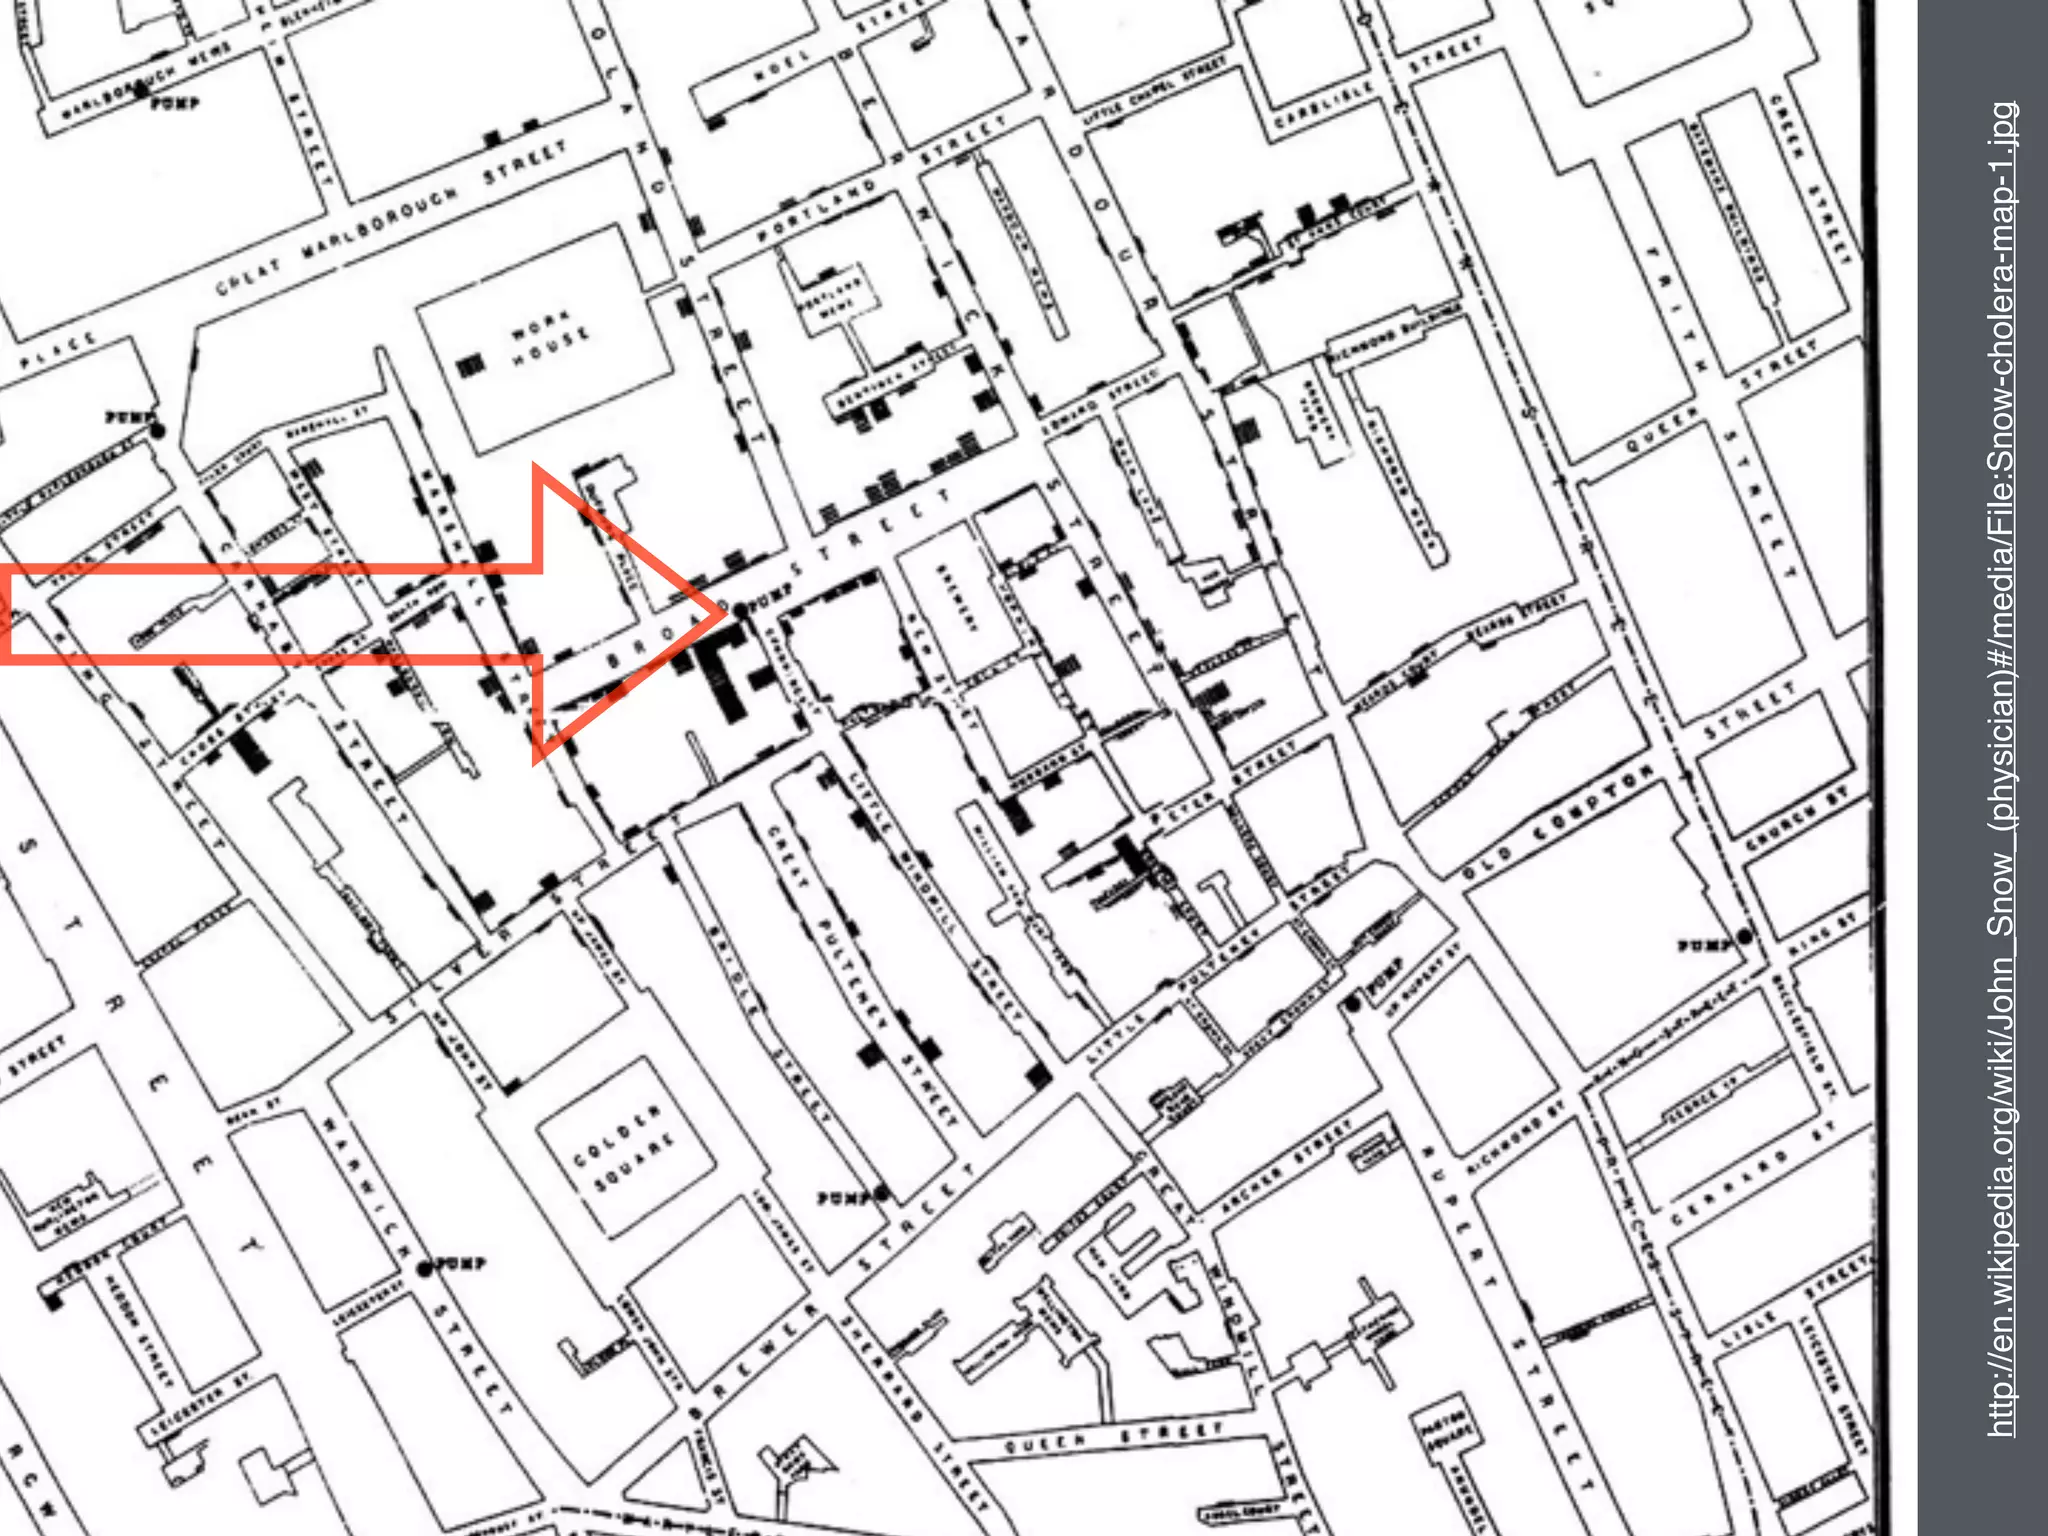
![I had an interview with the Board of Guardians
of St James's parish, on the evening of the 7th
inst [7 September], and represented the above
circumstances to them. In consequence of what I
said, the handle of the pump was removed on
the following day.](https://image.slidesharecdn.com/20150330infovishistoryerik-150330141843-conversion-gate01/75/A-short-history-and-even-shorter-future-of-information-visualisation-18-2048.jpg)

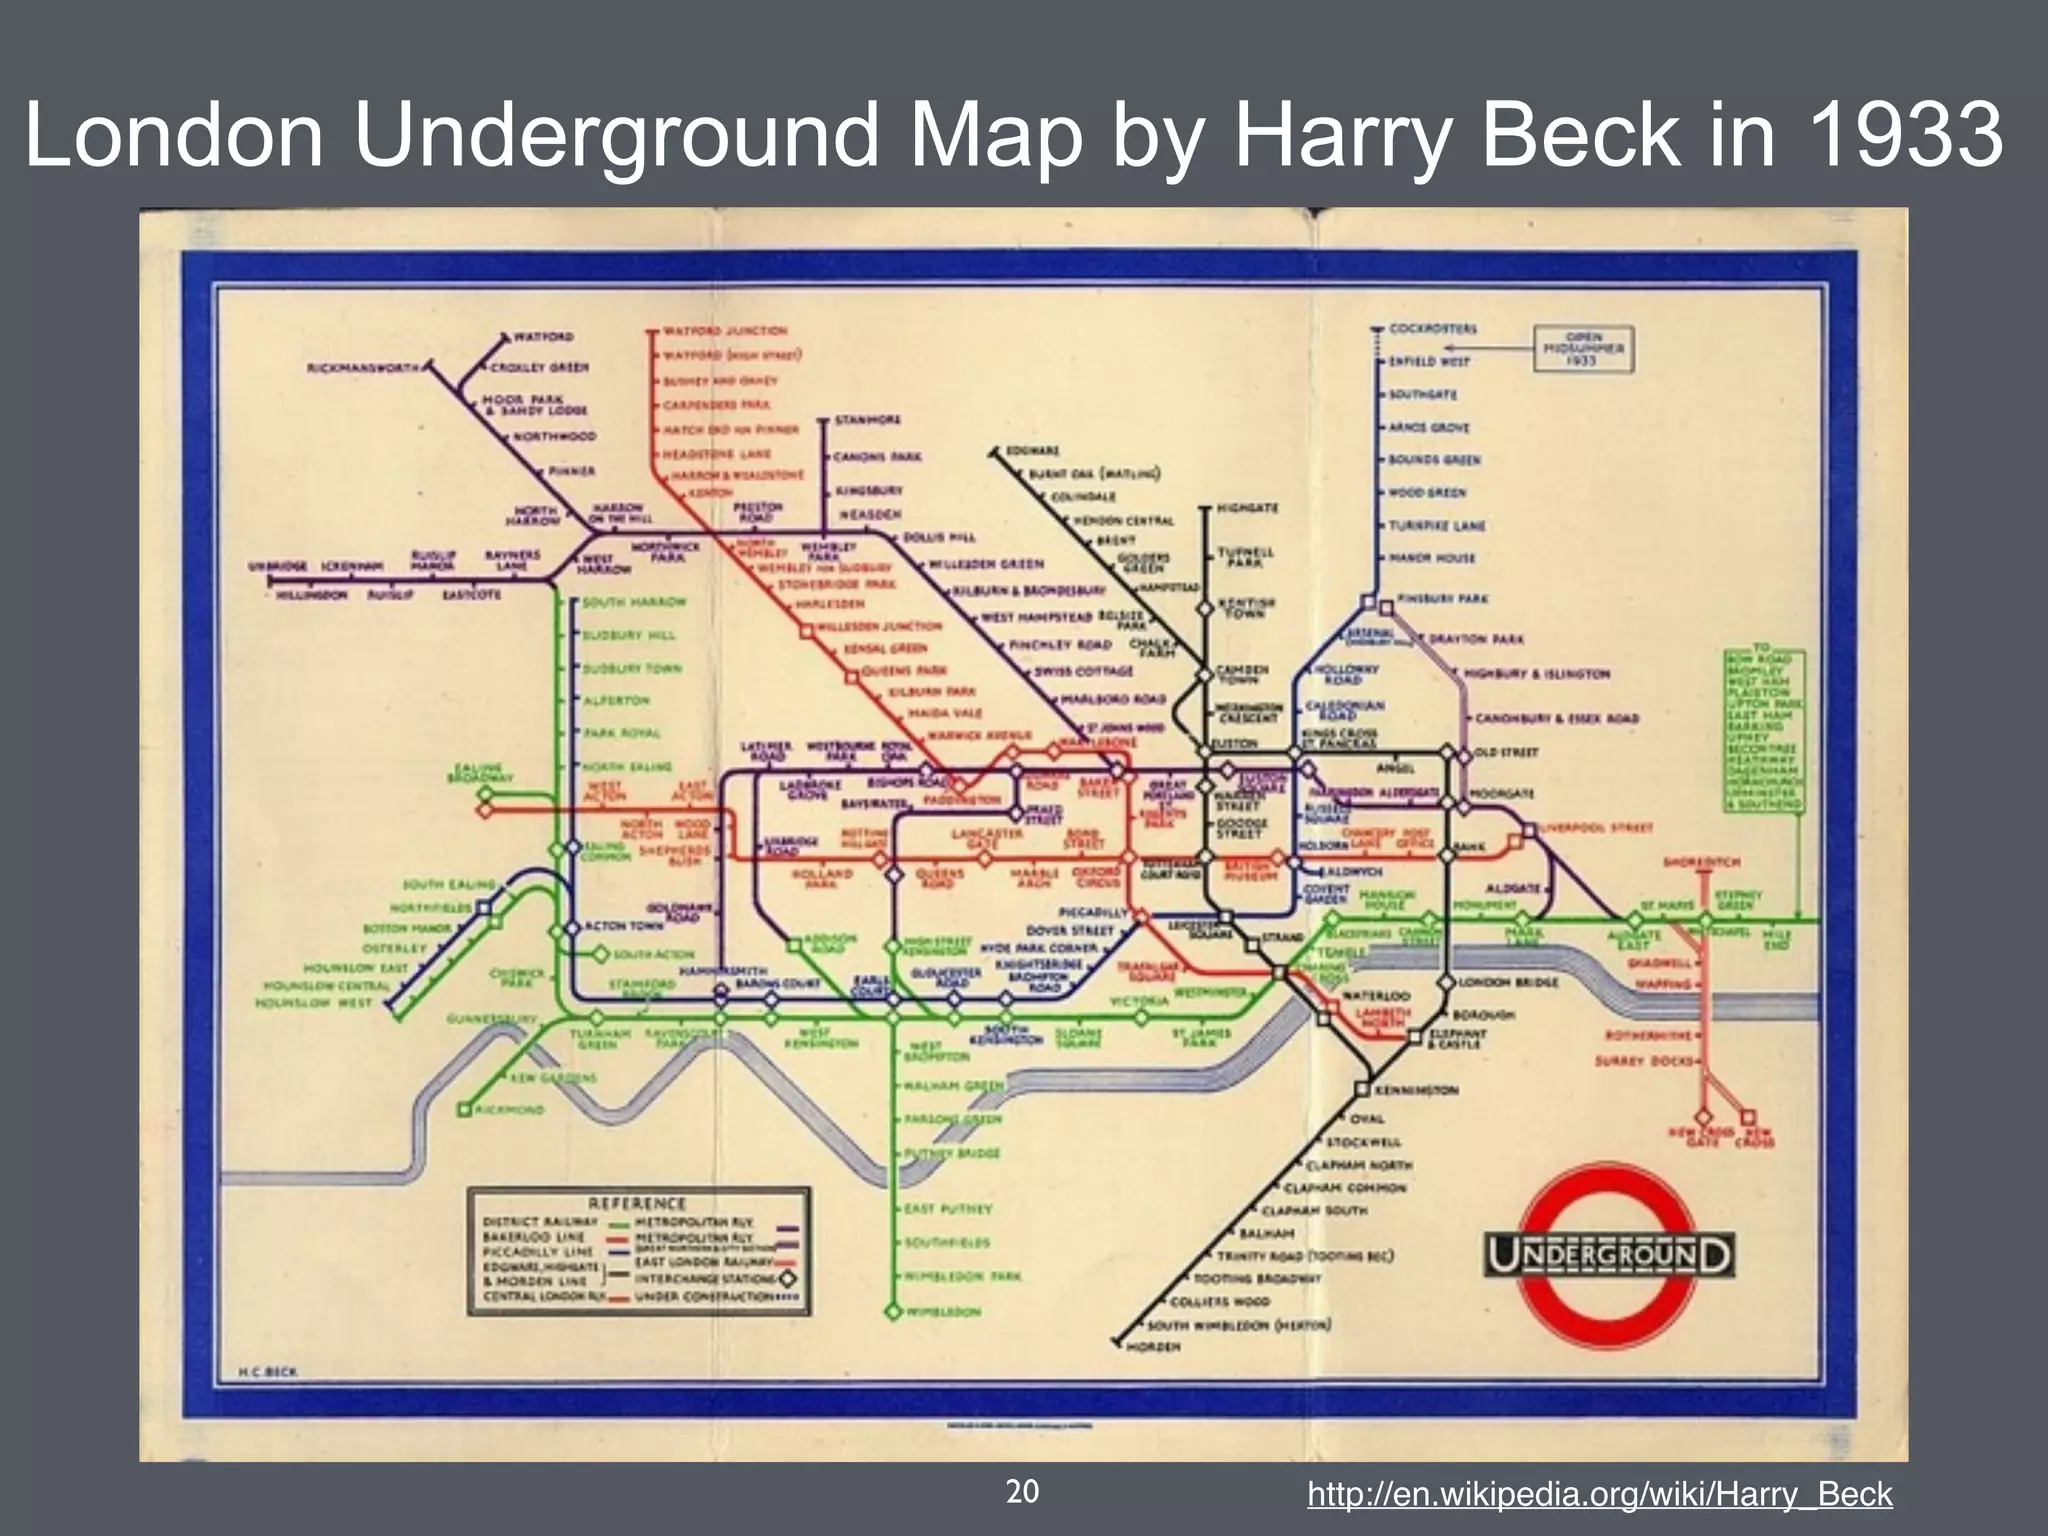
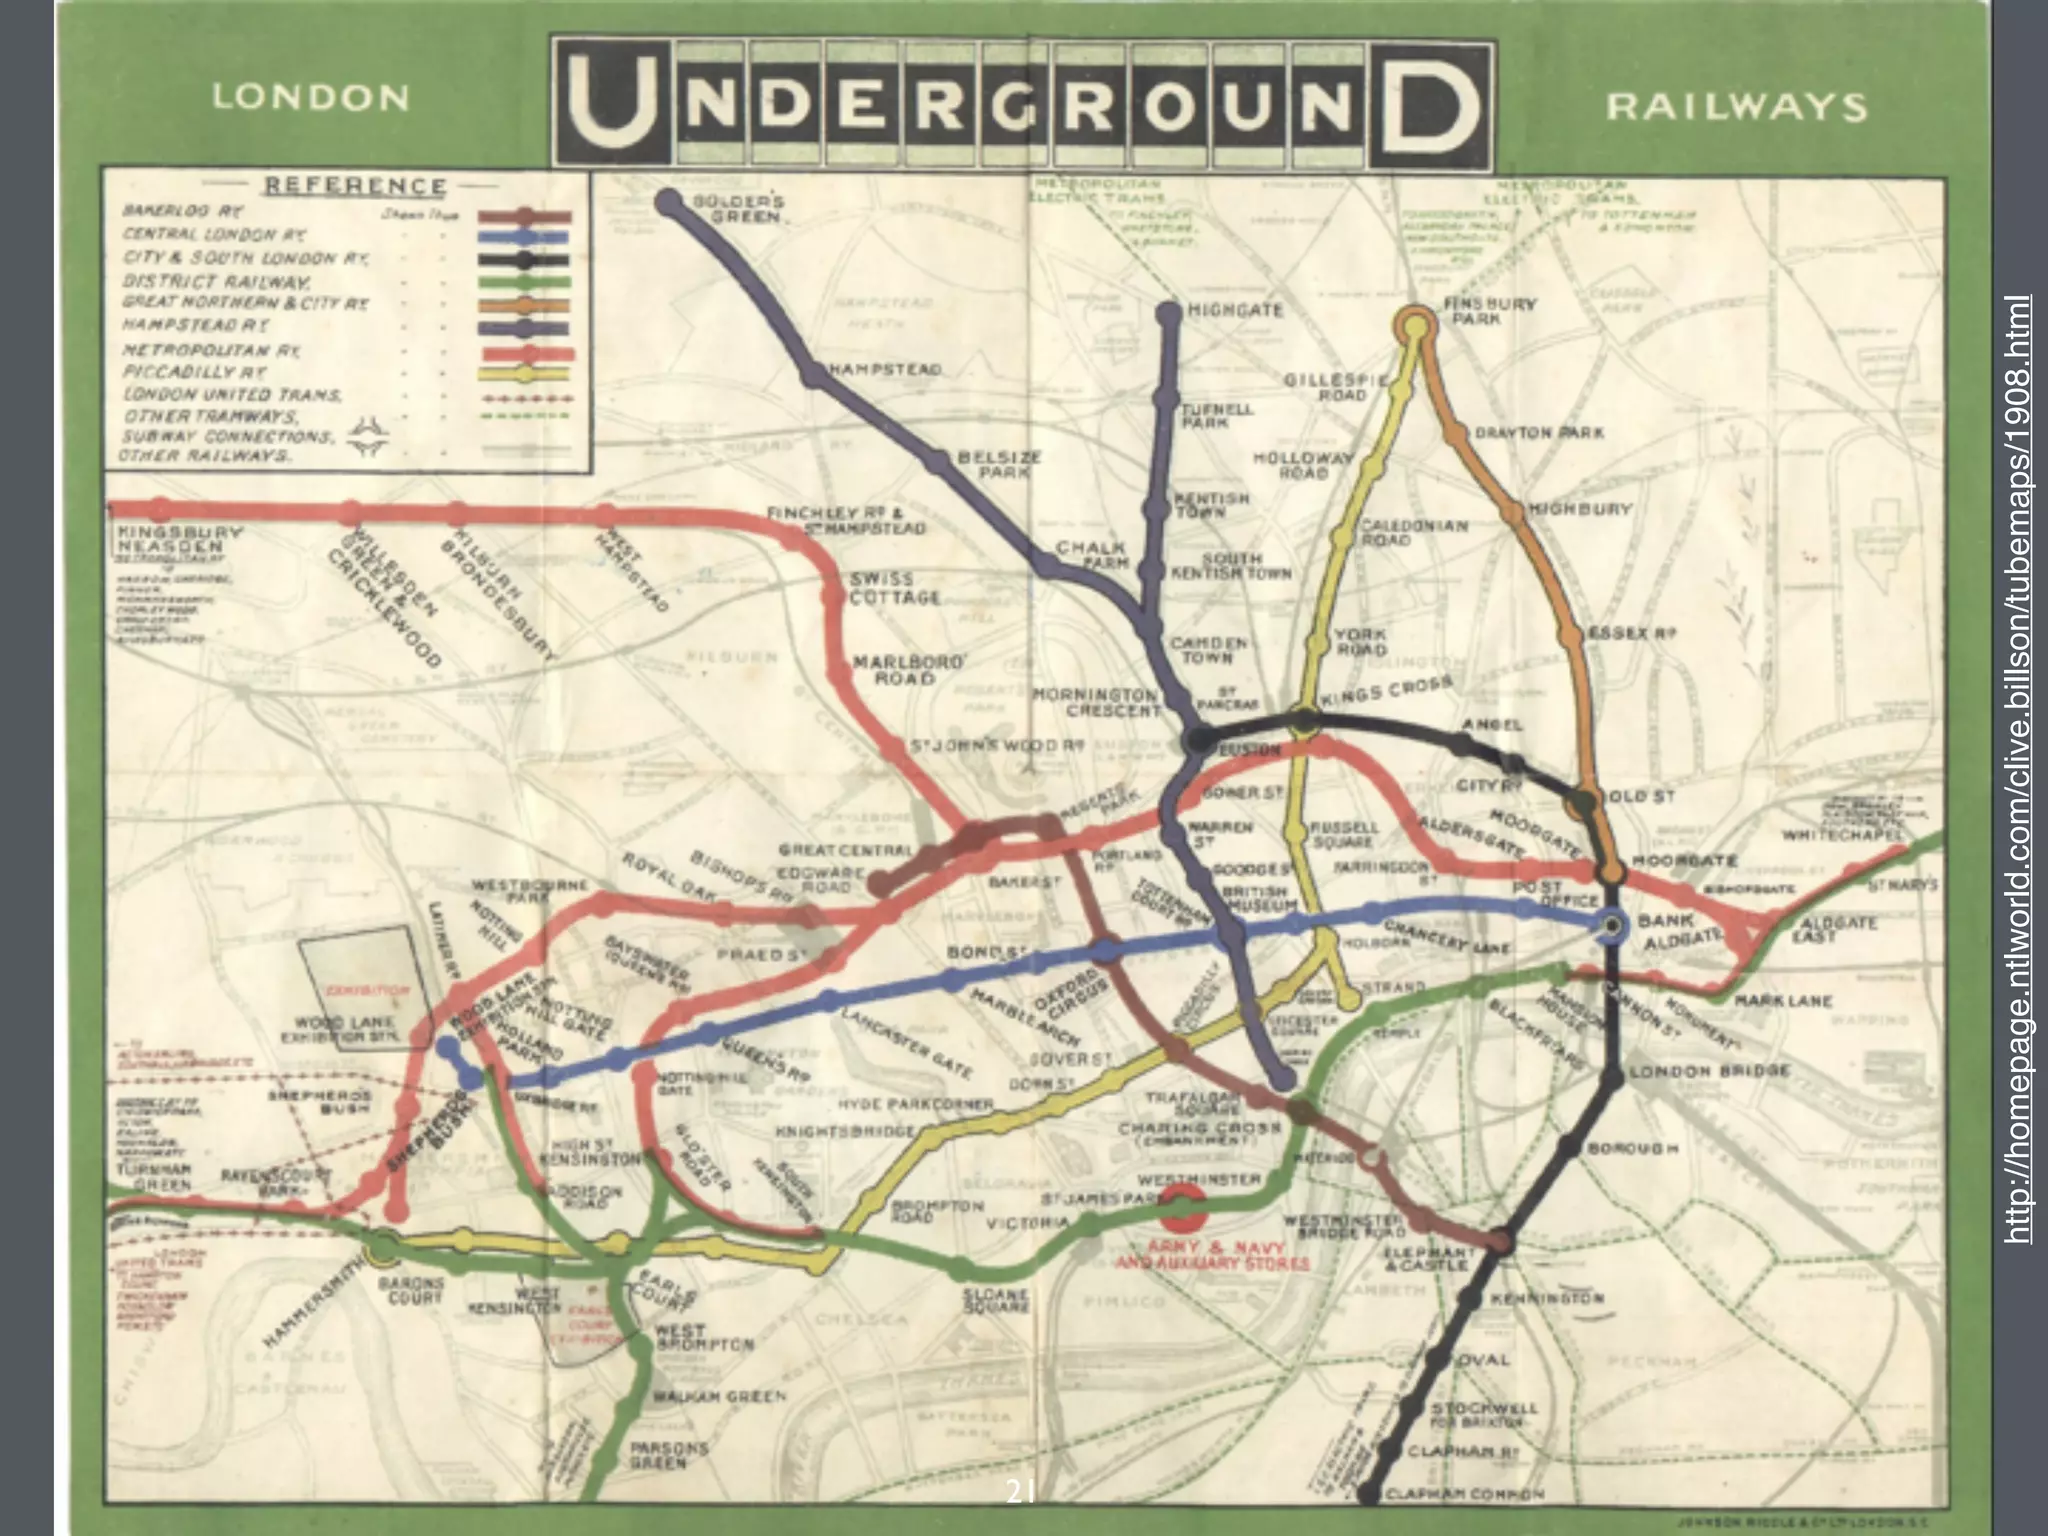

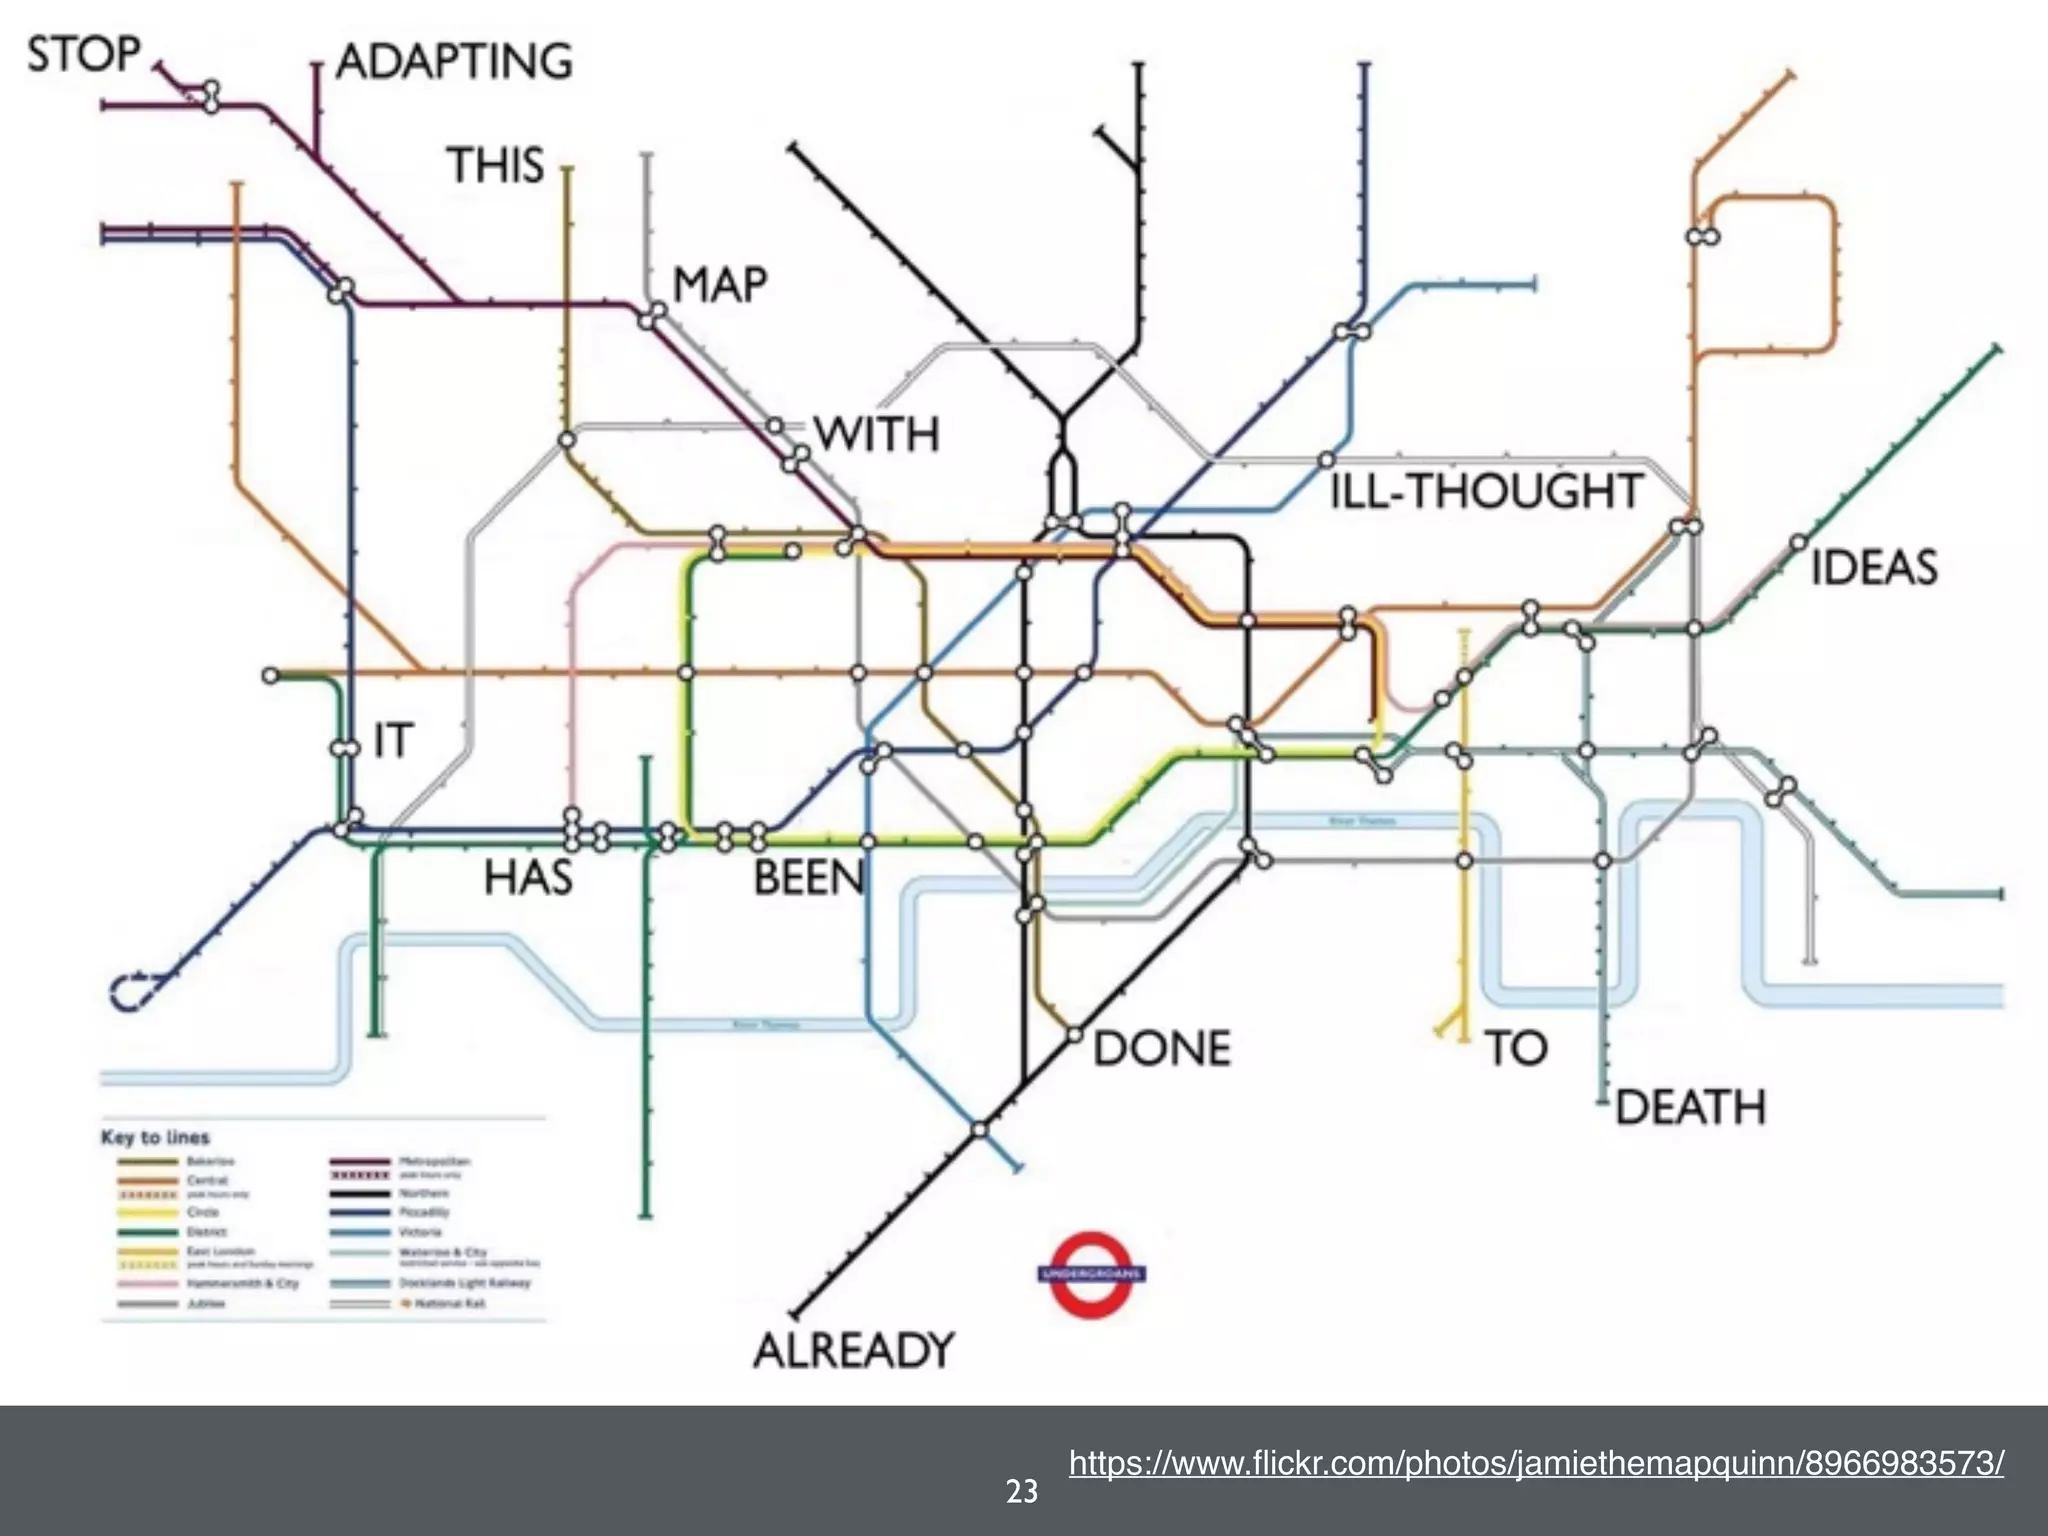


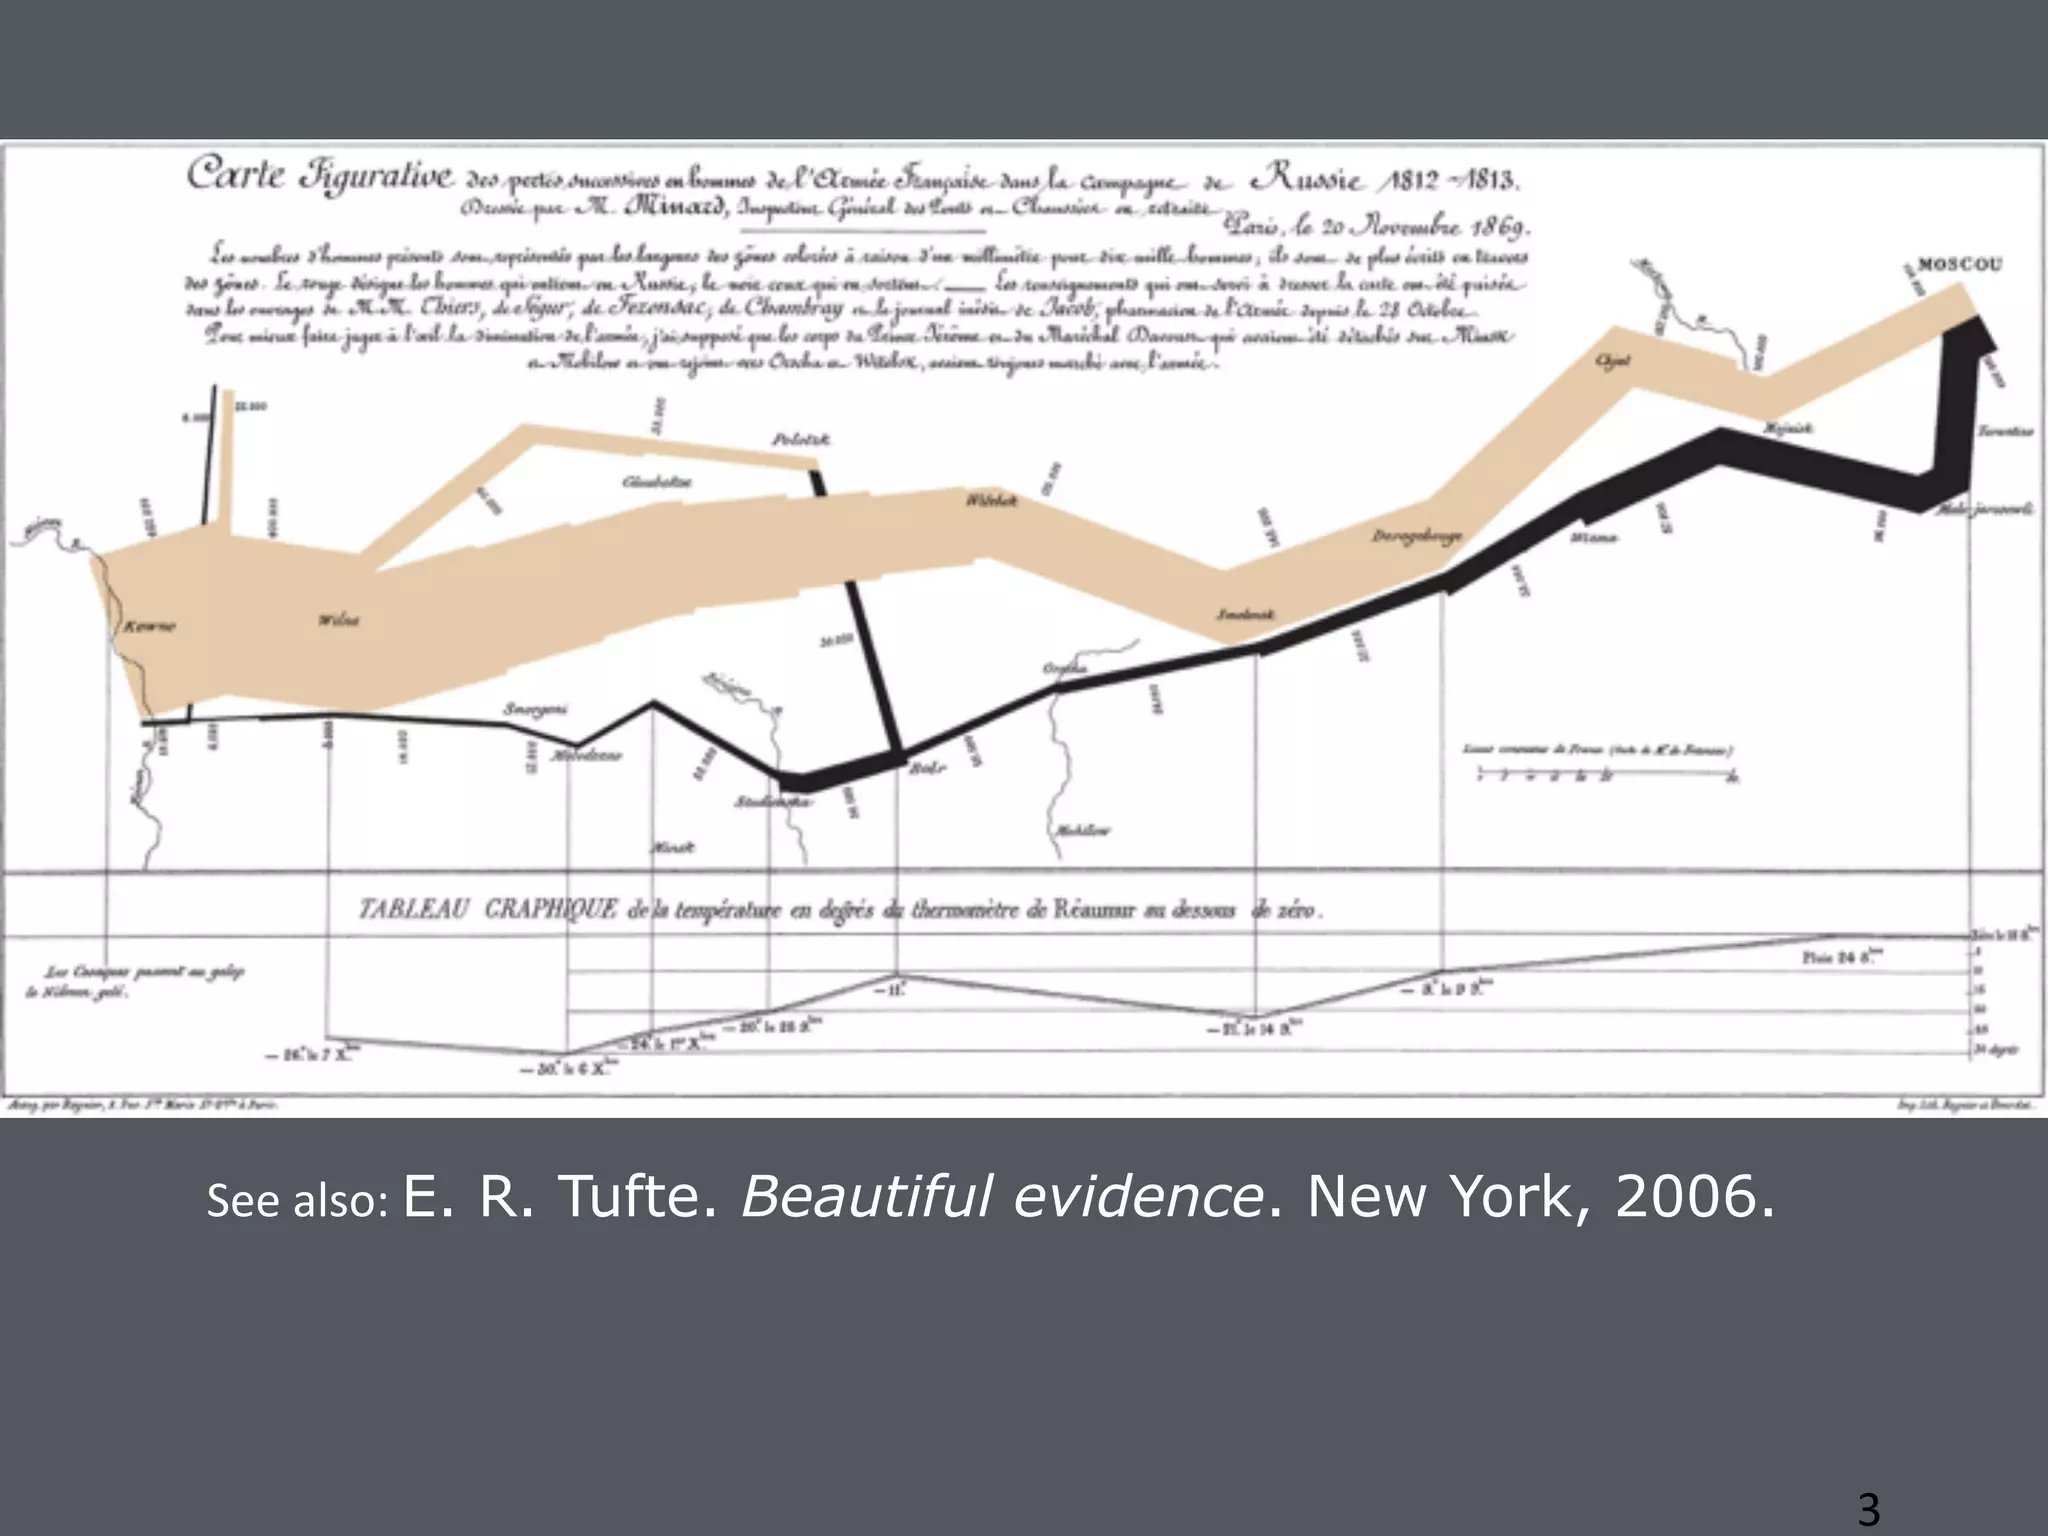
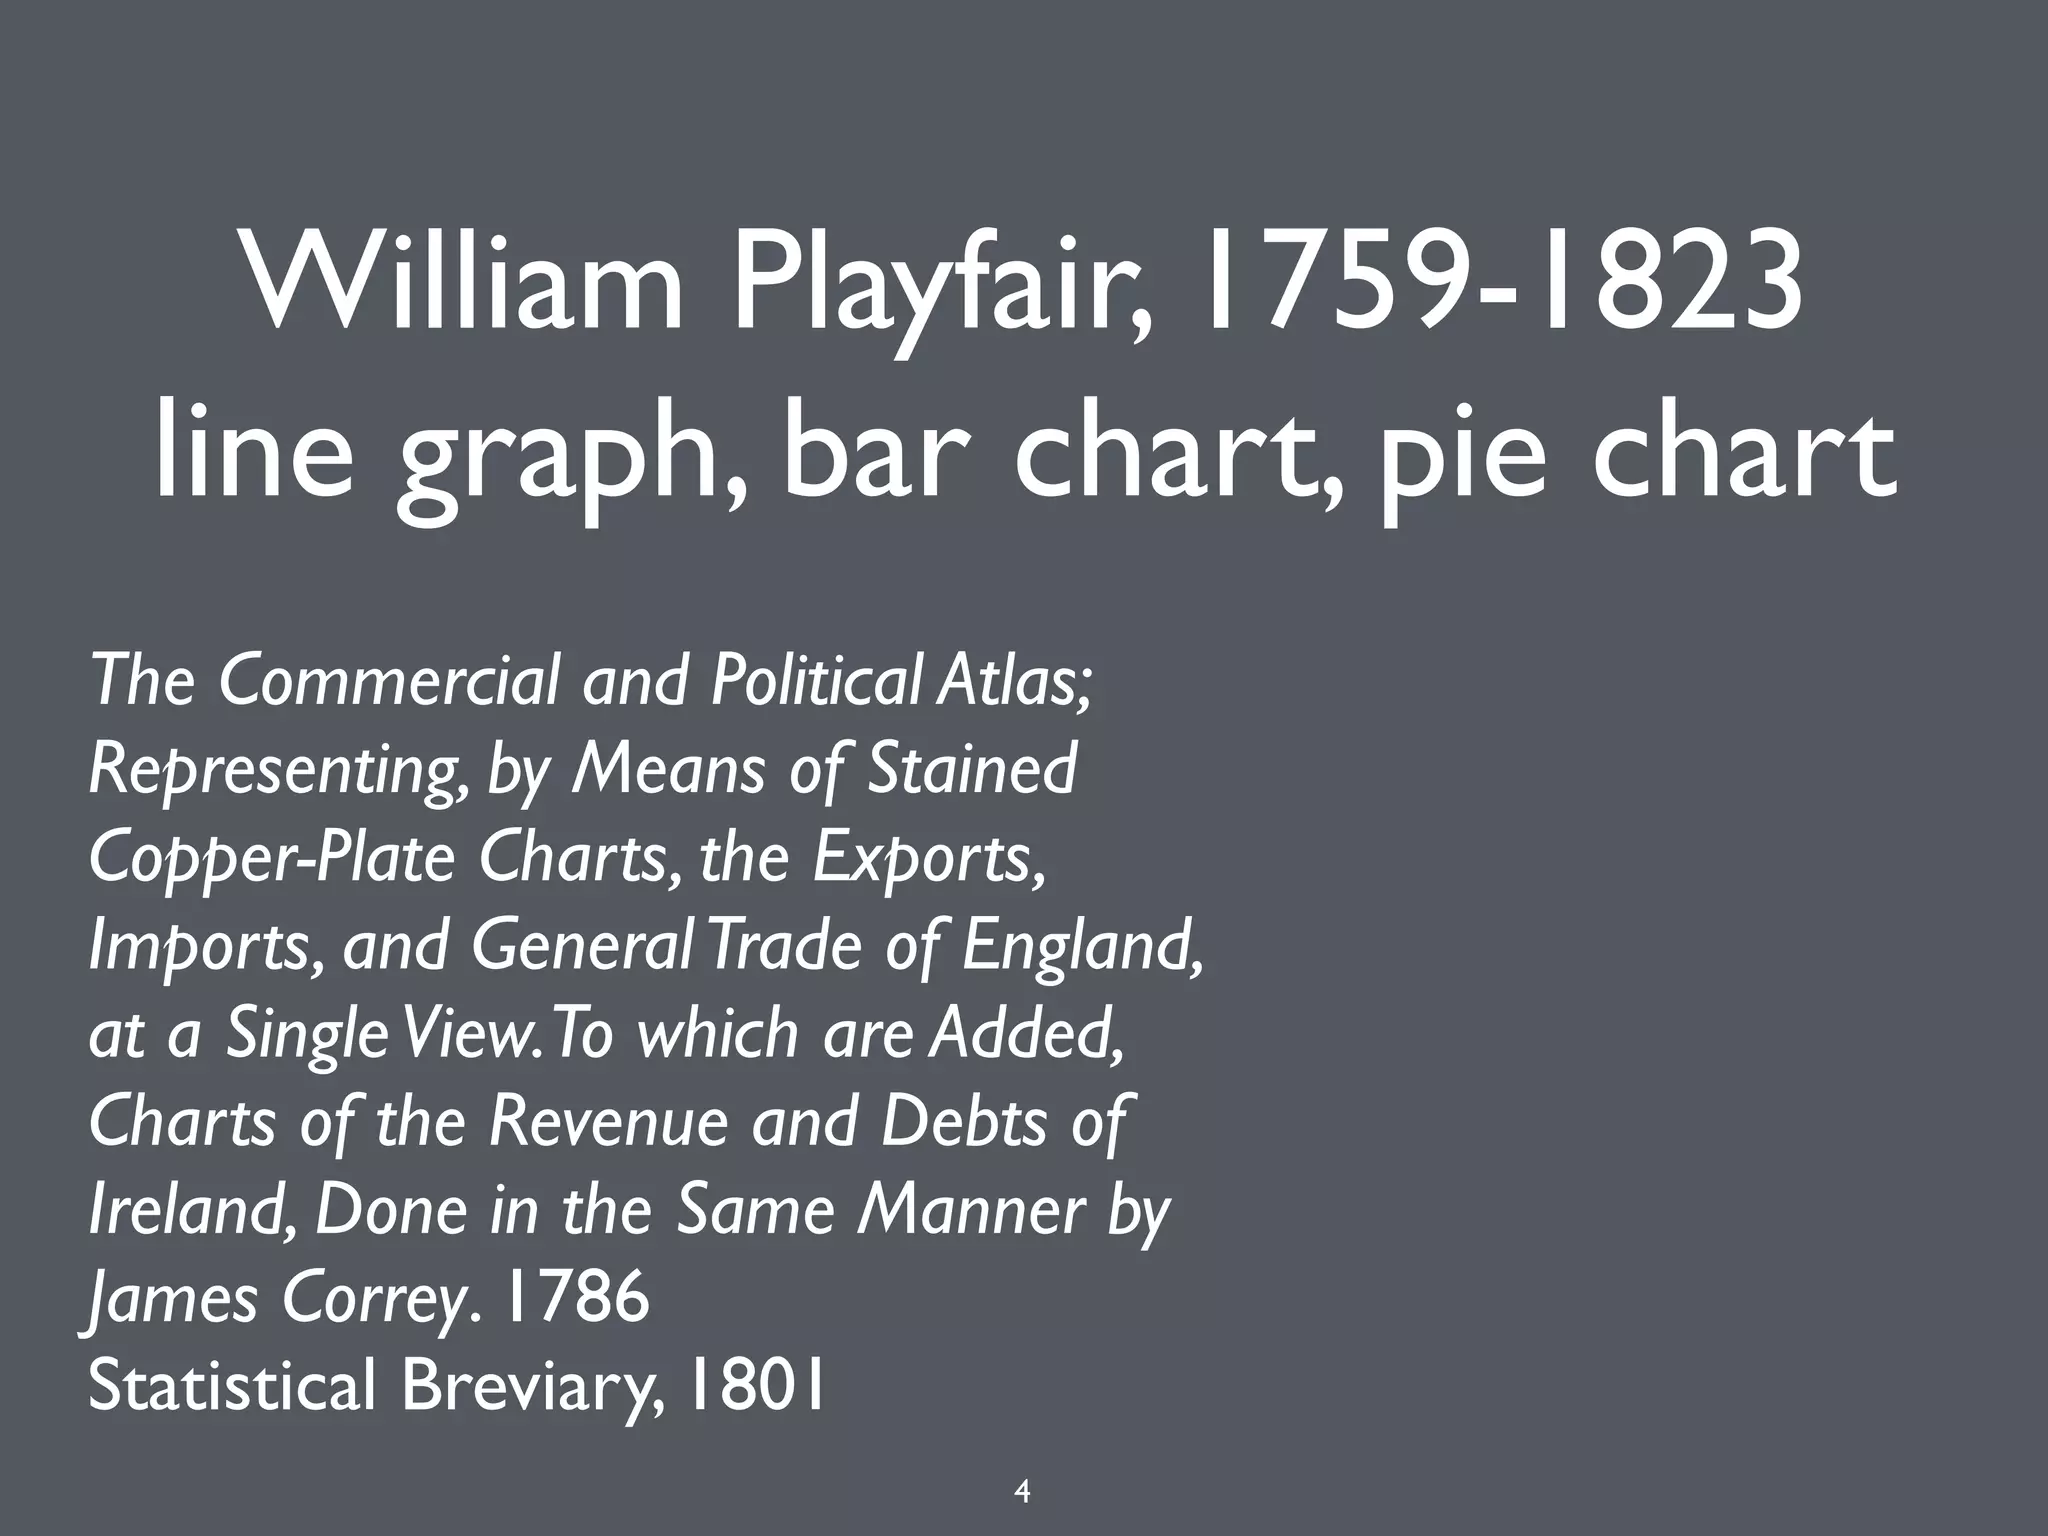
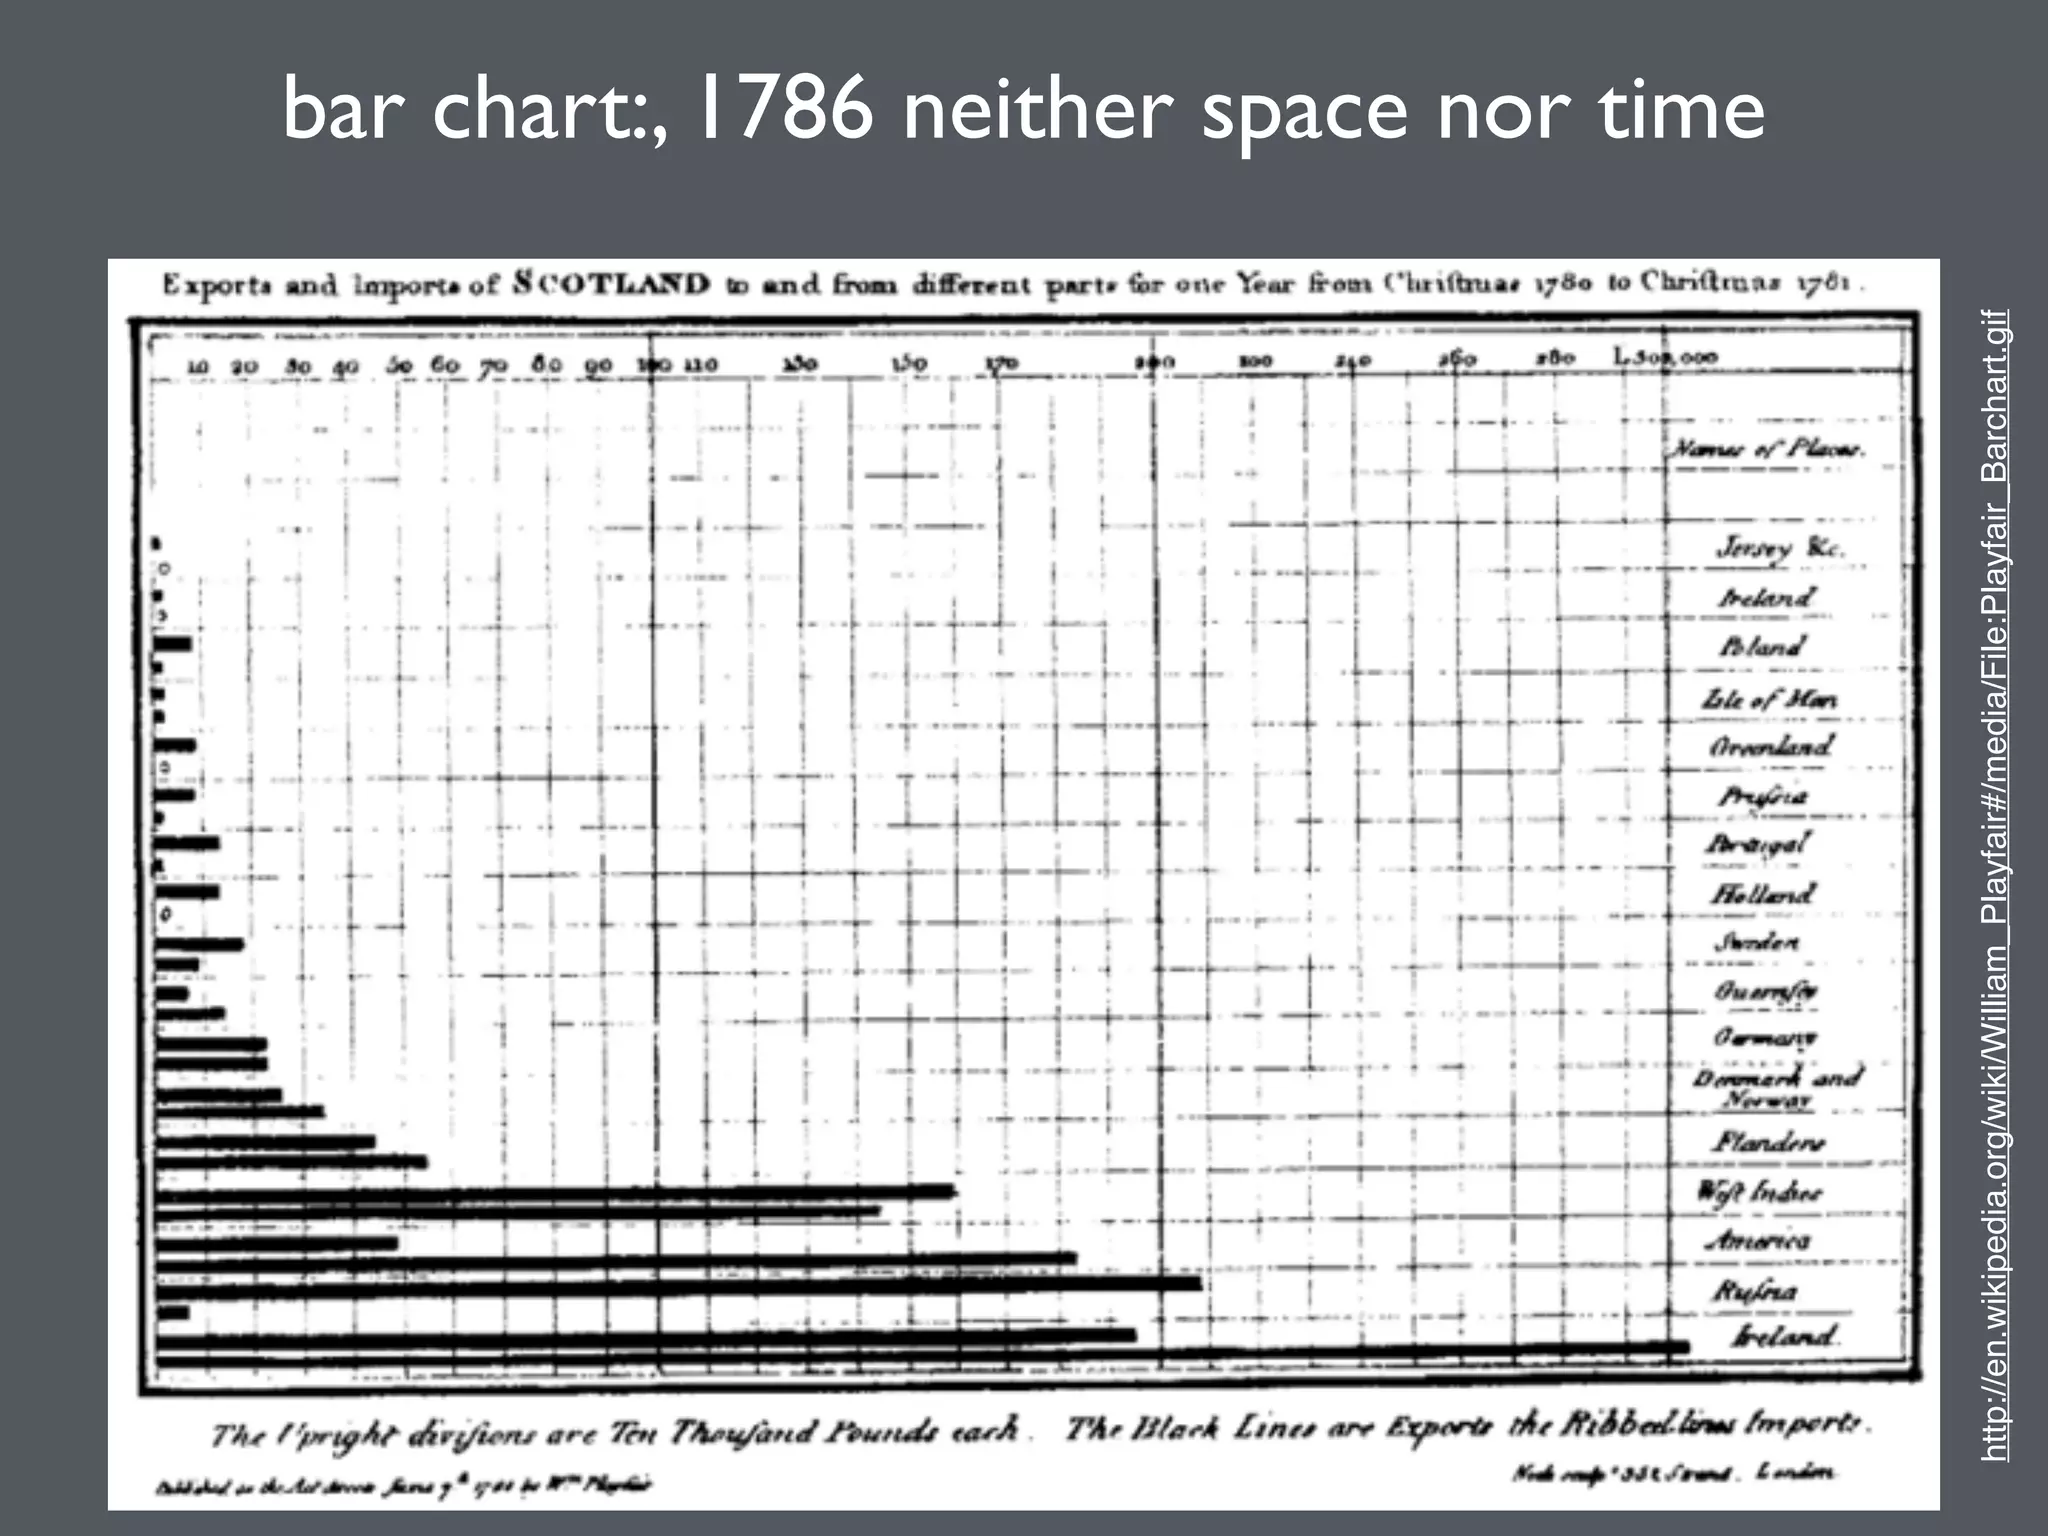
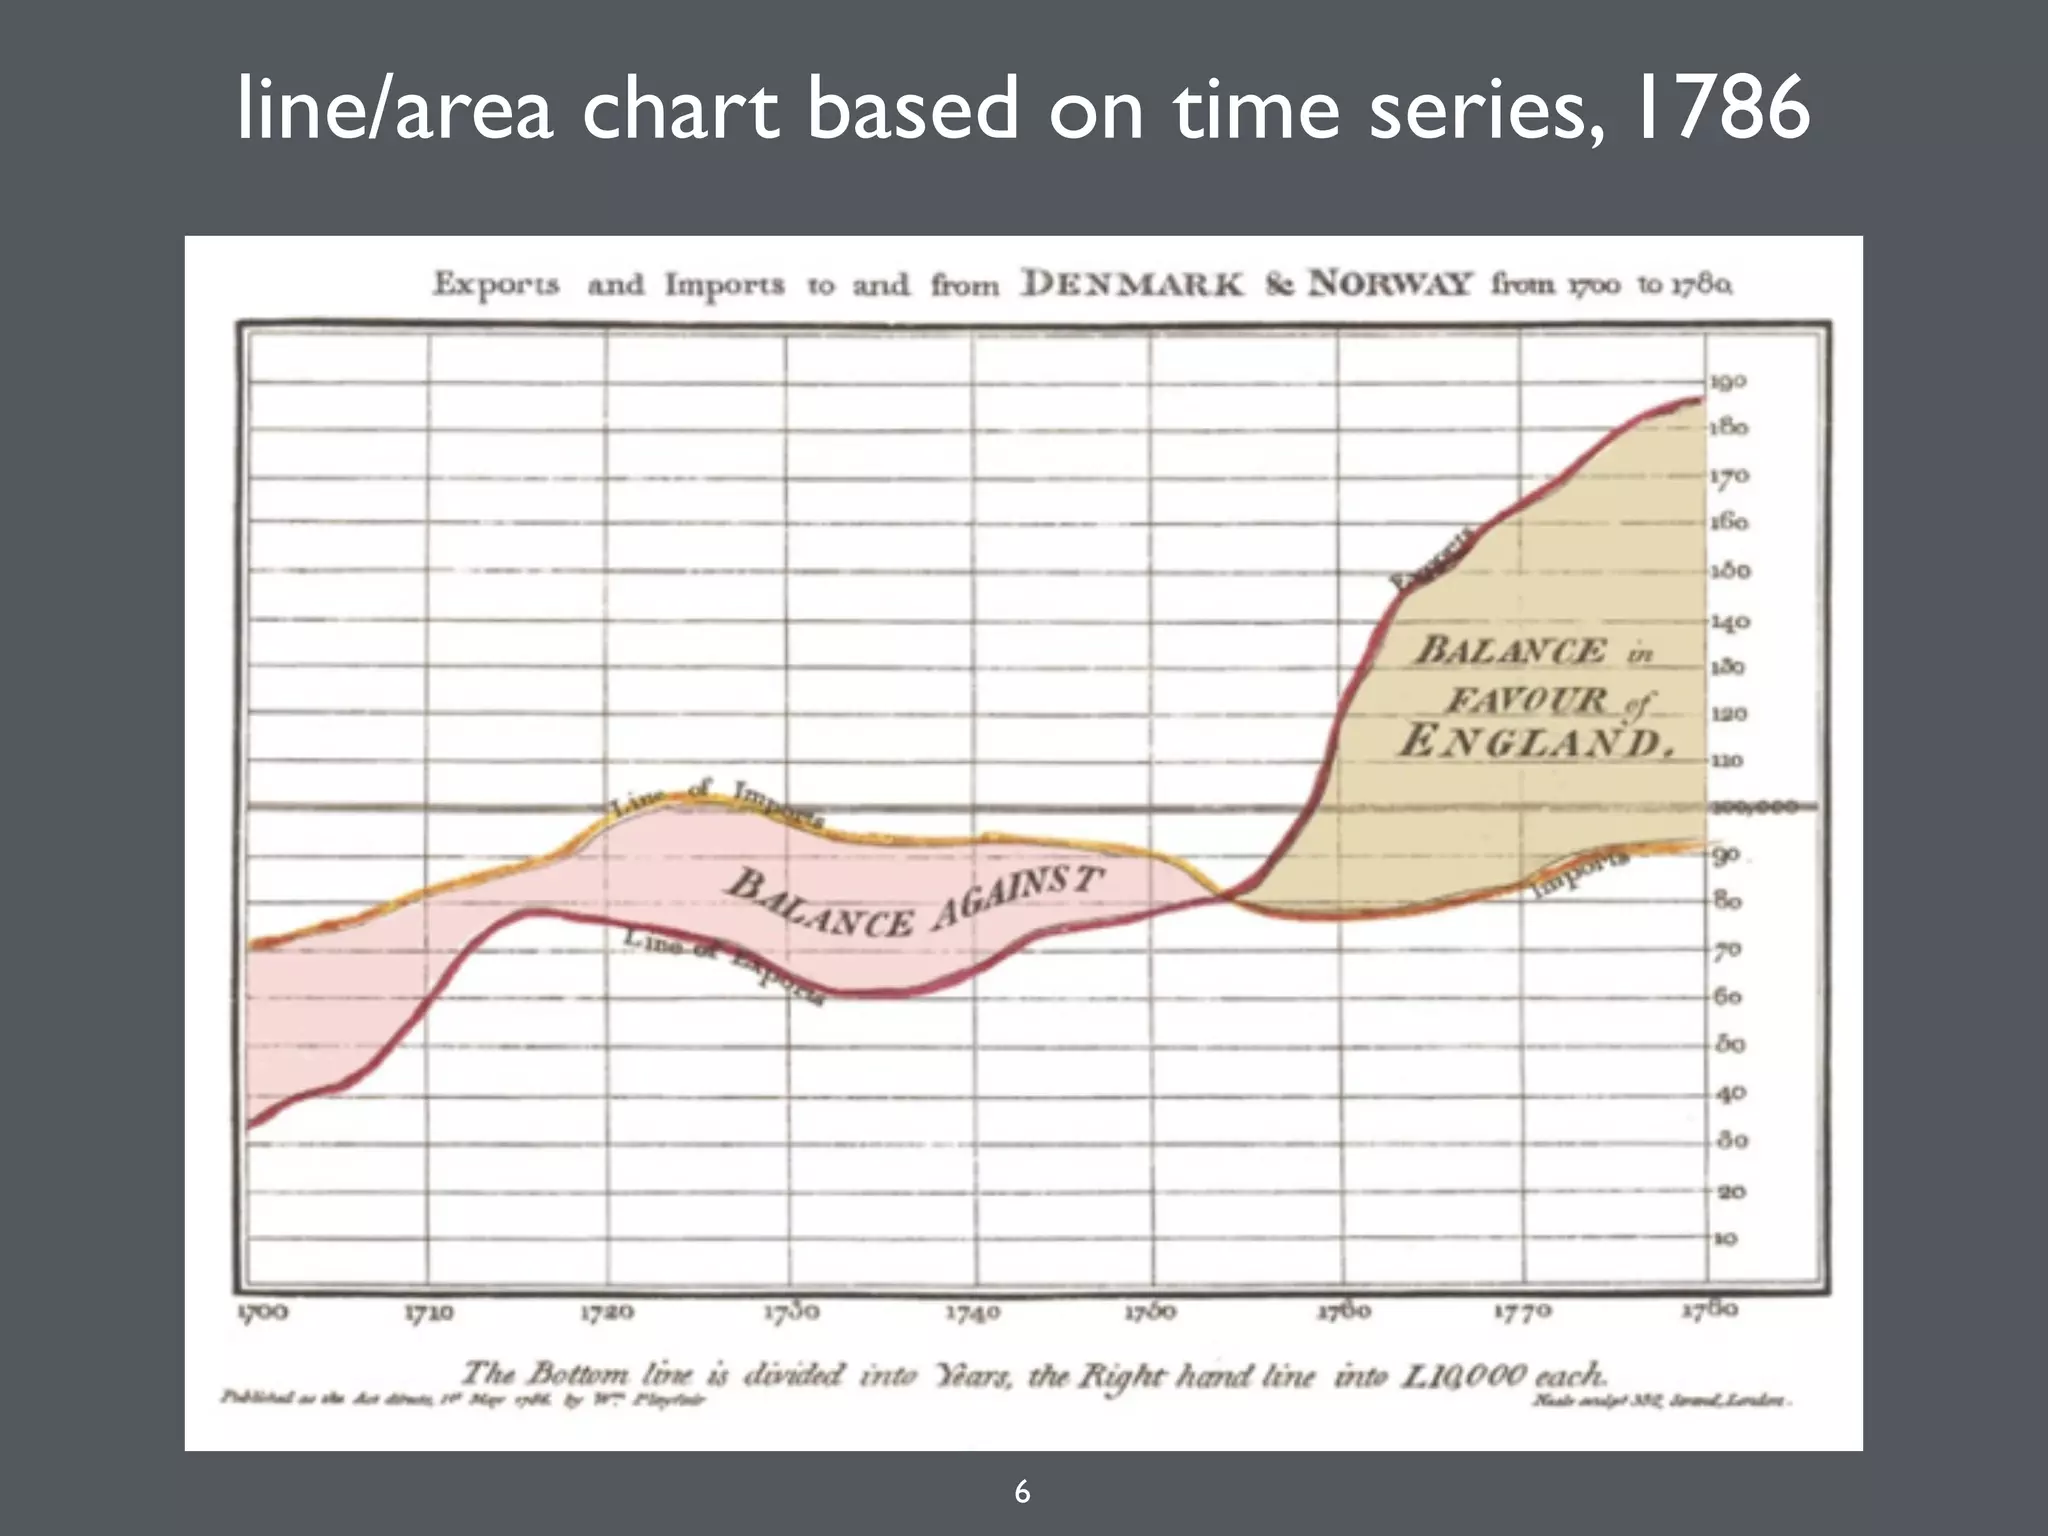
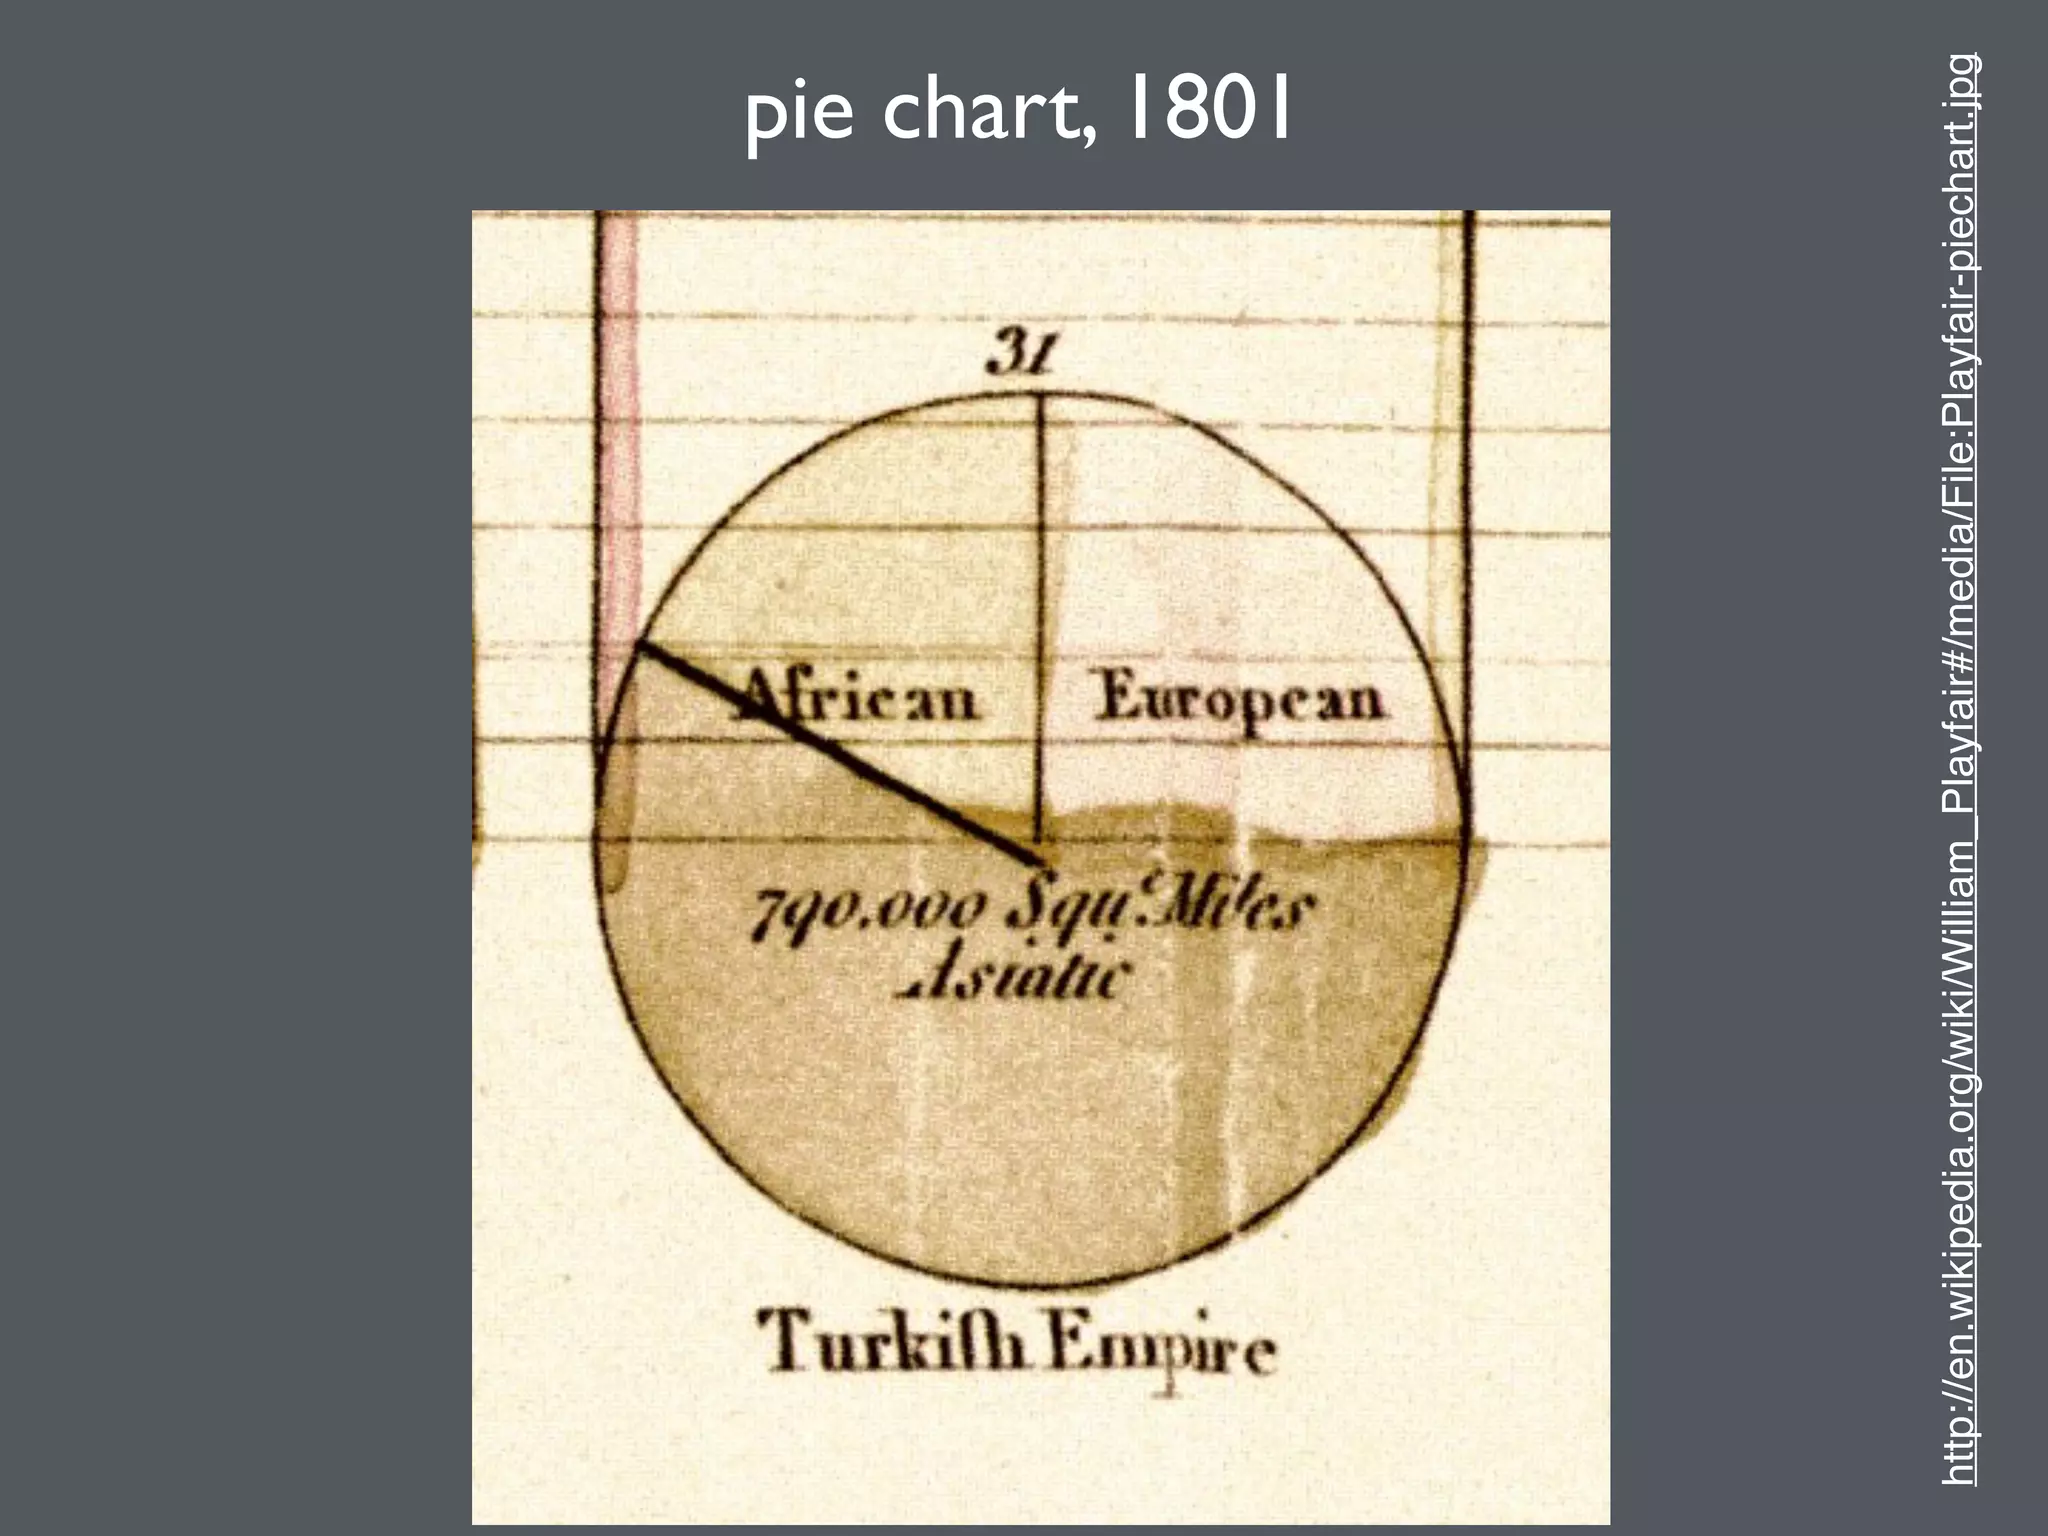
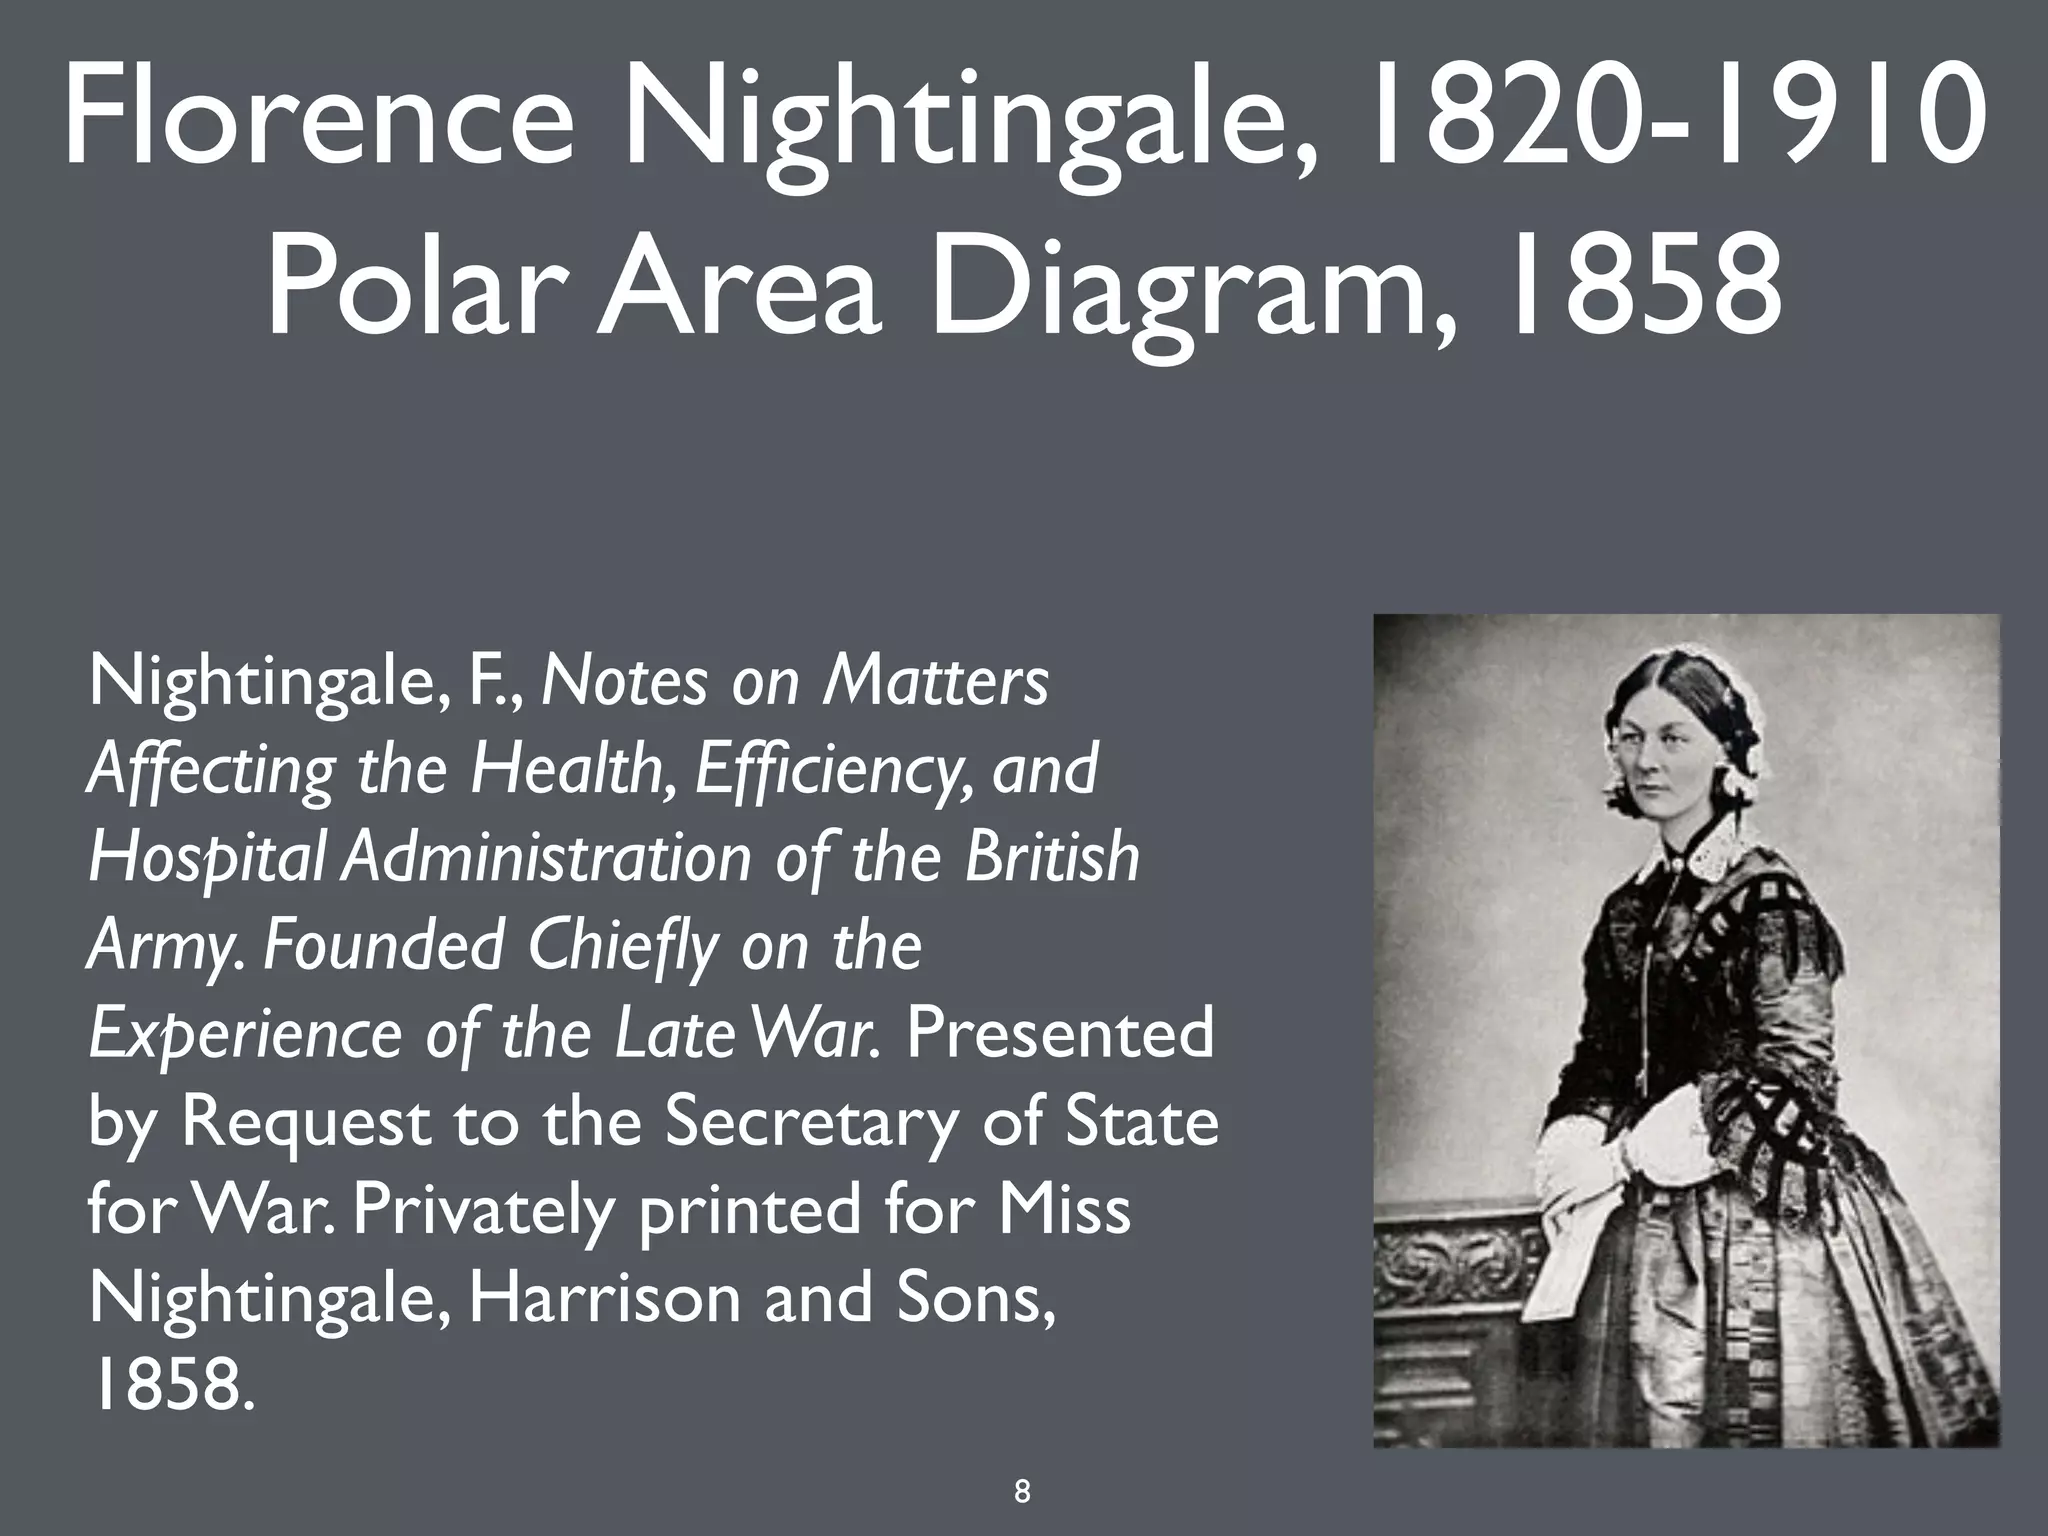
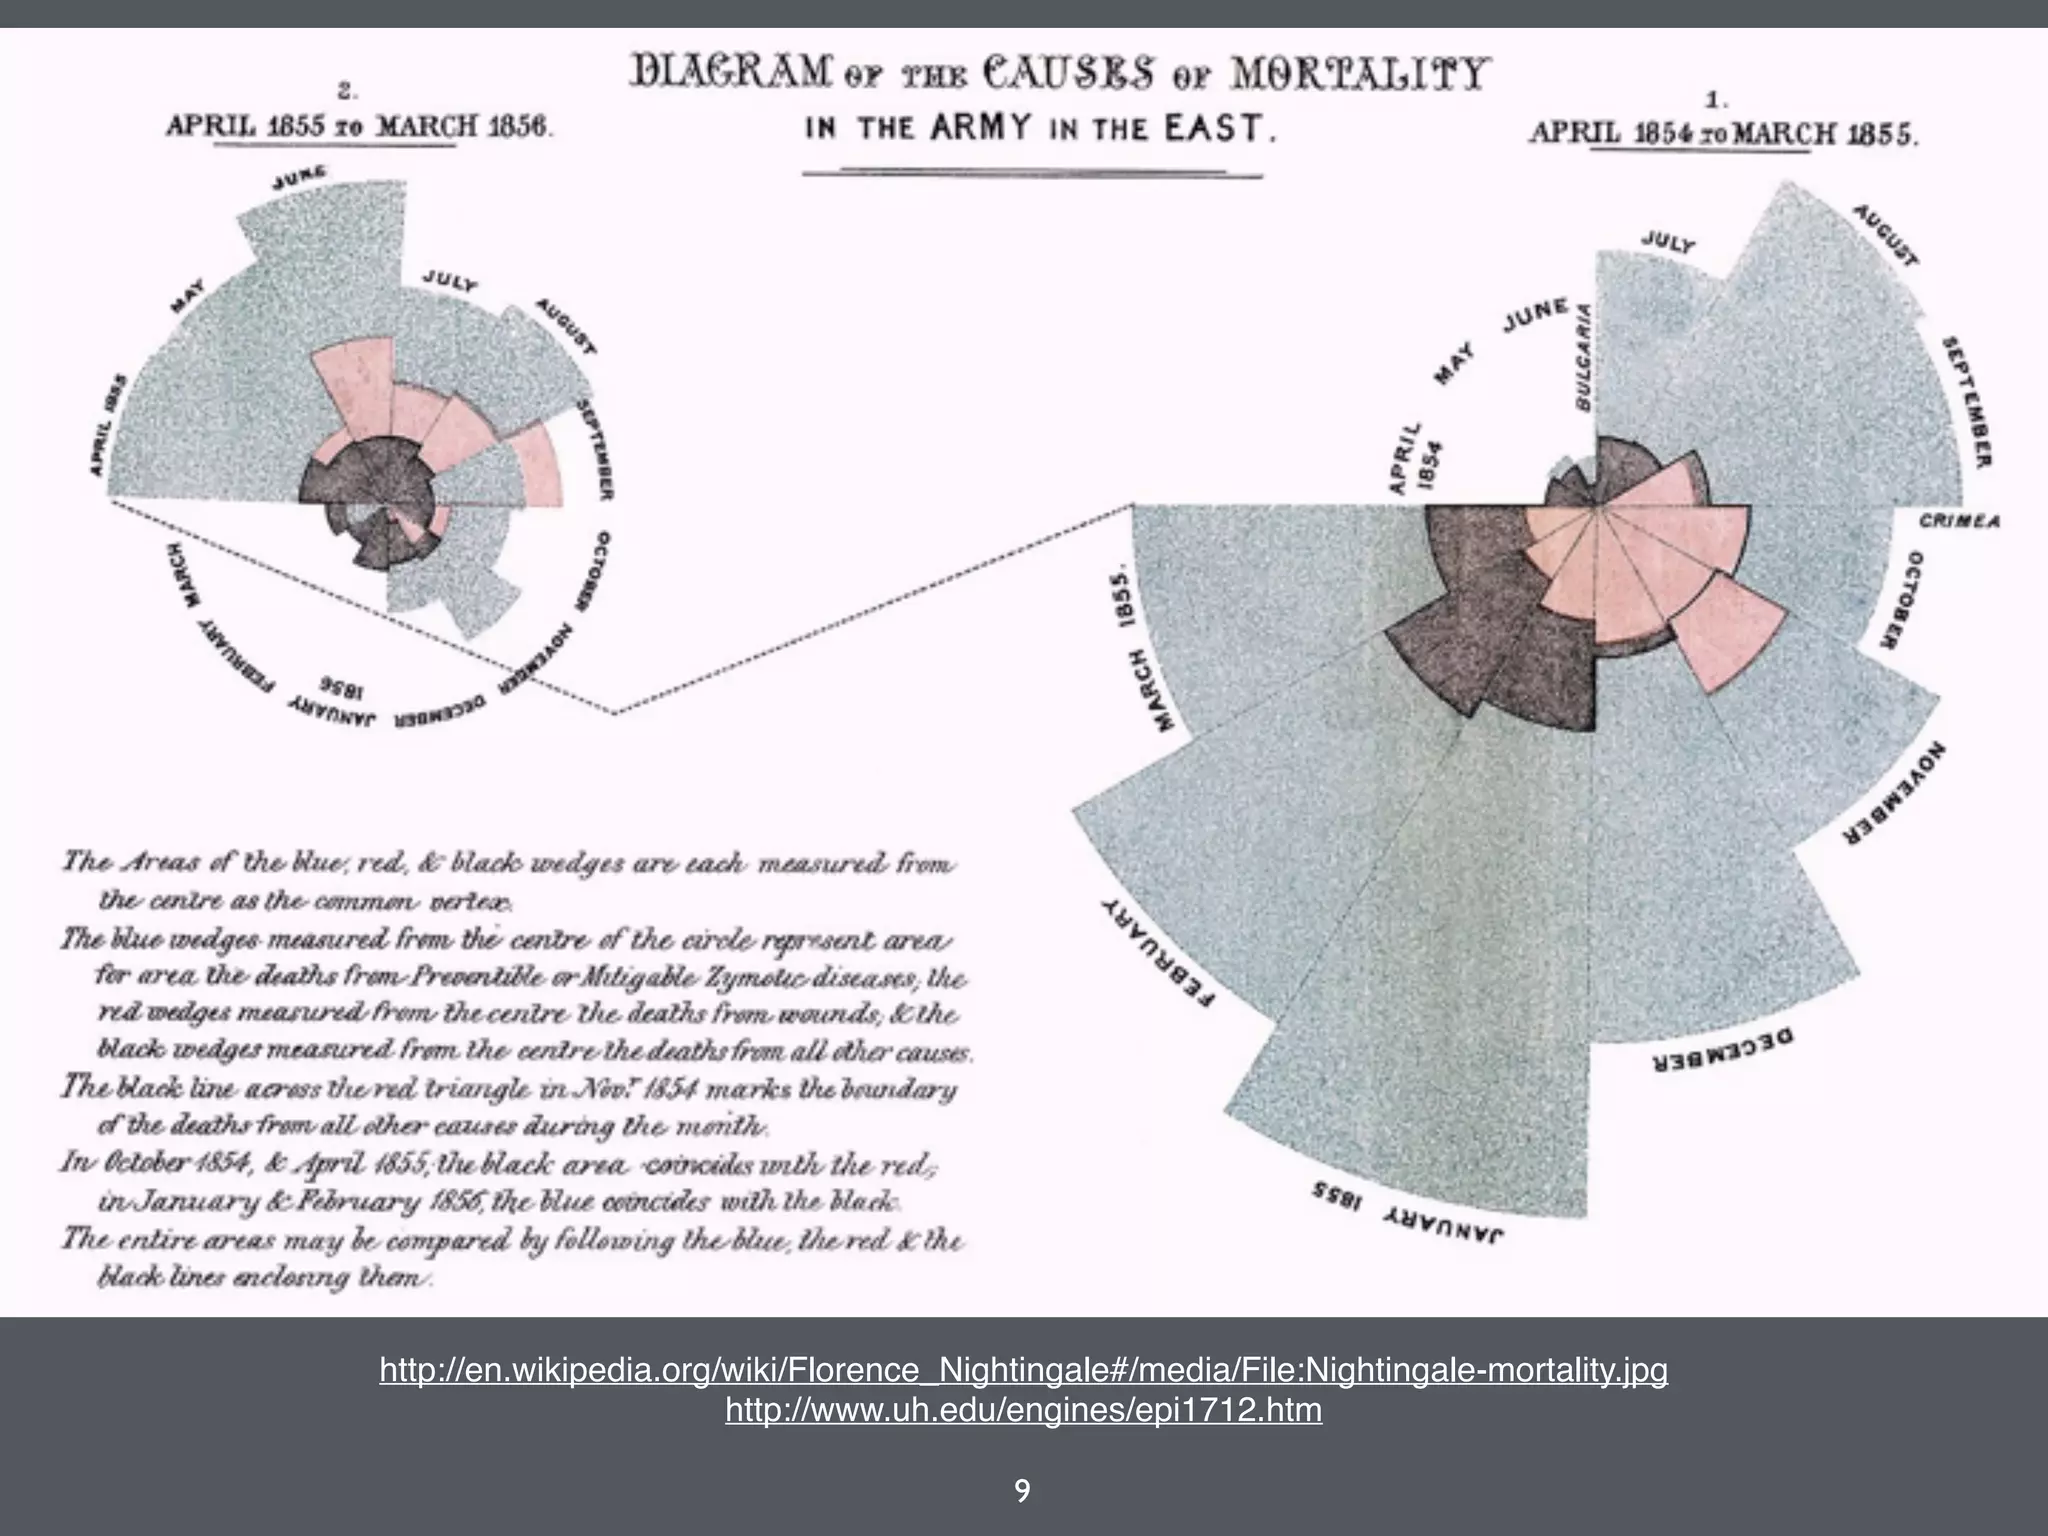
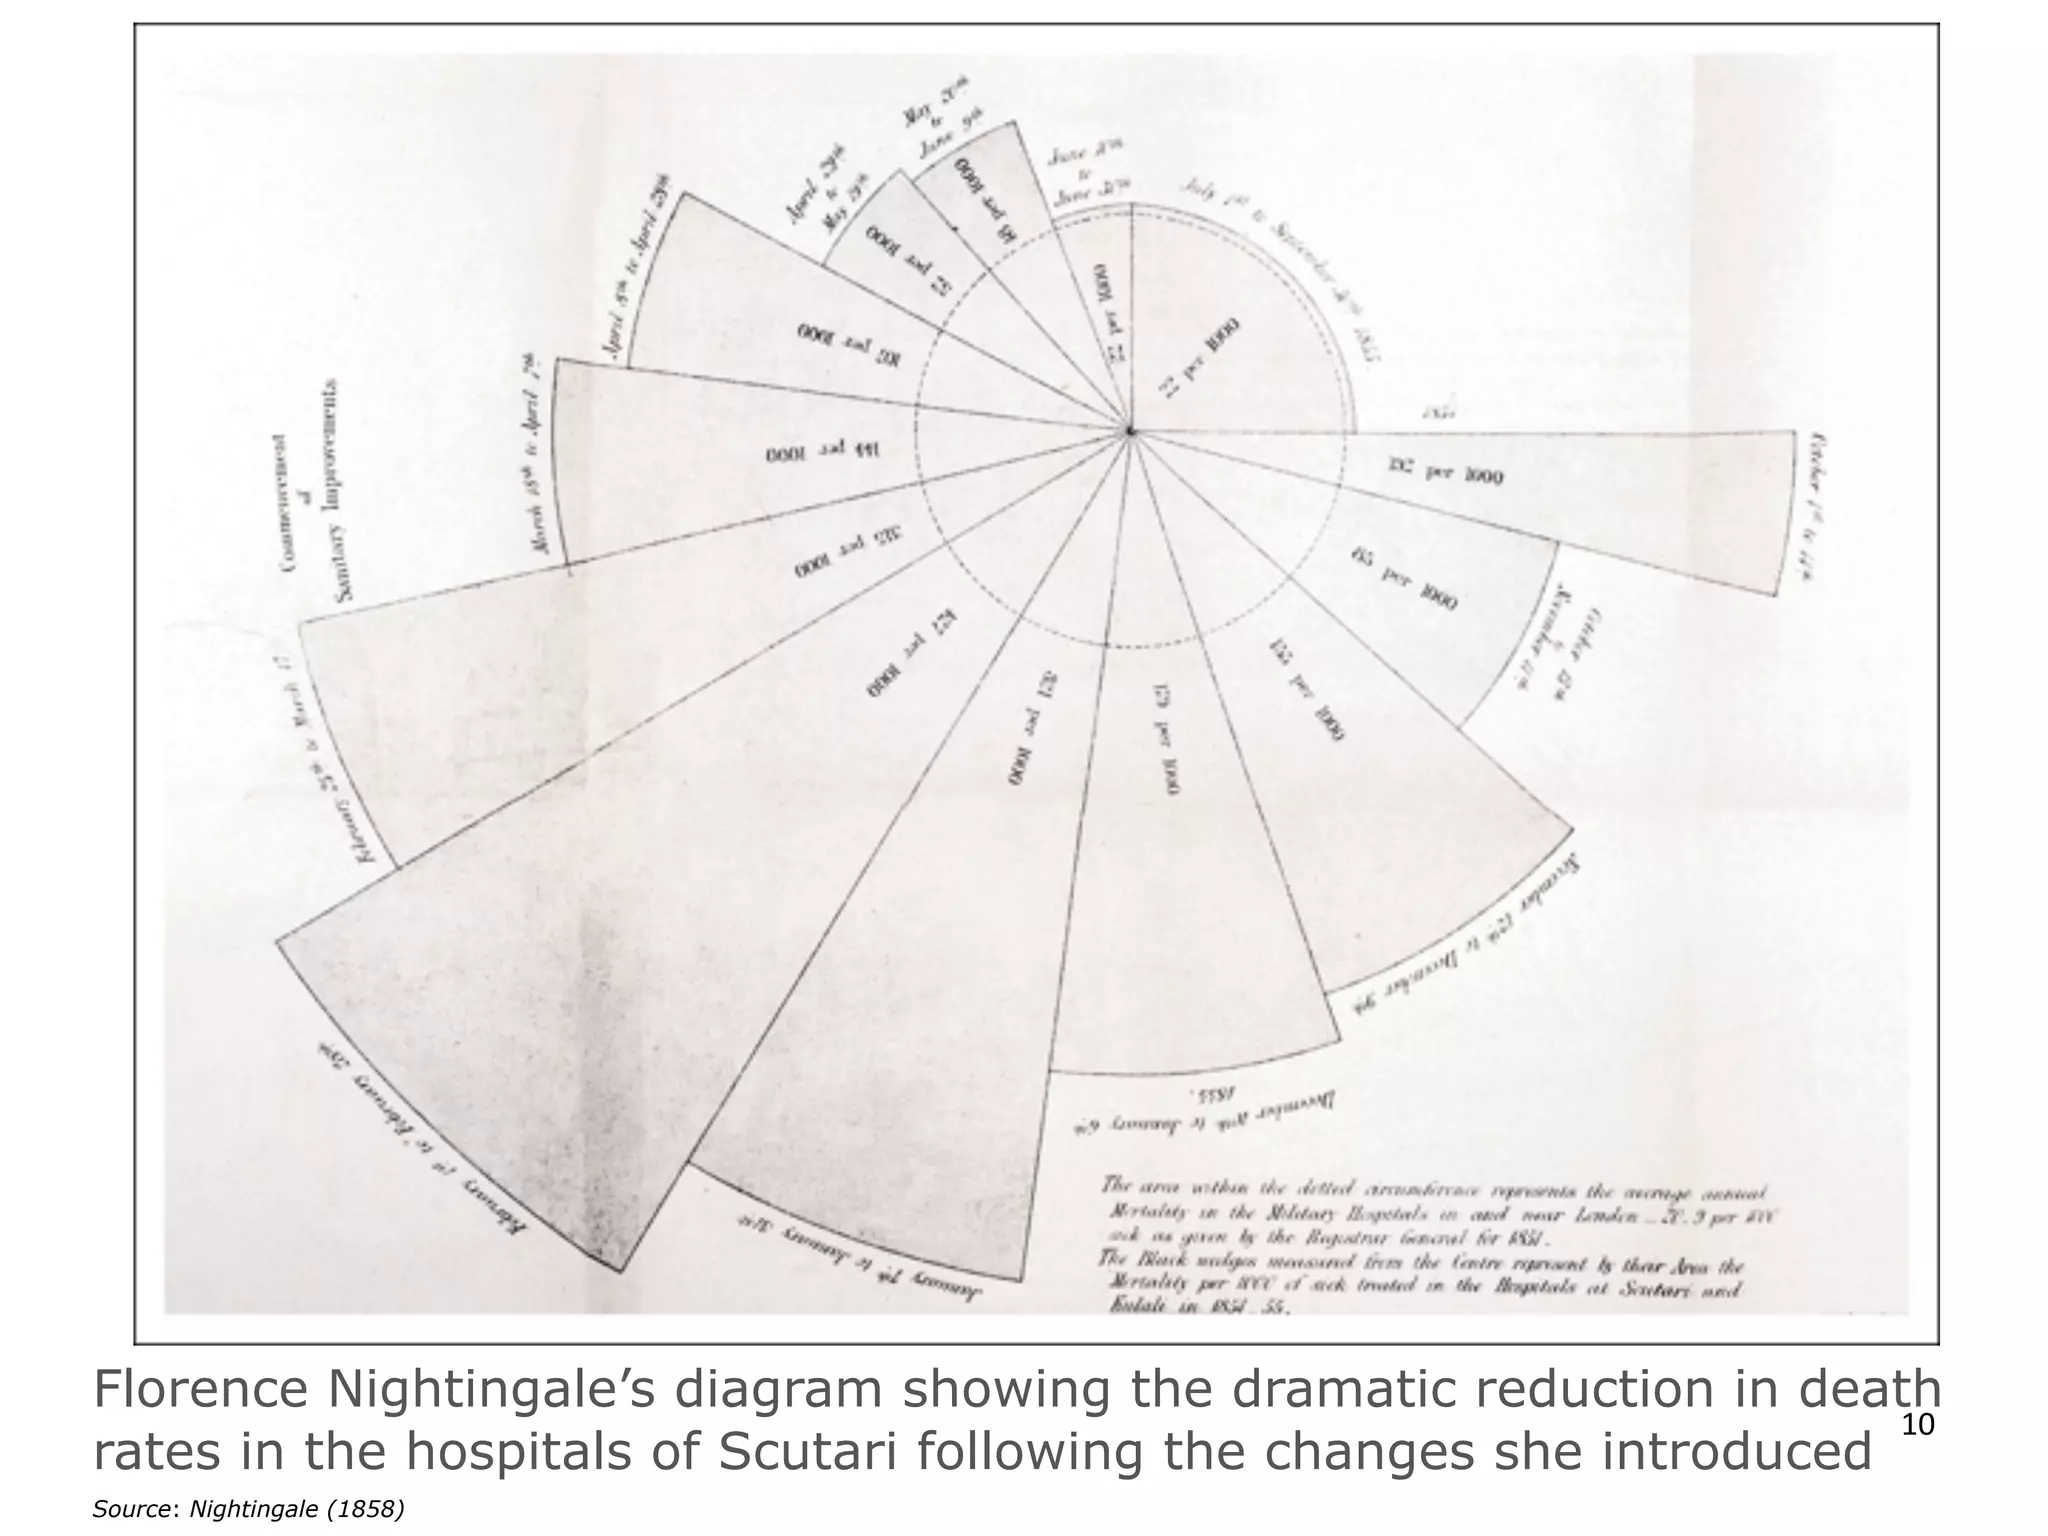
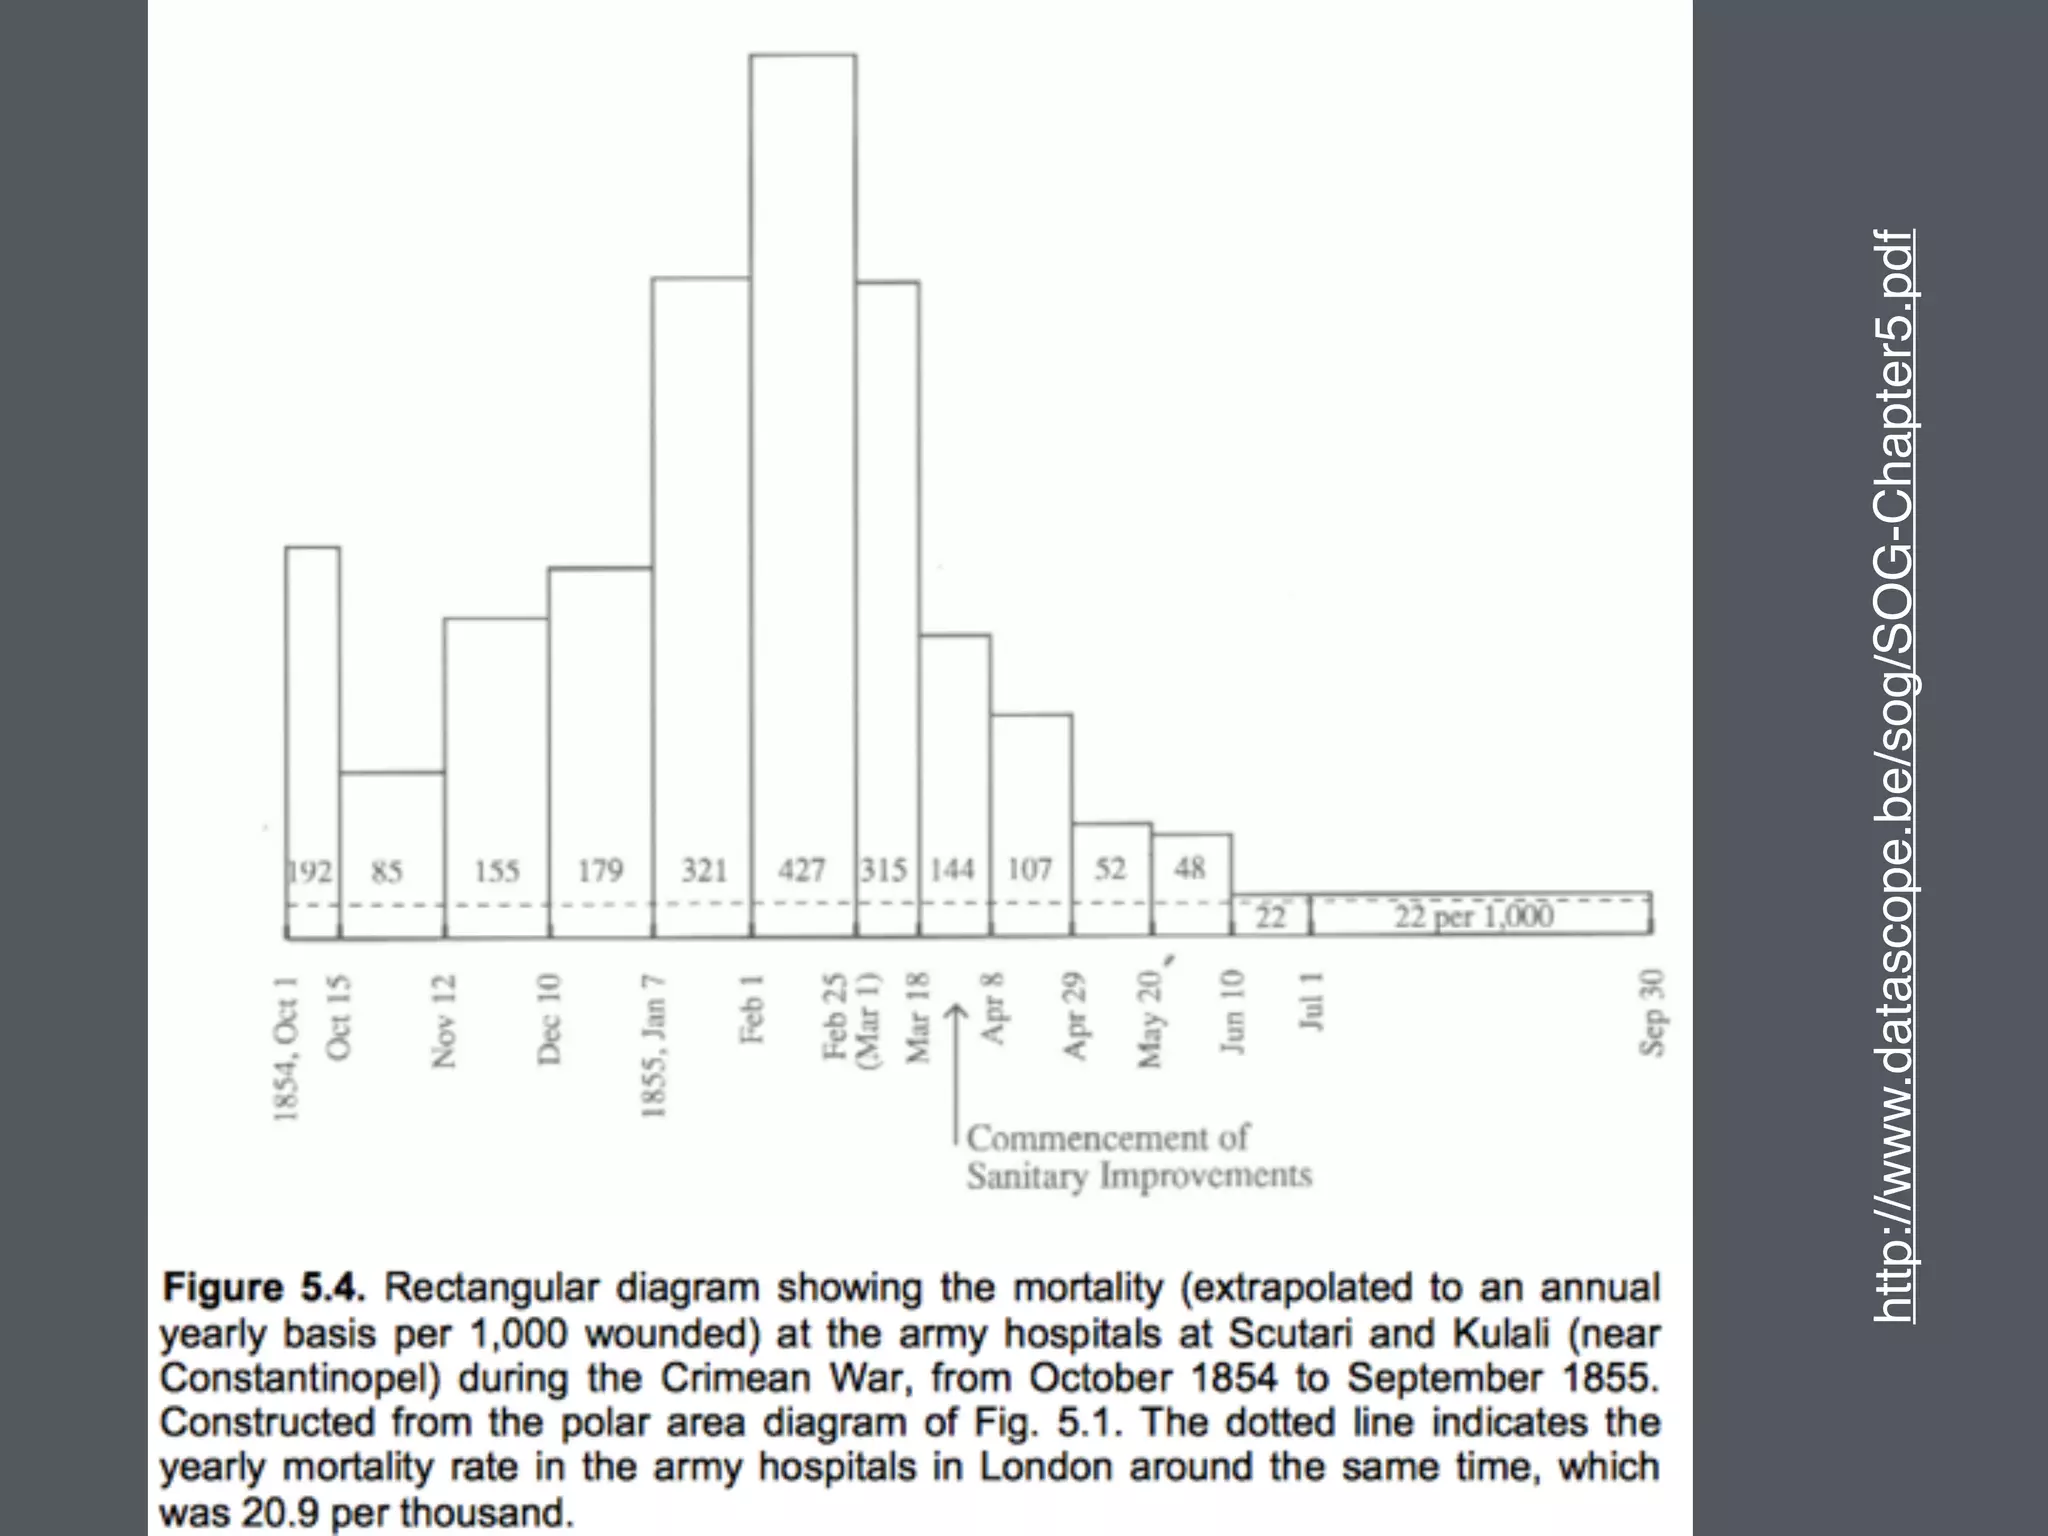
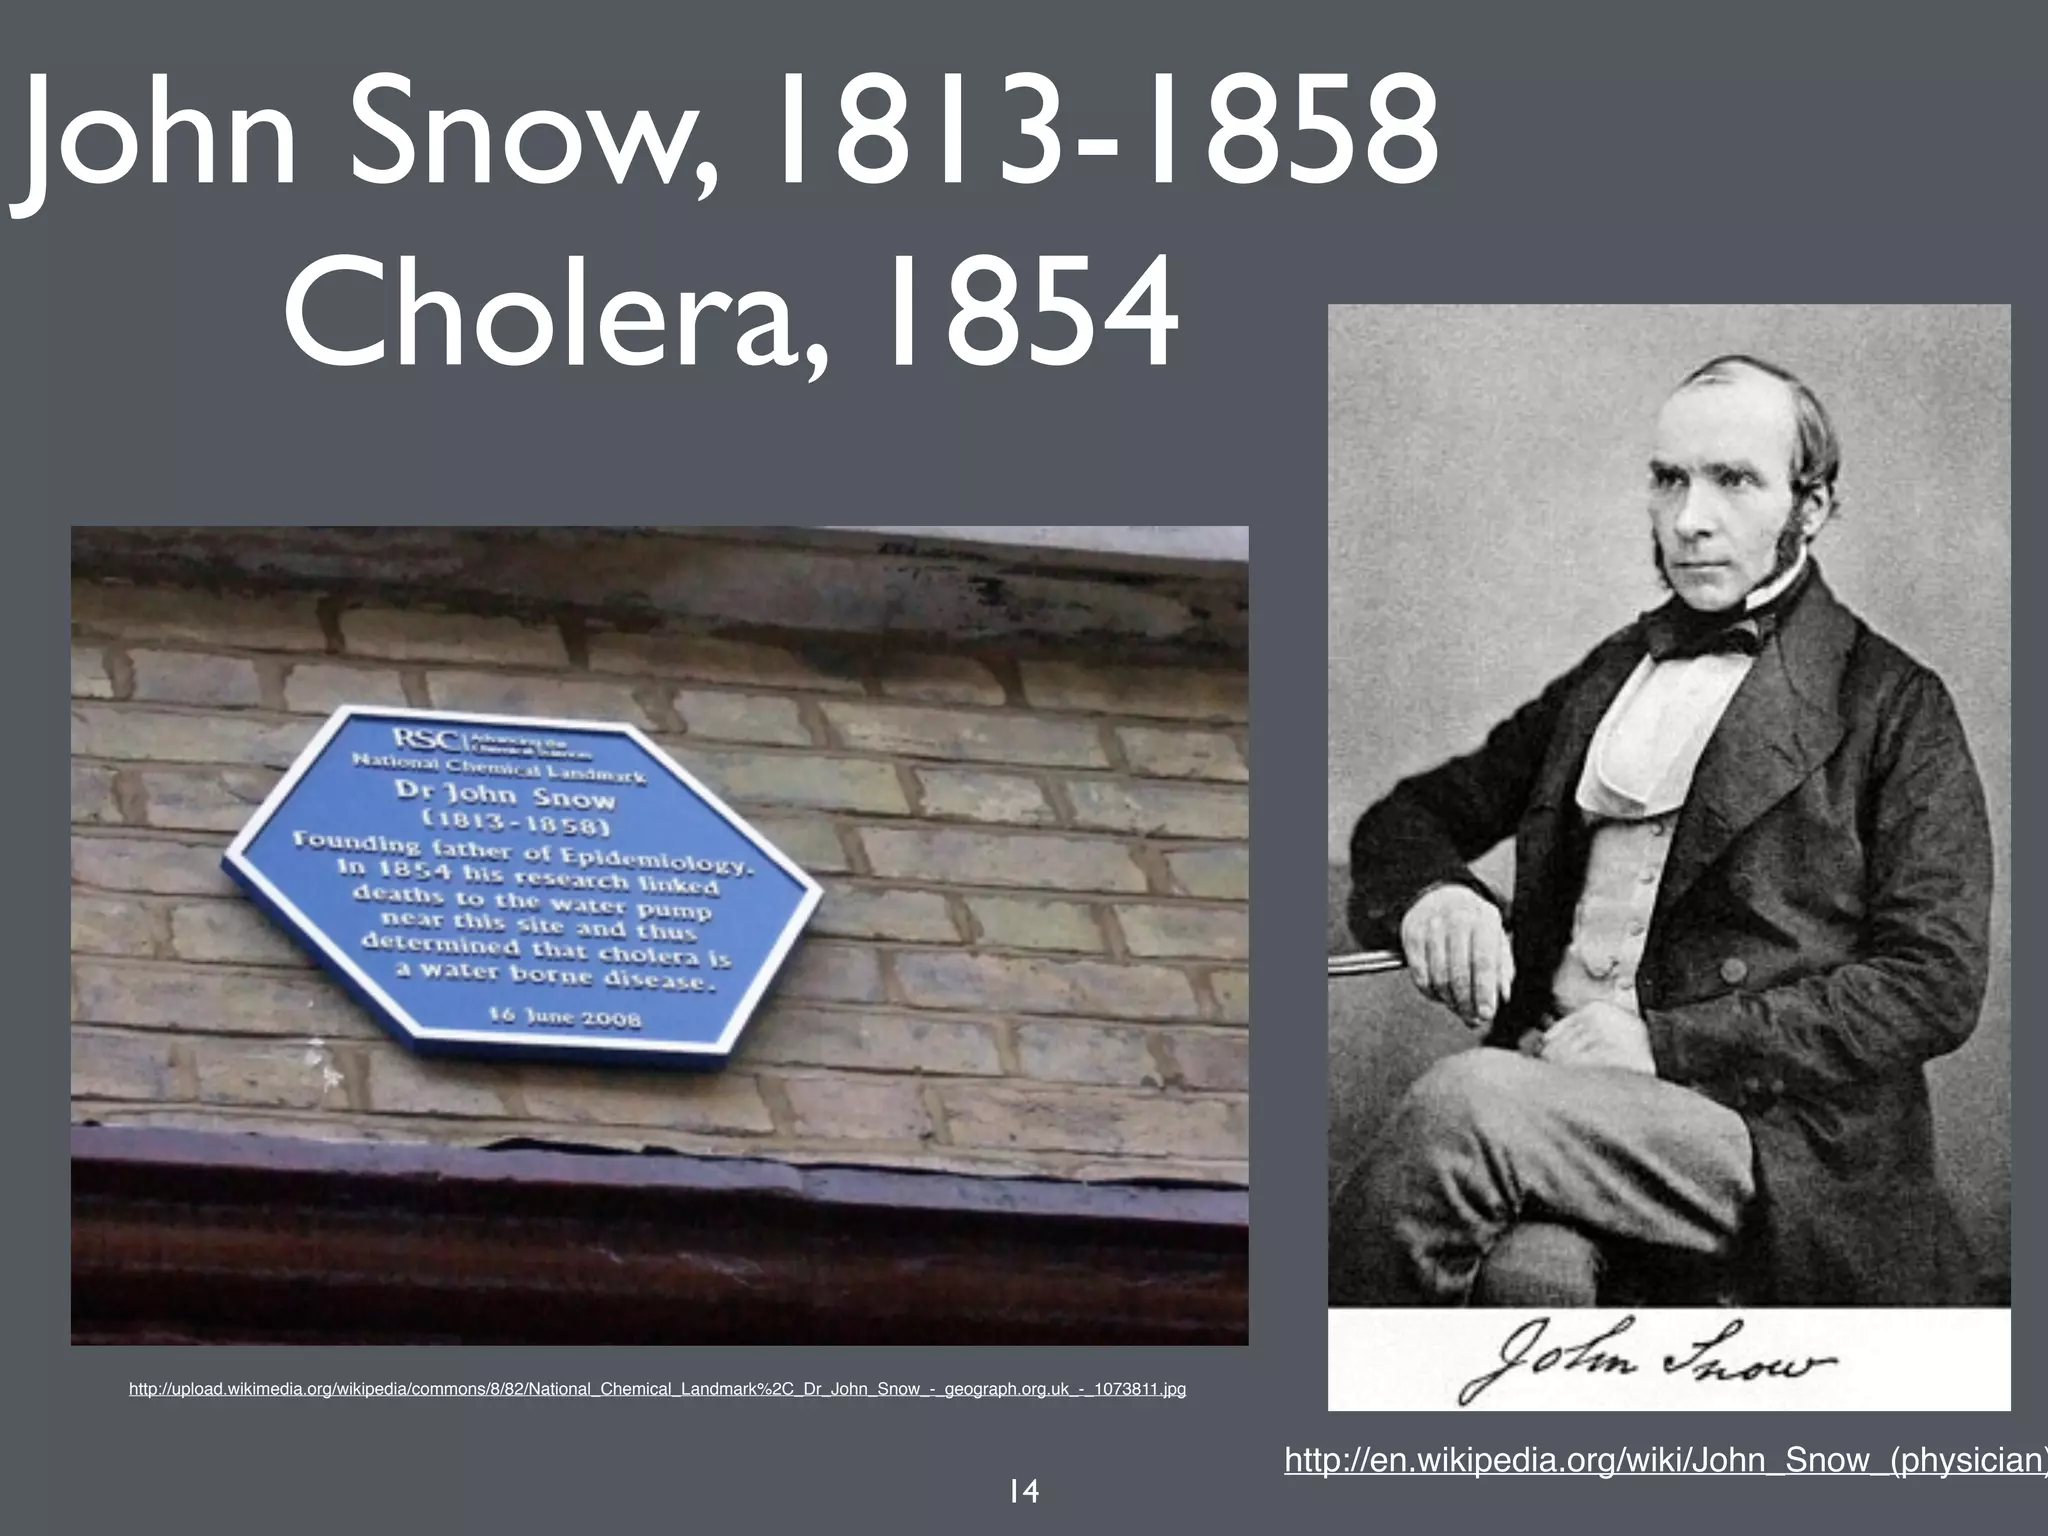
This document provides a short history of information visualization through examples of influential figures. It describes Charles Minard's visualization of Napoleon's 1812 campaign, William Playfair's creation of the line graph, bar chart and pie chart between 1786-1801, Florence Nightingale's polar area diagram in 1858 showing mortality rates in the Crimean War, John Snow's 1854 map showing clusters of cholera cases in London near a water pump, and Harry Beck's innovative 1933 diagram of the London Underground system. The document suggests these examples helped establish key foundations of the field of information visualization.