Download as PDF, PPTX


![Definition
28
Information Visualization is the use
of interactive visual representations
to amplify cognition [Card. et. al]](https://image.slidesharecdn.com/cursus-infovis-gent2016-les1-160613104923/85/Visualisatie-Module-3-Big-Data-28-320.jpg)

![Information Visualisation is the use
of interactive visual representations
to amplify cognition [Card. et. al]
Definition
30](https://image.slidesharecdn.com/cursus-infovis-gent2016-les1-160613104923/85/Visualisatie-Module-3-Big-Data-30-320.jpg)


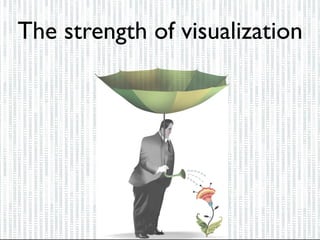


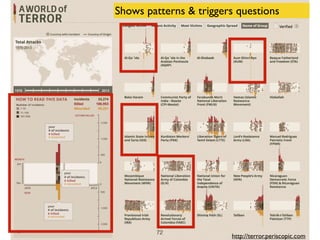


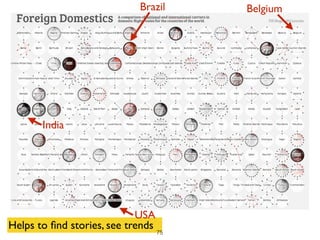


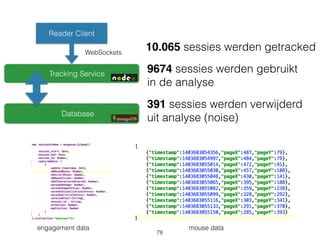


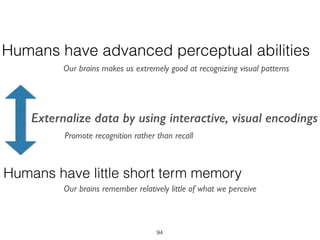


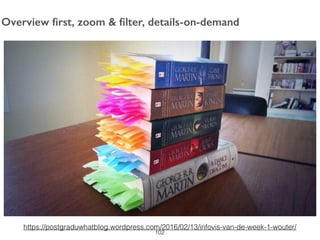


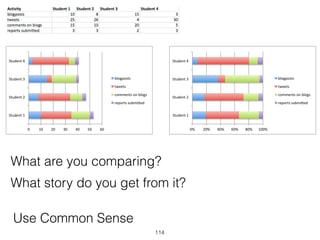


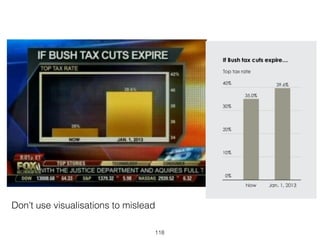


This document provides an overview of a post-academic course on Big Data taught by Joris Klerkx. It discusses the Augment group's mission to augment human intellect through tools and technologies. Their research focuses on capturing physiological and behavioral signals through sensors to create meaningful feedback loops. Application domains discussed include technology-enhanced learning, media consumption, science, and health. Guidelines for visualizing big data emphasize using interactive visual encodings to promote recognition over recall by humans. Interactivity, overview first approaches, and checking data quality are advised.


![Computing for Human Experience [v3, Aug-Oct 2010]](https://cdn.slidesharecdn.com/ss_thumbnails/che-aug2010-100905093348-phpapp01-thumbnail.jpg?width=640&height=640&fit=bounds)


![ICVRV_161[170]](https://cdn.slidesharecdn.com/ss_thumbnails/3cd64fb1-2ec7-4fee-bad1-18ca0ddae4c4-161025140048-thumbnail.jpg?width=640&height=640&fit=bounds)


