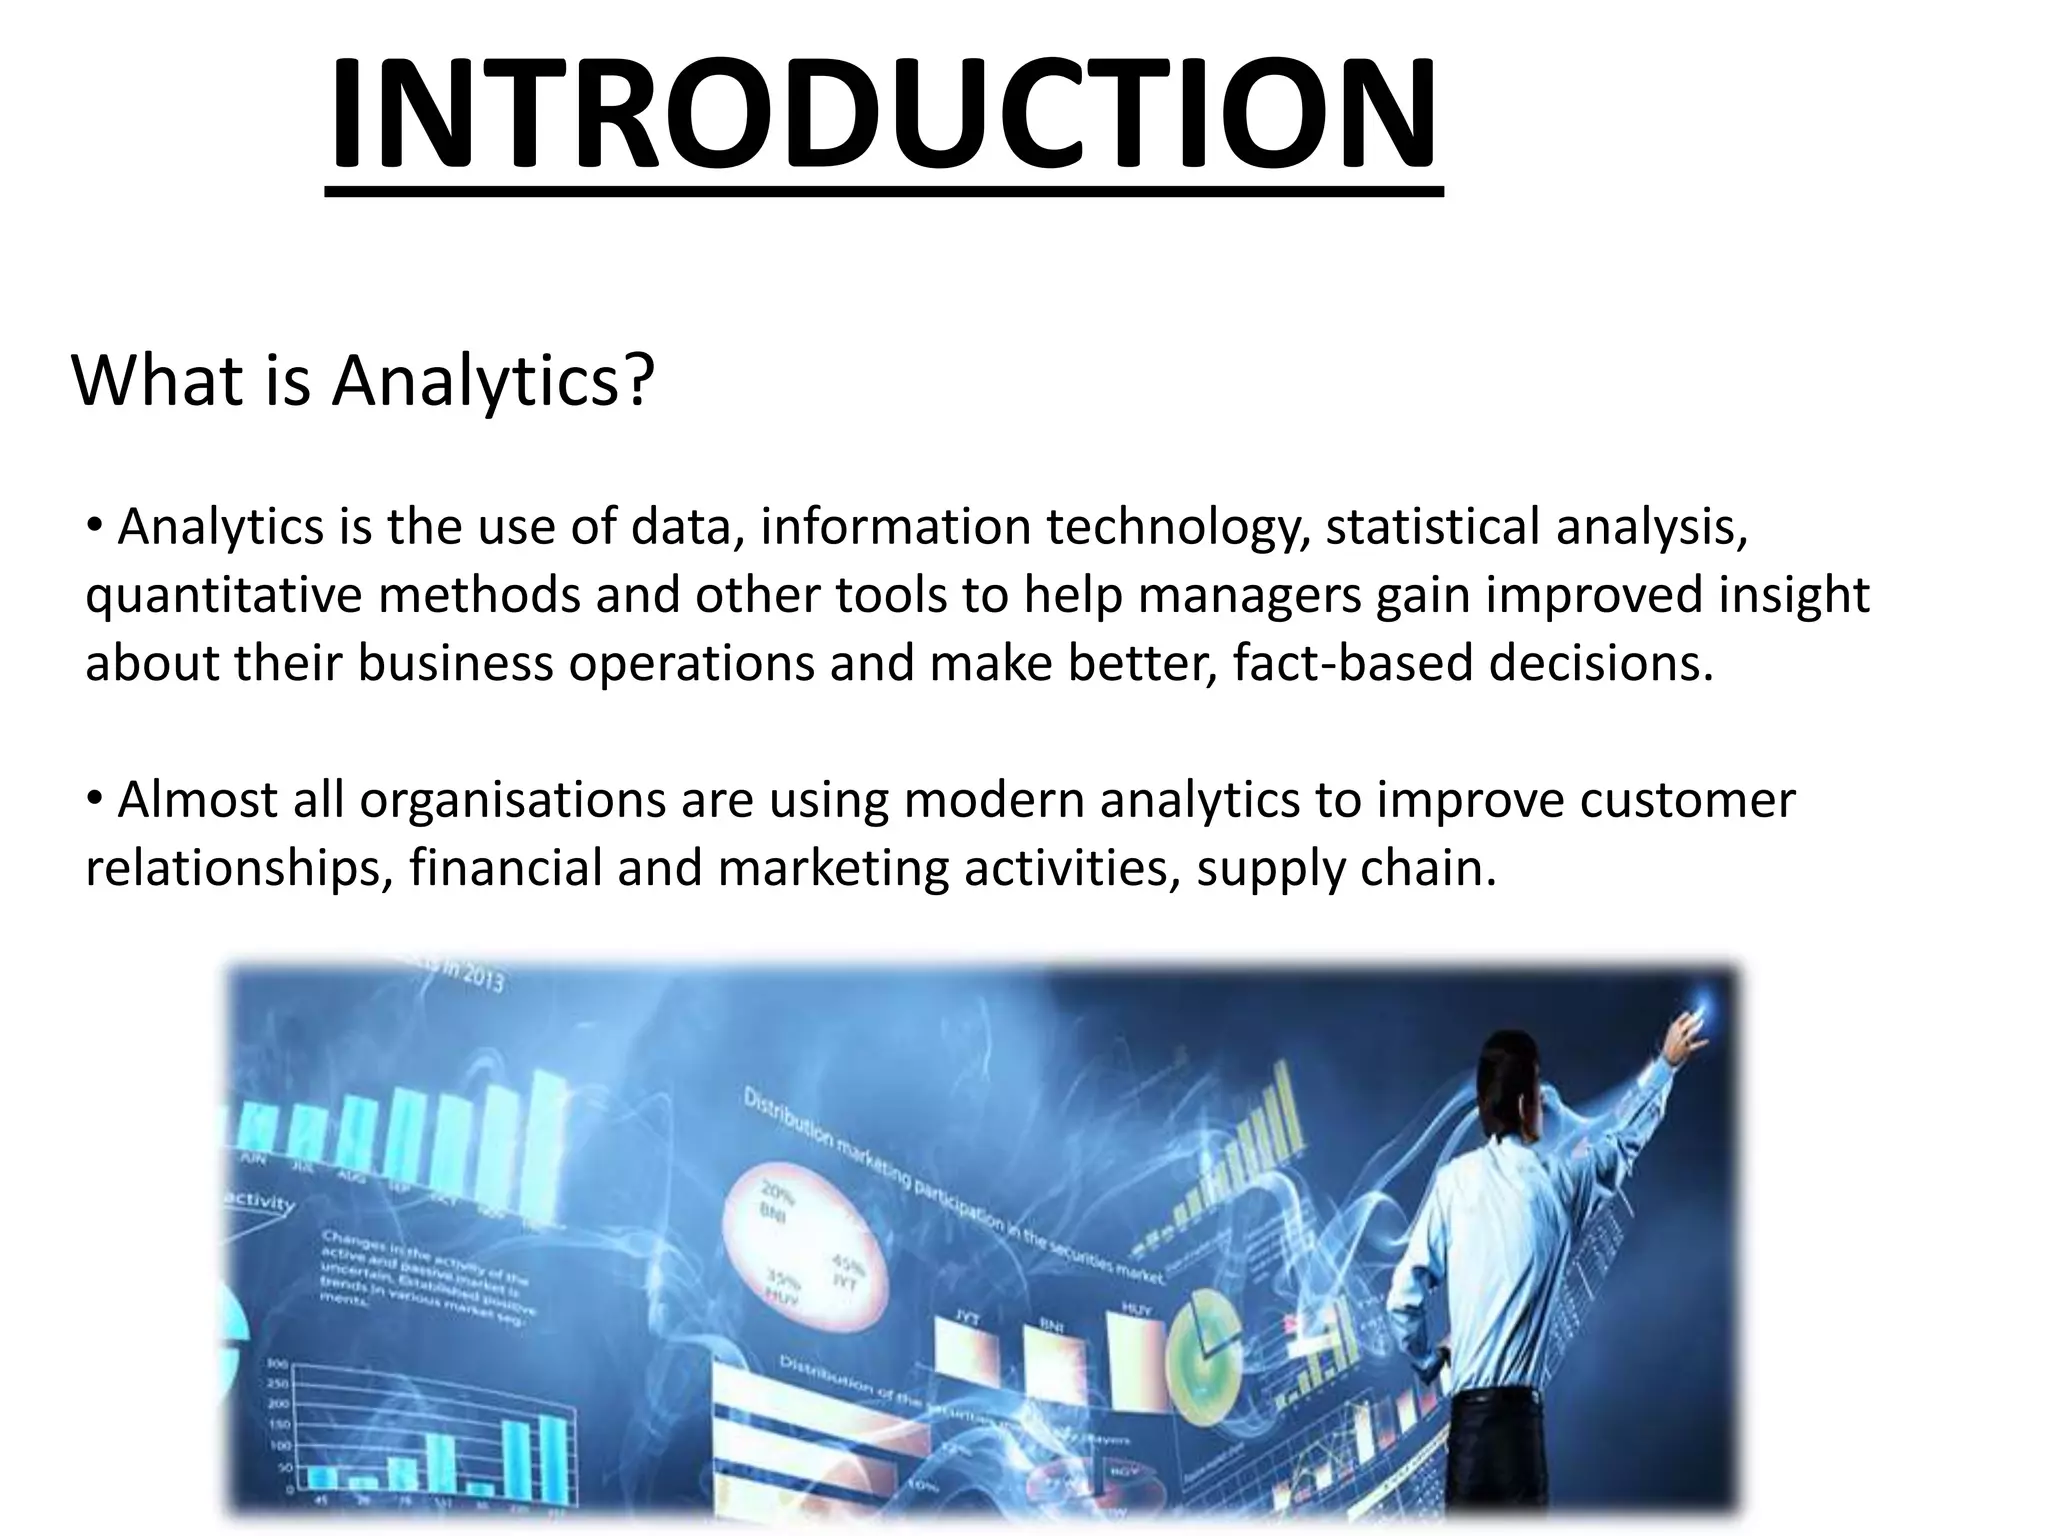
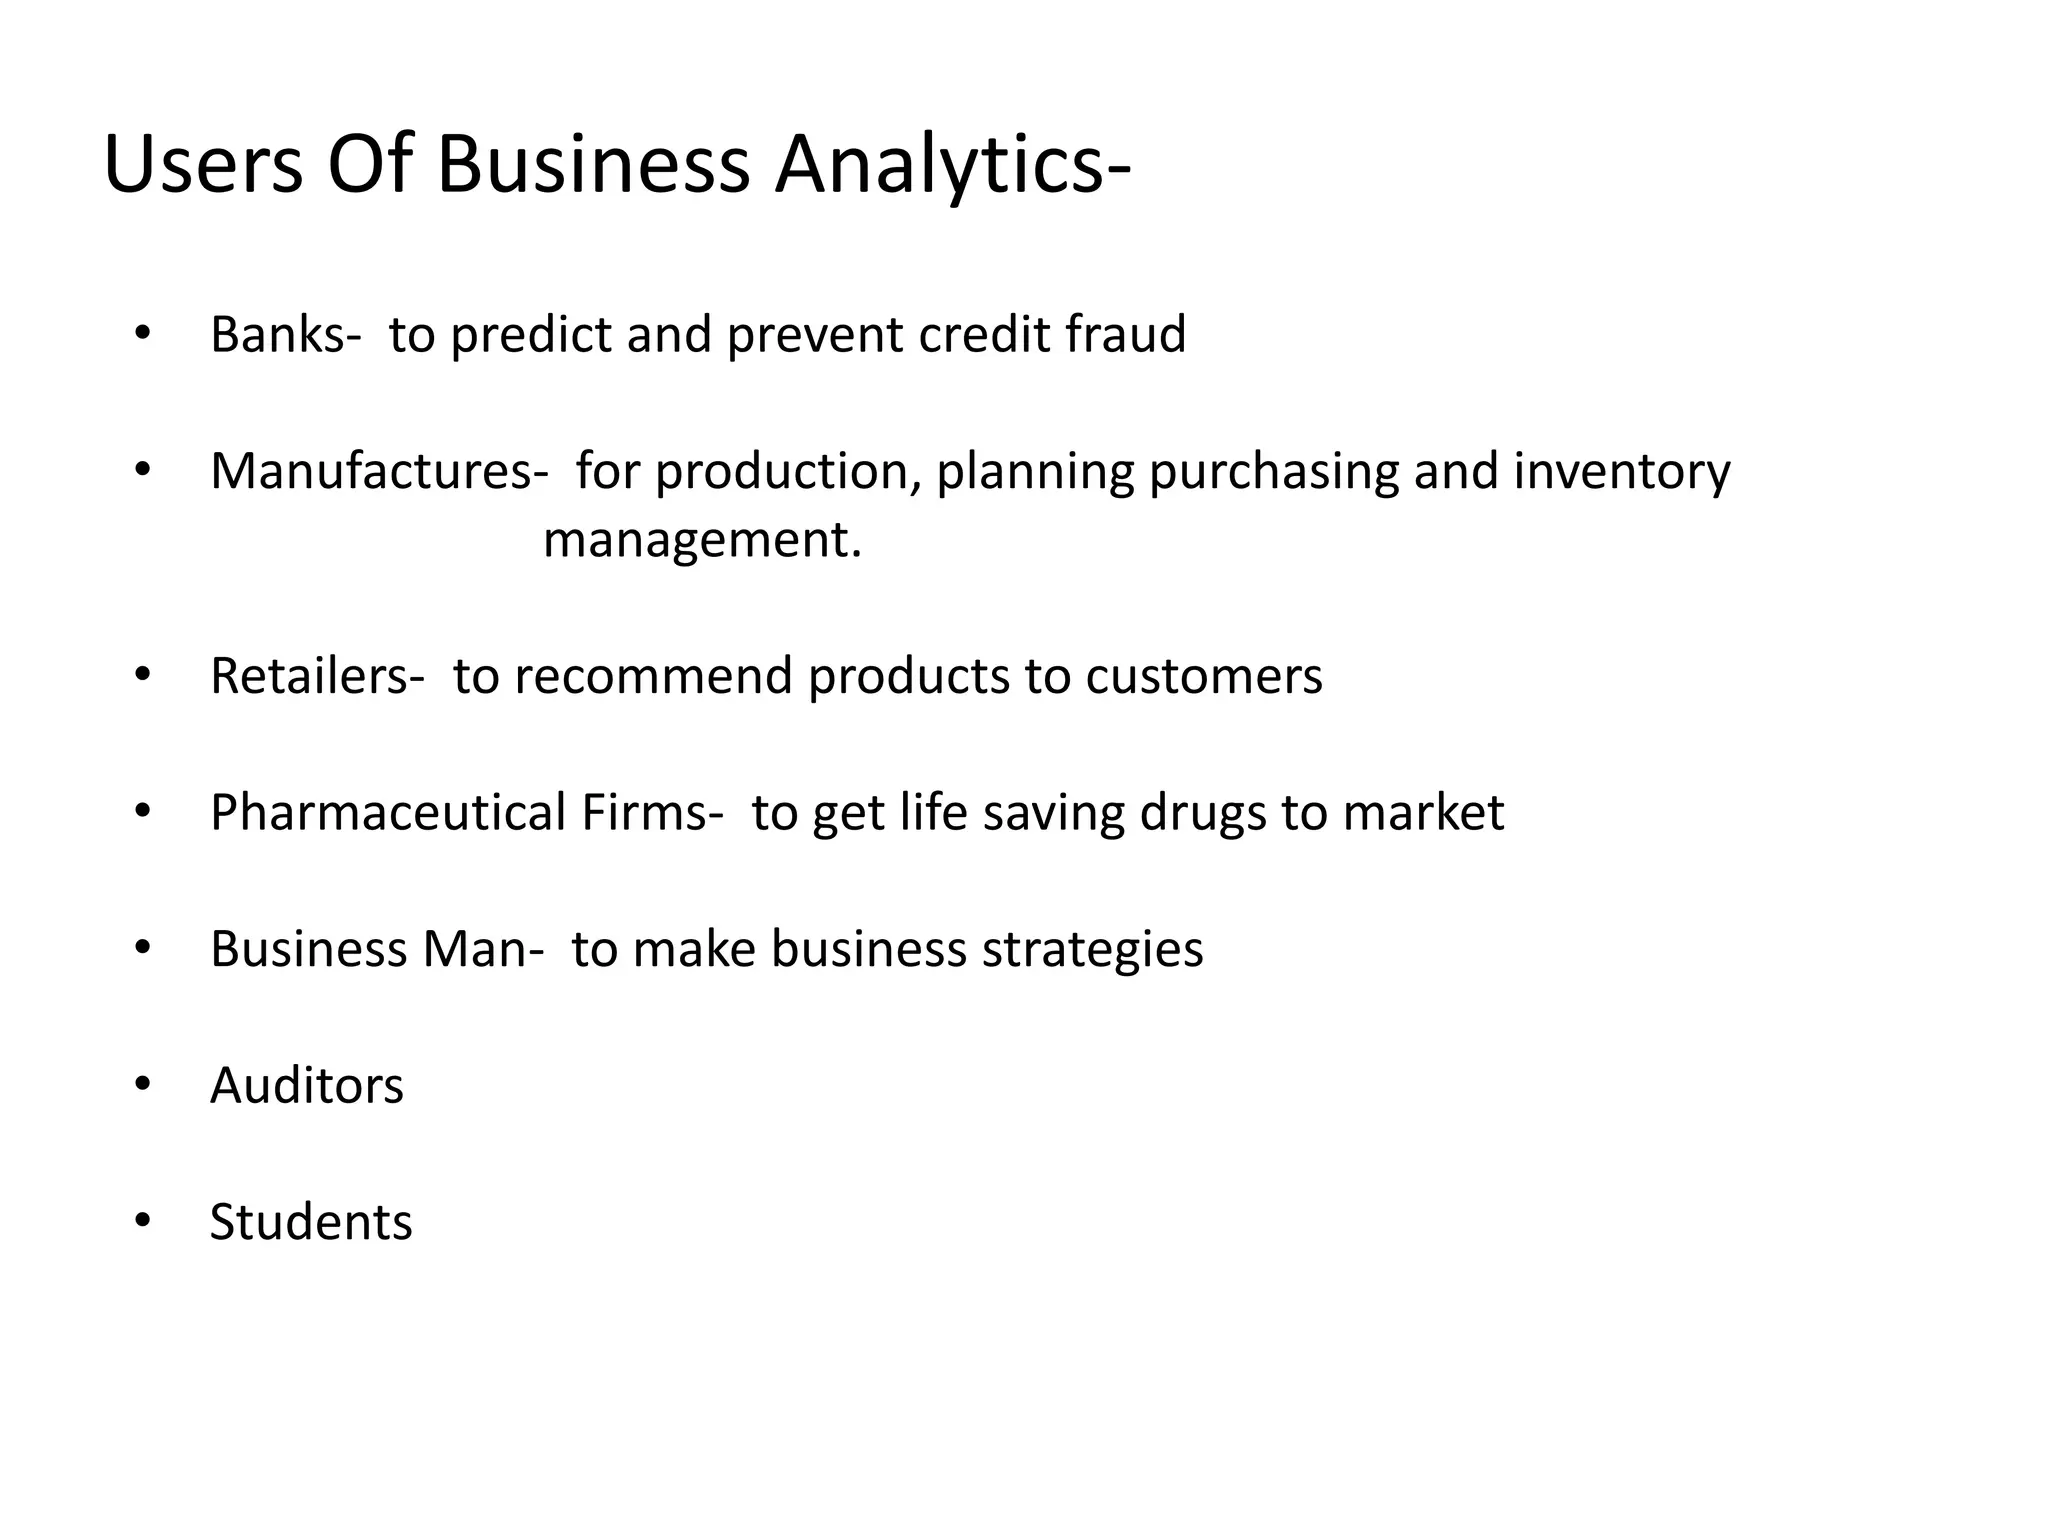
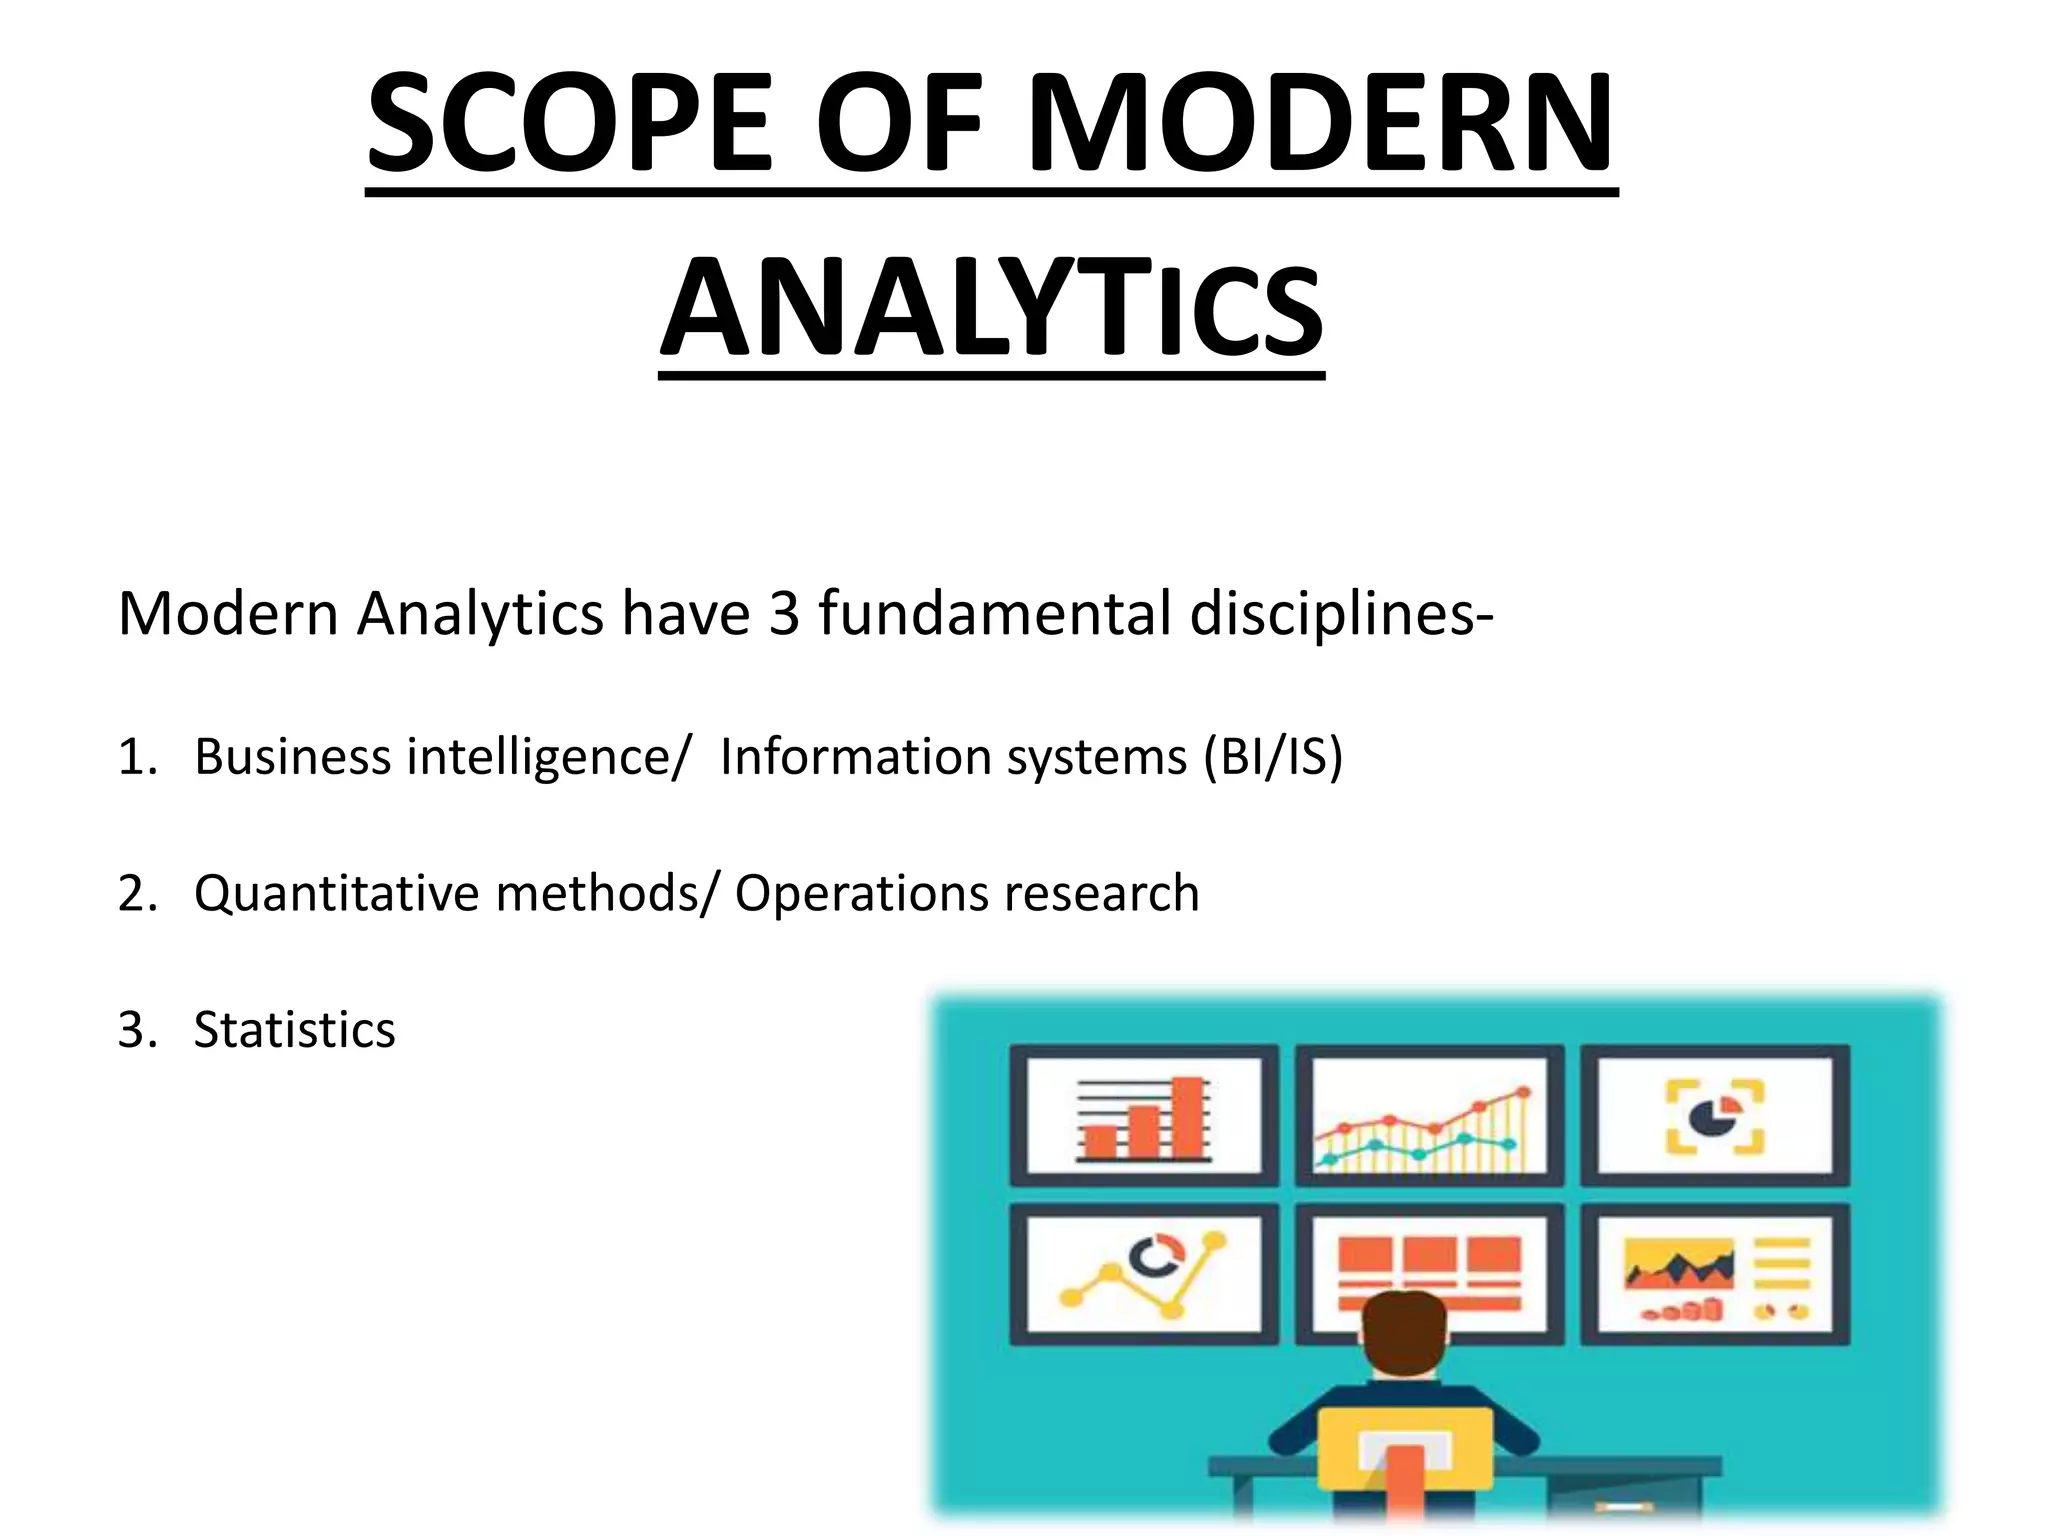
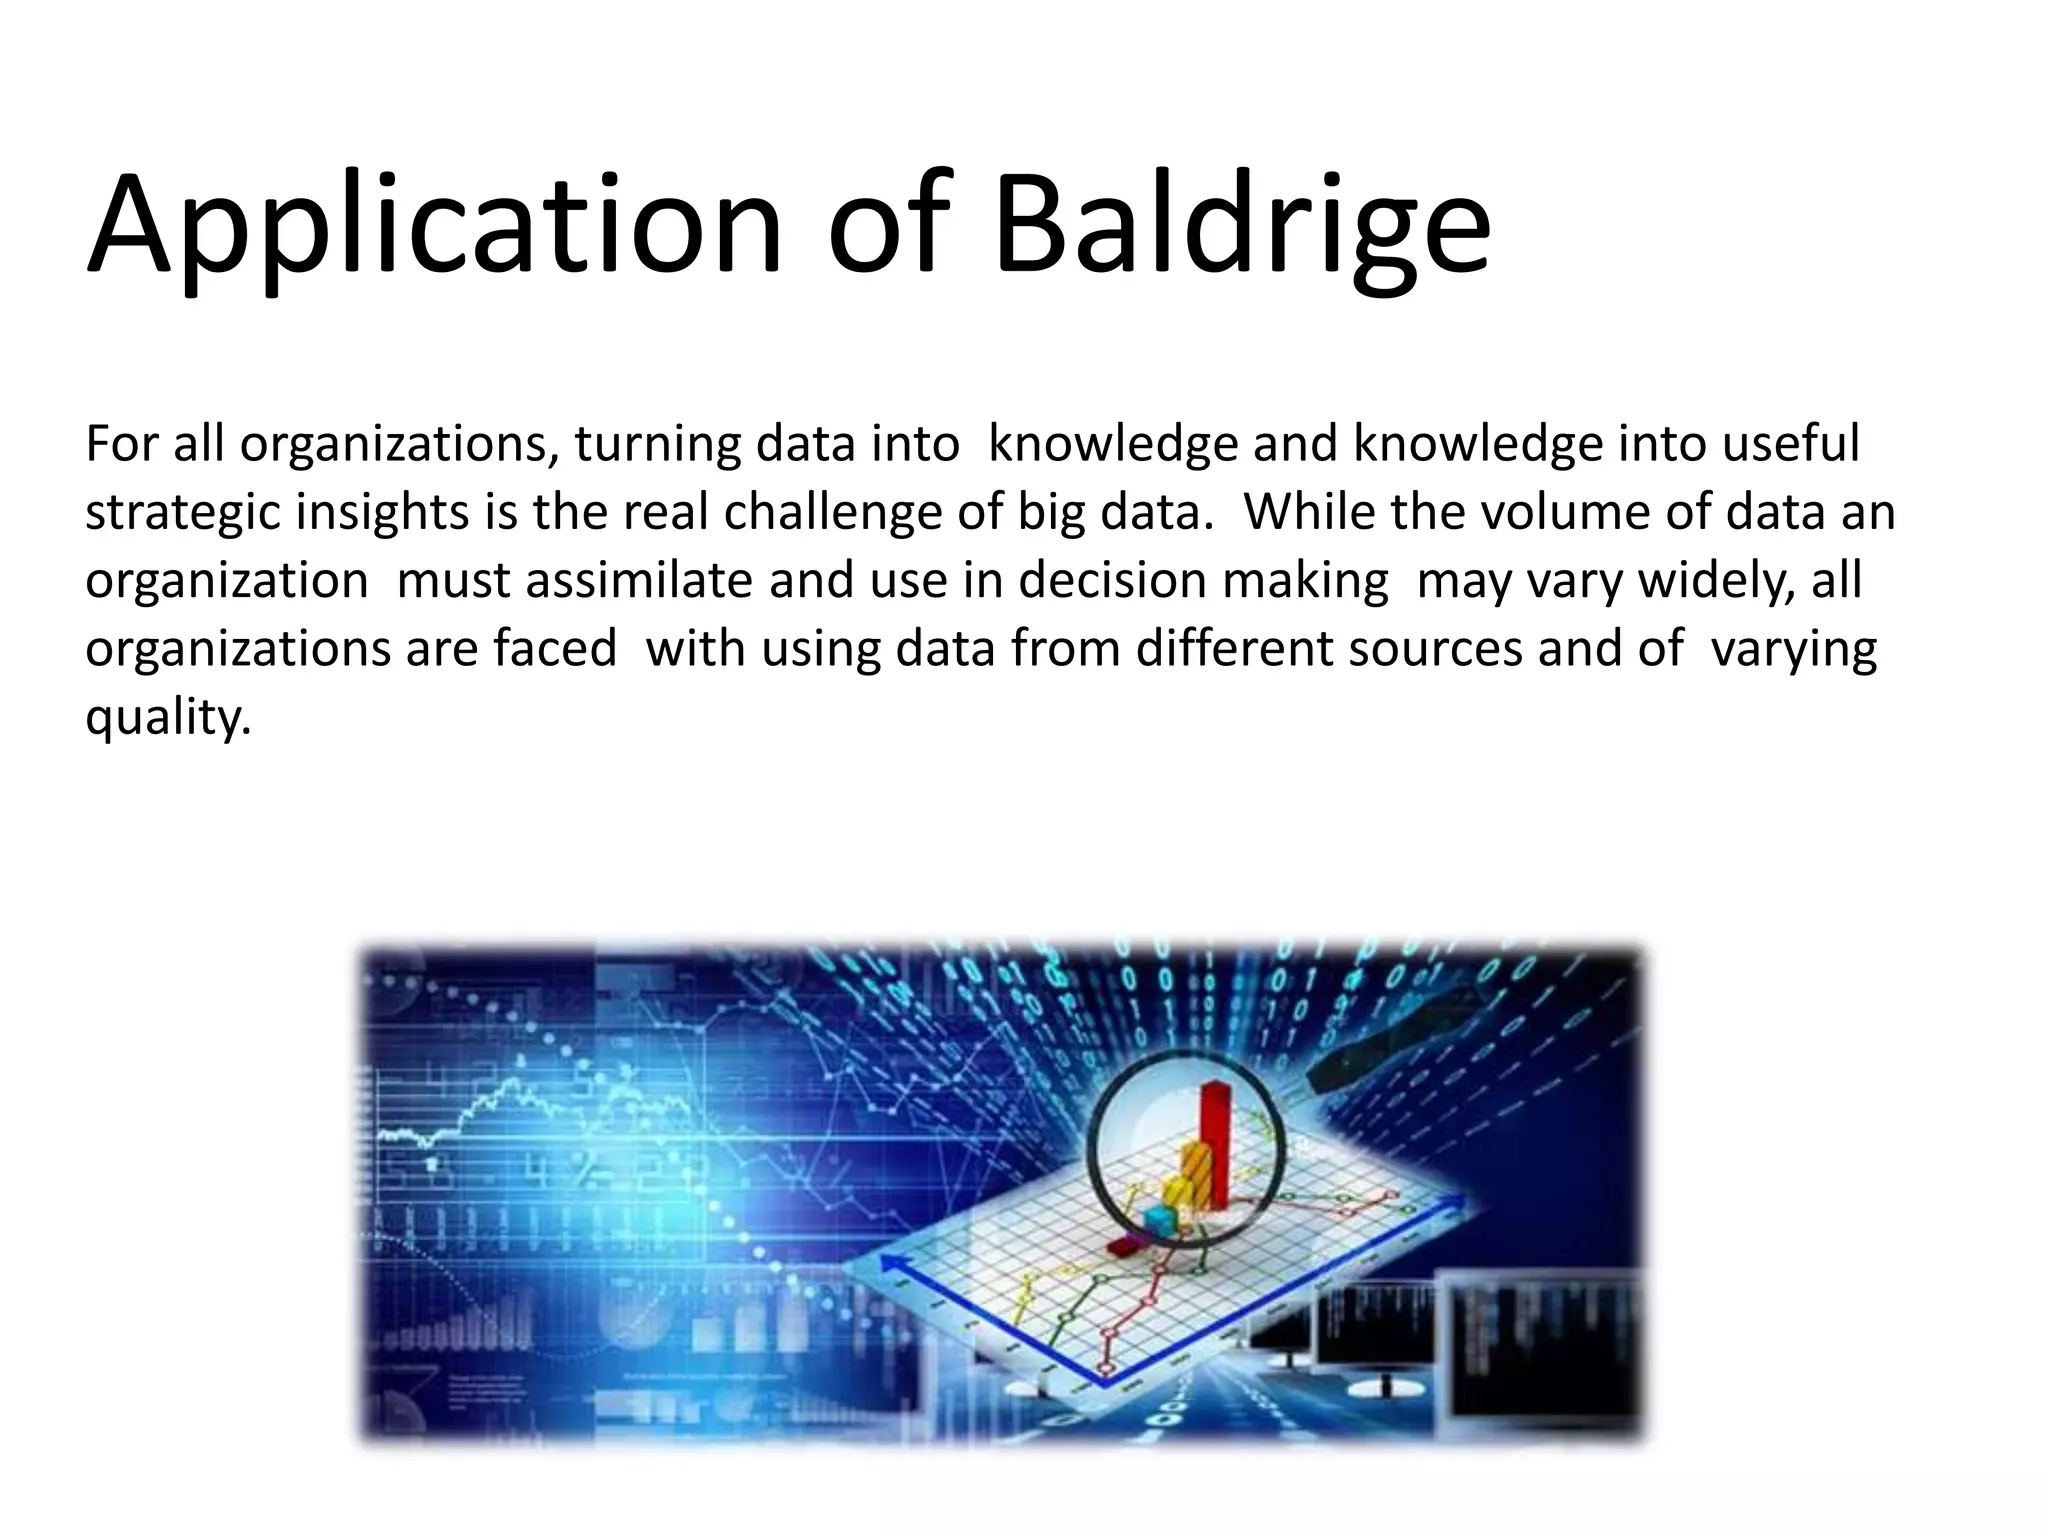
Modern Analytics And The
Future Of Quality And
Performance Excellence
IBS
GURGAON
INTRODUCTION
What is Analytics?
• Analytics is the use of data, information technology, statistical analysis,
quantitative methods and other tools to help managers gain improved insight
about their business operations and make better, fact-based decisions.
• Almost all organisations are using modern analytics to improve customer
relationships, financial and marketing activities, supply chain.
Users Of Business Analytics-
• Banks- to predict and prevent credit fraud
• Manufactures- for production, planning purchasing and inventory
management.
• Retailers- to recommend products to customers
• Pharmaceutical Firms- to get life saving drugs to market
• Business Man- to make business strategies
• Auditors
• Students
Tools Used For Business Analytics
MS Excel- It is a spreadsheet application developed by Microsoft. It
features calculation, graphing tools, pivot tables and a macro
programming language called visual basic.
SPSS- SPSS Modeller is a data mining software tool by SPSS Inc., an IBM
company. It was originally named SPSS Clementine. It is a software used
for Statistical Analysis.
R- It is a programming language and software environment for
statistical computing and graphics. The R language is an open source
tool and is widely used by the academia.
ORIGIN OF BUSINESS
ANALYTICS
• The term was first used by H. P. Luhn in an article entitled “A Business
Intelligence System,” published in an IBM research journal in 1958.
• Work done throughout this period was focused on technologies, standards,
processes and tools to support the collection, storage rationalization and
retrieval of data and the creation of reports.
• Statistical methods include the basic tools of description, exploration,
estimation, and inference, as well as more advanced techniques like
regression, forecasting, and data mining.
History-
• Technology did not advance to the point where it could be considered an
agent of business analytics until well into the 20th century.
• It was with the 1958 publication of a landmark article on the subject,
written by IBM computer scientist Hans Peter Luhn, that the potential of
BI was recognized.
• With the advent of computers in the business world, companies finally
had an alternative to storing data on paper.
• IBM’s invention of the hard disk in 1956 revolutionized data storage.
Floppy discs, laser discs, and other storage technologies meant that just as
more and more data was being created, so too were there more and more
places to store it.
• As business intelligence became a commonly known phrase in the late
1990’s and early 2000’s, dozens of new vendors hit the market.
• Statistical methods include the basic tools of description, exploration,
estimation, and inference, as well as more advanced techniques like
regression, forecasting, and data mining.
• Many operation research and management system applications use
modelling and optimization to find the best solutions and decision.
• Decision support systems (DSS) began
to evolve in the 1960s by combining
business intelligence concepts with
OR/MS models to create analytical-
based computer systems to support
decision making
SCOPE OF MODERN
ANALYTICS
Modern Analytics have 3 fundamental disciplines-
1. Business intelligence/ Information systems (BI/IS)
2. Quantitative methods/ Operations research
3. Statistics
Modern analytics is often characterized from three
perspectives-
1. Descriptive analytics- The use of data to understand past and current
performance and make informed decisions. Descriptive analytics summarizes data
into meaningful charts and reports, for example, about budgets, sales, revenues,
or cost.
2. Predictive analytics- Analyzing past performance in an effort to predict the
future by examining historical data, detecting patterns or relationships in these
data, and then extrapolating these relationships forward in time.
3. Prescriptive analytics- Using optimization to identify the best alternatives
to minimize or maximize some objective. The mathematical and statistical
techniques of predictive analytics can also be combined with optimization to
make decisions that take into account the uncertainty in the data
• Modern analytics is often associated with “big data.” Big data provide
an opportunity for organizations to gain a competitive advantage—if the
data can be understood and analyzed effectively to make better
decisions.
• Big data come from many sources, and can be numerical, textual, and
even audio and video data.
• Big data are captured using sensors, click streams from the Web,
customer transactions, emails, tweets and social media, and other ways.
• Processes such as fraud detection must be analyzed quickly to have
value.
ANALYTICS IN BALDRIGE &
STRATEGIC MANAGEMENT
Today analytics driven environment to include more fact based decission as
opposed to judgement and intitution.
These principles have been reflected in the Baldrige Criteria for many years.
The 2015-2016 Baldrige Excellence Framework (Baldrige Performance
Excellence Program 2015) notes the importance of data and analytics in
the Core Value of Management by Fact.
Various research studies have discovered strong relationships between a
company’s performance in terms of profitability, revenue, and shareholder
return and its use of analytics.
Application of Baldrige
For all organizations, turning data into knowledge and knowledge into useful
strategic insights is the real challenge of big data. While the volume of data an
organization must assimilate and use in decision making may vary widely, all
organizations are faced with using data from different sources and of varying
quality.
Various elements of the Baldrige Criteria explicitly address both
descriptive and predictive analytics implicitly:
• Strategy considerations- How do you collect and analyze relevant
data and develop information for your strategic planning process?
Performance projections- what are your performance projections for
your short- and longer-term planning horizons?
• Performance measures. How do you use data and information to
track daily operations and overall organizational performance?
• Future performance. How do you project your organization’s future
performance?
ANALYTICS & THE QUALITY
PROFESSION
• Extensive amount of activity surrounding analytics in business and
academia, the quality profession appears to be lagging behind
analytic trends.
• 70 percent of executives think they are incapable of leveraging
what data are saying.
•More than 50 percent of organizations do not knowhow to make
business decisions based on predictive Analytic
• Only traditional tools such as fishbone and affinity diagrams for
analysis.
• Data visualization represents one of the most effective tools for
communicating analytic information.
• Following are the categories
I. space and time,
II. multivariate,
III. text, graph
IV. network
• Data visualizations are often summarized in “dashboards”and “scorecards”
to report key performance measures.
• The use of dashboards has been reported by many Baldrige recipients
Data Visualisation-
• One of the most powerful methods of modern analytics is data and
text mining.
• It is the extraction of hidden predictive information from large
databases, is a powerful new technology with great potential to
help companies focus on the most important information in their
data warehouses.
• Data mining tools predict future trends and behaviors, allowing
businesses to make proactive, knowledge-driven decisions.
• Data mining can be considered part descriptive and part
prescriptive.
Data Mining-
Some common approaches in data mining
• Data exploration and reduction
• Cluster analysis
• Classification.
• Discriminant analysis
• Logistic regression.
• Association
• Cause-and-effect modeling
CONCLUSION
• The amount of data that is generated in the business world is doubling every year.
Therefore the demand for business analytics will grow in near future.
• By combining data, statistical analysis and predictive modelling, business analytics
enables more accurate, objective and economical decision making.
• Business analytics is moving from looking at reports generated by a business
intelligence (BI) system to an algorithm that will make decisions for you.
• Five trends that have changed the future of business analytics are-:
Cloud Computing
Big Data
Social Media
Mobile
Predictive Analytics
Challenges For Business
Analytics-
1. Depends on sufficient volume of high quality data.
2. Lack of understanding of how to use analytics, competing business
priorities, insufficient analytical skills, difficulty in getting good data and
sharing information.
3. In the past, business users relied on statisticians to analyze the data and to
report the results.
4. The growing variety in data, organization’s need to determine the types of
data they want to analyze.
5. Data warehousing requires a large storage capacity to store huge amount
of data.
Advantages of Modern
Analytics-
1. Improves the decision making process.
2. Responding to user needs for availability of data on timely basis
3. Sharing information with a wider audience.
4. Increase the quality of decision making.
THANK YOU

Modern Analytics And The Future Of Quality And Performance Excellence

  • 1.
    Modern Analytics AndThe Future Of Quality And Performance Excellence IBS GURGAON
  • 2.
    INTRODUCTION What is Analytics? •Analytics is the use of data, information technology, statistical analysis, quantitative methods and other tools to help managers gain improved insight about their business operations and make better, fact-based decisions. • Almost all organisations are using modern analytics to improve customer relationships, financial and marketing activities, supply chain.
  • 3.
    Users Of BusinessAnalytics- • Banks- to predict and prevent credit fraud • Manufactures- for production, planning purchasing and inventory management. • Retailers- to recommend products to customers • Pharmaceutical Firms- to get life saving drugs to market • Business Man- to make business strategies • Auditors • Students
  • 4.
    Tools Used ForBusiness Analytics MS Excel- It is a spreadsheet application developed by Microsoft. It features calculation, graphing tools, pivot tables and a macro programming language called visual basic. SPSS- SPSS Modeller is a data mining software tool by SPSS Inc., an IBM company. It was originally named SPSS Clementine. It is a software used for Statistical Analysis. R- It is a programming language and software environment for statistical computing and graphics. The R language is an open source tool and is widely used by the academia.
  • 5.
    ORIGIN OF BUSINESS ANALYTICS •The term was first used by H. P. Luhn in an article entitled “A Business Intelligence System,” published in an IBM research journal in 1958. • Work done throughout this period was focused on technologies, standards, processes and tools to support the collection, storage rationalization and retrieval of data and the creation of reports. • Statistical methods include the basic tools of description, exploration, estimation, and inference, as well as more advanced techniques like regression, forecasting, and data mining. History-
  • 6.
    • Technology didnot advance to the point where it could be considered an agent of business analytics until well into the 20th century. • It was with the 1958 publication of a landmark article on the subject, written by IBM computer scientist Hans Peter Luhn, that the potential of BI was recognized. • With the advent of computers in the business world, companies finally had an alternative to storing data on paper. • IBM’s invention of the hard disk in 1956 revolutionized data storage. Floppy discs, laser discs, and other storage technologies meant that just as more and more data was being created, so too were there more and more places to store it.
  • 7.
    • As businessintelligence became a commonly known phrase in the late 1990’s and early 2000’s, dozens of new vendors hit the market. • Statistical methods include the basic tools of description, exploration, estimation, and inference, as well as more advanced techniques like regression, forecasting, and data mining. • Many operation research and management system applications use modelling and optimization to find the best solutions and decision. • Decision support systems (DSS) began to evolve in the 1960s by combining business intelligence concepts with OR/MS models to create analytical- based computer systems to support decision making
  • 8.
    SCOPE OF MODERN ANALYTICS ModernAnalytics have 3 fundamental disciplines- 1. Business intelligence/ Information systems (BI/IS) 2. Quantitative methods/ Operations research 3. Statistics
  • 9.
    Modern analytics isoften characterized from three perspectives- 1. Descriptive analytics- The use of data to understand past and current performance and make informed decisions. Descriptive analytics summarizes data into meaningful charts and reports, for example, about budgets, sales, revenues, or cost. 2. Predictive analytics- Analyzing past performance in an effort to predict the future by examining historical data, detecting patterns or relationships in these data, and then extrapolating these relationships forward in time. 3. Prescriptive analytics- Using optimization to identify the best alternatives to minimize or maximize some objective. The mathematical and statistical techniques of predictive analytics can also be combined with optimization to make decisions that take into account the uncertainty in the data
  • 10.
    • Modern analyticsis often associated with “big data.” Big data provide an opportunity for organizations to gain a competitive advantage—if the data can be understood and analyzed effectively to make better decisions. • Big data come from many sources, and can be numerical, textual, and even audio and video data. • Big data are captured using sensors, click streams from the Web, customer transactions, emails, tweets and social media, and other ways. • Processes such as fraud detection must be analyzed quickly to have value.
  • 11.
    ANALYTICS IN BALDRIGE& STRATEGIC MANAGEMENT Today analytics driven environment to include more fact based decission as opposed to judgement and intitution. These principles have been reflected in the Baldrige Criteria for many years. The 2015-2016 Baldrige Excellence Framework (Baldrige Performance Excellence Program 2015) notes the importance of data and analytics in the Core Value of Management by Fact. Various research studies have discovered strong relationships between a company’s performance in terms of profitability, revenue, and shareholder return and its use of analytics.
  • 12.
    Application of Baldrige Forall organizations, turning data into knowledge and knowledge into useful strategic insights is the real challenge of big data. While the volume of data an organization must assimilate and use in decision making may vary widely, all organizations are faced with using data from different sources and of varying quality.
  • 13.
    Various elements ofthe Baldrige Criteria explicitly address both descriptive and predictive analytics implicitly: • Strategy considerations- How do you collect and analyze relevant data and develop information for your strategic planning process? Performance projections- what are your performance projections for your short- and longer-term planning horizons? • Performance measures. How do you use data and information to track daily operations and overall organizational performance? • Future performance. How do you project your organization’s future performance?
  • 14.
    ANALYTICS & THEQUALITY PROFESSION • Extensive amount of activity surrounding analytics in business and academia, the quality profession appears to be lagging behind analytic trends. • 70 percent of executives think they are incapable of leveraging what data are saying. •More than 50 percent of organizations do not knowhow to make business decisions based on predictive Analytic • Only traditional tools such as fishbone and affinity diagrams for analysis.
  • 15.
    • Data visualizationrepresents one of the most effective tools for communicating analytic information. • Following are the categories I. space and time, II. multivariate, III. text, graph IV. network • Data visualizations are often summarized in “dashboards”and “scorecards” to report key performance measures. • The use of dashboards has been reported by many Baldrige recipients Data Visualisation-
  • 16.
    • One ofthe most powerful methods of modern analytics is data and text mining. • It is the extraction of hidden predictive information from large databases, is a powerful new technology with great potential to help companies focus on the most important information in their data warehouses. • Data mining tools predict future trends and behaviors, allowing businesses to make proactive, knowledge-driven decisions. • Data mining can be considered part descriptive and part prescriptive. Data Mining-
  • 17.
    Some common approachesin data mining • Data exploration and reduction • Cluster analysis • Classification. • Discriminant analysis • Logistic regression. • Association • Cause-and-effect modeling
  • 18.
    CONCLUSION • The amountof data that is generated in the business world is doubling every year. Therefore the demand for business analytics will grow in near future. • By combining data, statistical analysis and predictive modelling, business analytics enables more accurate, objective and economical decision making. • Business analytics is moving from looking at reports generated by a business intelligence (BI) system to an algorithm that will make decisions for you. • Five trends that have changed the future of business analytics are-: Cloud Computing Big Data Social Media Mobile Predictive Analytics
  • 19.
    Challenges For Business Analytics- 1.Depends on sufficient volume of high quality data. 2. Lack of understanding of how to use analytics, competing business priorities, insufficient analytical skills, difficulty in getting good data and sharing information. 3. In the past, business users relied on statisticians to analyze the data and to report the results. 4. The growing variety in data, organization’s need to determine the types of data they want to analyze. 5. Data warehousing requires a large storage capacity to store huge amount of data.
  • 20.
    Advantages of Modern Analytics- 1.Improves the decision making process. 2. Responding to user needs for availability of data on timely basis 3. Sharing information with a wider audience. 4. Increase the quality of decision making.
  • 21.