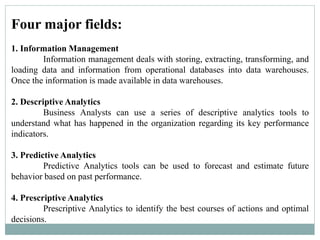
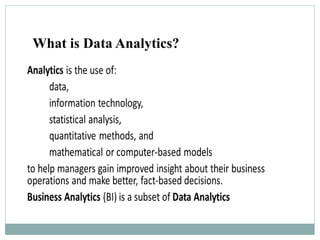
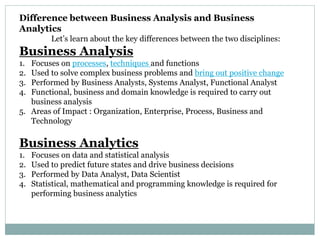
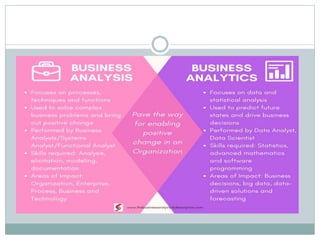
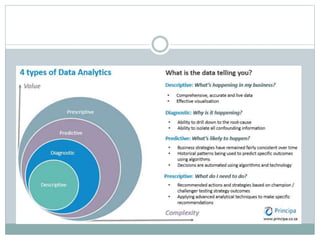
Basic Concepts of Business Data Analytics, Evolution of Business Analytics, Data Analytics, Business Data Analytics Applications, Scope of Business Analytics.
Slides used for a presentation to introduce the field of business analytics. Covers what BA is, how it is a part of business intelligence, and what areas make up BA.
It is an introduction to Data Analytics, its applications in different domains, the stages of Analytics project and the different phases of Data Analytics life cycle.
I deeply acknowledge the sources from which I could consolidate the material.
This presentation briefly explains the following topics:
Why is Data Analytics important?
What is Data Analytics?
Top Data Analytics Tools
How to Become a Data Analyst?
Introduction to Business Analytics Part 1 published by BeamSync.
BeamSync is providing business analytics training course in Bangalore. If you are looking for analytics training then visit BeamSync. Regular classes are running during the weekend.
For details visit: http://beamsync.com/business-analytics-training-bangalore/
The Institution's Innovation Council (Ministry of HRD initiative) and the Institution of Electronics and Telecommunication Engineers (IETE) invited me to grace "World Telecommunication & Information Society Day" on 18 May 2020.
This presentation introduces big data and explains how to generate actionable insights using analytics techniques. The deck explains general steps involved in a typical analytics project and provides a brief overview of the most commonly used predictive analytics methods and their business applications.
Vijay Adamapure is a Data Science Enthusiast with extensive experience in the field of data mining, predictive modeling and machine learning. He has worked on numerous analytics projects ranging from healthcare, business analytics, renewable energy to IoT.
Vijay presented these slides during the Internet of Everything Meetup event 'Predictive Analytics - An Overview' that took place on Jan. 9, 2015 in Mumbai. To join the Meetup group, register here: http://bit.ly/1A7T0A1
Data Analytics For Beginners | Introduction To Data Analytics | Data Analytic...Edureka!
Data Analytics for R Course: https://www.edureka.co/r-for-analytics
This Edureka Tutorial on Data Analytics for Beginners will help you learn the various parameters you need to consider while performing data analysis.
The following are the topics covered in this session:
Introduction To Data Analytics
Statistics
Data Cleaning and Manipulation
Data Visualization
Machine Learning
Roles, Responsibilities and Salary of Data Analyst
Need of R
Hands-On
Statistics for Data Science: https://youtu.be/oT87O0VQRi8
Follow us to never miss an update in the future.
Instagram: https://www.instagram.com/edureka_learning/
Facebook: https://www.facebook.com/edurekaIN/
Twitter: https://twitter.com/edurekain
LinkedIn: https://www.linkedin.com/company/edureka
Overview of Business Analytics and career lessons learnt / advice. Presentation delivered to Melbourne Business School - Masters of Business Analytics - July 2016.
3 pillars of big data : structured data, semi structured data and unstructure...PROWEBSCRAPER
There are 3 pillars of Big Data
1.Structured data
2.Unstructured data
3.Semi structured data
Businesses worldwide construct their empire on these three pillars and capitalize on their limitless potential.
This presentation is an Introduction to the importance of Data Analytics in Product Management. During this talk Etugo Nwokah, former Chief Product Officer for WellMatch, covered how to define Data Analytics why it should be a first class citizen in any software organization
What is business intelligence and where it is applicable is described in this presentation. The subject is offered as elective to BE IT students of Pune University.
data analytics is the process of examining large datasets to uncover hidden patterns, correlations, trends and insights that can inform decision-making and drive business strategies.
The need, applications, challenges, new trends and
a consulting perspective
(Why is Big Data a strategic need for optimization of organizational processes especially in the business domains and what is the consultant’s role?)
With every transaction and activity, organizations churn out data. This process happens even in the case of idle operation. Hence, data needs to be effectively analyzed to manage all processes better. Data can be used to make sense of the current situation and predict outcomes. It also can be used to optimize business processes and operations. This is easier said than done as data is being produced at an unprecedented rate, huge volumes and a high degree of variety. For the outcome of the data analysis to be relevant, all the data sets must be factored in to the analysis and predictions. This is where big data analysis comes in with its sophisticated tools that are also now easy on the pocket if one prefers the open source.
The future of high potential marketing lead generation would be based on big data. Virtually every business vertical can benefit from big data initiatives. Even those without deep pockets can use the cloud model for business analytics/big data analysis.
Some challenges remain to be addressed to engender large scale adoption but the current benefits outweigh the concerns.
India has seen a massive growth in big data adoption and the trend will grow though it is generally amongst the bigger players. As quality of data improves and customer reluctance to being honest when they volunteer data reduces, the forecasts will become more accurate and Big Data will have come to its rightful place as a key enabler.
Data Science - Part I - Sustaining Predictive Analytics CapabilitiesDerek Kane
This is the first lecture in a series of data analytics topics and geared to individuals and business professionals who have no understand of building modern analytics approaches. This lecture provides an overview of the models and techniques we will address throughout the lecture series, we will discuss Business Intelligence topics, predictive analytics, and big data technologies. Finally, we will walk through a simple yet effective example which showcases the potential of predictive analytics in a business context.
Business analytics is a custom of transforming the data into business understandings enabling the end users for better decision-making. By using the modern tools and techniques, business analytics can help assess complex situations, consider all the available options, and predict outcomes and showcase critical risks for the decision makers.
Business Analytics can simply be described as a practice that includes the use of various techniques such as Data warehousing, Data mining, Programming in order to visualize and discover several patterns or trends in data. In simple, Analytics help convert the data into useful information, which can be used for decision-making. As a means of sorting through data to find useful information, the application of analytics has found new purpose
How to Make a Field invisible in Odoo 17Celine George
It is possible to hide or invisible some fields in odoo. Commonly using “invisible” attribute in the field definition to invisible the fields. This slide will show how to make a field invisible in odoo 17.
Model Attribute Check Company Auto PropertyCeline George
In Odoo, the multi-company feature allows you to manage multiple companies within a single Odoo database instance. Each company can have its own configurations while still sharing common resources such as products, customers, and suppliers.
The French Revolution, which began in 1789, was a period of radical social and political upheaval in France. It marked the decline of absolute monarchies, the rise of secular and democratic republics, and the eventual rise of Napoleon Bonaparte. This revolutionary period is crucial in understanding the transition from feudalism to modernity in Europe.
For more information, visit-www.vavaclasses.com
Welcome to TechSoup New Member Orientation and Q&A (May 2024).pdfTechSoup
In this webinar you will learn how your organization can access TechSoup's wide variety of product discount and donation programs. From hardware to software, we'll give you a tour of the tools available to help your nonprofit with productivity, collaboration, financial management, donor tracking, security, and more.
The Art Pastor's Guide to Sabbath | Steve ThomasonSteve Thomason
What is the purpose of the Sabbath Law in the Torah. It is interesting to compare how the context of the law shifts from Exodus to Deuteronomy. Who gets to rest, and why?
Read| The latest issue of The Challenger is here! We are thrilled to announce that our school paper has qualified for the NATIONAL SCHOOLS PRESS CONFERENCE (NSPC) 2024. Thank you for your unwavering support and trust. Dive into the stories that made us stand out!
Synthetic Fiber Construction in lab .pptxPavel ( NSTU)
Synthetic fiber production is a fascinating and complex field that blends chemistry, engineering, and environmental science. By understanding these aspects, students can gain a comprehensive view of synthetic fiber production, its impact on society and the environment, and the potential for future innovations. Synthetic fibers play a crucial role in modern society, impacting various aspects of daily life, industry, and the environment. ynthetic fibers are integral to modern life, offering a range of benefits from cost-effectiveness and versatility to innovative applications and performance characteristics. While they pose environmental challenges, ongoing research and development aim to create more sustainable and eco-friendly alternatives. Understanding the importance of synthetic fibers helps in appreciating their role in the economy, industry, and daily life, while also emphasizing the need for sustainable practices and innovation.
Operation “Blue Star” is the only event in the history of Independent India where the state went into war with its own people. Even after about 40 years it is not clear if it was culmination of states anger over people of the region, a political game of power or start of dictatorial chapter in the democratic setup.
The people of Punjab felt alienated from main stream due to denial of their just demands during a long democratic struggle since independence. As it happen all over the word, it led to militant struggle with great loss of lives of military, police and civilian personnel. Killing of Indira Gandhi and massacre of innocent Sikhs in Delhi and other India cities was also associated with this movement.
How to Create Map Views in the Odoo 17 ERPCeline George
The map views are useful for providing a geographical representation of data. They allow users to visualize and analyze the data in a more intuitive manner.
The Roman Empire A Historical Colossus.pdfkaushalkr1407
The Roman Empire, a vast and enduring power, stands as one of history's most remarkable civilizations, leaving an indelible imprint on the world. It emerged from the Roman Republic, transitioning into an imperial powerhouse under the leadership of Augustus Caesar in 27 BCE. This transformation marked the beginning of an era defined by unprecedented territorial expansion, architectural marvels, and profound cultural influence.
The empire's roots lie in the city of Rome, founded, according to legend, by Romulus in 753 BCE. Over centuries, Rome evolved from a small settlement to a formidable republic, characterized by a complex political system with elected officials and checks on power. However, internal strife, class conflicts, and military ambitions paved the way for the end of the Republic. Julius Caesar’s dictatorship and subsequent assassination in 44 BCE created a power vacuum, leading to a civil war. Octavian, later Augustus, emerged victorious, heralding the Roman Empire’s birth.
Under Augustus, the empire experienced the Pax Romana, a 200-year period of relative peace and stability. Augustus reformed the military, established efficient administrative systems, and initiated grand construction projects. The empire's borders expanded, encompassing territories from Britain to Egypt and from Spain to the Euphrates. Roman legions, renowned for their discipline and engineering prowess, secured and maintained these vast territories, building roads, fortifications, and cities that facilitated control and integration.
The Roman Empire’s society was hierarchical, with a rigid class system. At the top were the patricians, wealthy elites who held significant political power. Below them were the plebeians, free citizens with limited political influence, and the vast numbers of slaves who formed the backbone of the economy. The family unit was central, governed by the paterfamilias, the male head who held absolute authority.
Culturally, the Romans were eclectic, absorbing and adapting elements from the civilizations they encountered, particularly the Greeks. Roman art, literature, and philosophy reflected this synthesis, creating a rich cultural tapestry. Latin, the Roman language, became the lingua franca of the Western world, influencing numerous modern languages.
Roman architecture and engineering achievements were monumental. They perfected the arch, vault, and dome, constructing enduring structures like the Colosseum, Pantheon, and aqueducts. These engineering marvels not only showcased Roman ingenuity but also served practical purposes, from public entertainment to water supply.
Palestine last event orientationfvgnh .pptxRaedMohamed3
An EFL lesson about the current events in Palestine. It is intended to be for intermediate students who wish to increase their listening skills through a short lesson in power point.
3. DEFINITION OF ANALYTICS
Analytics is the scientific process of discovering
and communicating the meaningful patterns which can
be found in data.
It is concerned with turning raw data into insight
for making better decisions.
According to Wayne Winston: “using data for
better decision making.”
5. How is data analytics used in business?
Data Scientists and Analysts use data analytics
techniques in their research, and businesses
also use it to inform their decisions. Data analysis
can help companies better understand their
customers, evaluate their ad campaigns, personalize
content, create content strategies and develop
products.
6. Evolution of Business Analytics
The advent of business computers back in the 1970s
led to a range of applications tailored for corporate
use. This probably led Gartner to define 'Business
analytics' as a range of solutions 'used to build
analysis models and simulations to create scenarios,
understand realities and predict future states
8. Why do we need analytics ?
Data analytics is important because it helps
businesses optimize their performances.
A company can also use data analytics to make
better business decisions and help analyze customer
trends and satisfaction, which can lead to new—and
better—products and services
10. Why do we need business analytics ?
Business analytics help organizations to reduce
risks. By helping them make the right decisions
based on available data such as customer
preferences, trends, and so on, it can help businesses
to reduce short and long-term risk.
11. Four Major Fields
1. Information Management
2. Descriptive Analytics
3. Predictive Analytics
4. Prescriptive Analytics
12.
13.
14. Four major fields:
1. Information Management
Information management deals with storing, extracting, transforming, and
loading data and information from operational databases into data warehouses.
Once the information is made available in data warehouses.
2. Descriptive Analytics
Business Analysts can use a series of descriptive analytics tools to
understand what has happened in the organization regarding its key performance
indicators.
3. Predictive Analytics
Predictive Analytics tools can be used to forecast and estimate future
behavior based on past performance.
4. Prescriptive Analytics
Prescriptive Analytics to identify the best courses of actions and optimal
decisions.
19. Retail Markdown Decisions
Most department stores clear seasonal inventory by
reducing prices.
The question is:
When to reduce the price and by how much?
Descriptive analytics: examine historical data for
similar products (prices, units sold, advertising, …)
Predictive analytics: predict sales based on price
Prescriptive analytics: find the best sets of
pricing and advertising to maximize sales revenue
Scope of Business Analytics
20. DATA
- collected facts and figures
DATABASE
- collection of computer files
containing data
INFORMATION
- comes from analyzing data
Data for Business Analytics
21.
22. Difference between Business Analysis and Business
Analytics
Let’s learn about the key differences between the two disciplines:
Business Analysis
1. Focuses on processes, techniques and functions
2. Used to solve complex business problems and bring out positive change
3. Performed by Business Analysts, Systems Analyst, Functional Analyst
4. Functional, business and domain knowledge is required to carry out
business analysis
5. Areas of Impact : Organization, Enterprise, Process, Business and
Technology
Business Analytics
1. Focuses on data and statistical analysis
2. Used to predict future states and drive business decisions
3. Performed by Data Analyst, Data Scientist
4. Statistical, mathematical and programming knowledge is required for
performing business analytics
23.
24.
25.
26.
27.
28.
29. 1. Descriptive Analytics: Describing or summarising the
existing data using existing business intelligence tools to
better understand what is going on or what has happened.
2. Diagnostic Analytics: Focus on past performance to
determine what happened and why. The result of the
analysis is often an analytic dashboard.
3. Predictive Analytics: Emphasizes on predicting the
possible outcome using statistical models and machine
learning techniques.
4. Prescriptive Analytics: It is a type of predictive
analytics that is used to recommend one or more course of
action on analyzing the data.
31. Tools for Analytics
1. SLM (Service Life-Cycle Management)
LCM is a business management approach that can be used by all types of
business in order to improve their sustainability performance. LCM is about
making life cycle thinking and product sustainability operational for businesses
that are aiming for continuous improvement.
2. Supply chain management (SCM)
Supply chain management (SCM) is the process and activitity of sourcing the raw
materials or components an enterprise needs to create a product or service and
deliver that product or service to customers. The goal of SCM software is to
improve supply chain performance.
32. 3. ERP (Enterprise Resource Planning)
Enterprise resource planning (ERP) refers to a type of software that
organizations use to manage day-to-day business activities such as accounting,
procurement, project management, risk management and compliance, and
supply chain operations.
4. Customer relationship management (CRM)
Customer relationship management (CRM) is a technology for managing all
your company's relationships and interactions with customers and potential
customers. A CRM system helps companies stay connected to customers,
streamline processes, and improve profitability.
33. BUSINESS ANALYTICS TOOLS
1. SAS Business Analytics (SAS BA)
The high-grade text analytics capabilities of the SAS-based business analytics
software allow users to inspect and transform unorganized text data into
relevant information that analysts can explore to discover meaningful insights.
2. QlikView
QlikView is one of the most preferred tools for business analytics because of
its unique features, such as patented technology and in-memory processing,
facilitating the delivery of ultra-fast business analytics reports.
34. Splunk
Splunk is one of the most widely used business analytics tools in small and
medium scale industries.
TIBCO Spotfire
TIBCO Spotfire, recognized as one of the most advanced tools for business
analytics, offers powerful and automated analytics solutions that allow data
professionals to run business analytics reports and analysis over a defined time
span.
35. Conclusion for Tools
today's state-of-the-art analytical tools for business
facilitate efficient data collection, analysis, and
presentation in real-time, empowering enterprises to
identify trends/patterns in vast datasets and create
new business analytics models.
36. Concepts of Insights
Insight is gained by analyzing data and
information to understand what is going on with
the particular situation.