This project is about "Big Data Analytics," and it provides a comprehensive overview of topics related to Data and Analytics and a short note on Cognitive Analytics, Sentiment Analytics, Data Visualization, Artificial intelligence & Data-Driven Decision Making along with examples and diagrams.
every business needs a data analytics to get a detailed value of cost and profits. we will study the importance in detail in this particular presentation.
It is an introduction to Data Analytics, its applications in different domains, the stages of Analytics project and the different phases of Data Analytics life cycle.
I deeply acknowledge the sources from which I could consolidate the material.
Strata Data Conference 2019 : Scaling Visualization for Big Data in the CloudJaipaul Agonus
This deck deals with scaling visualizations for big data in the cloud.
Approaching this problem on two fronts, beginning on the engineering side of things, looking at different scaling strategies that can be used on cloud resources.
Then about strategies that we use for turning data into visualizations and the usage of proven visualization blueprints for market surveillance.
Material for the 26 Oct 2015 lecture I held for Aalto University business students. The lecture focuses on the high level topics in analytics and Big Data that are either central to the subject or just highly visible in the media.
The main messages of the lecture are:
- The purpose of analytics and of the data analyst is to solve business problems
- Big Data brings over some very special traits to doing analytics that don't exist when working working with smaller datasets. Understanding these traits is a must for successful analytics.
- Deploying analytics is more dependent on humans than on technology
- Data and analytics are nowadays significant assets to many companies. Therefore they need their own strategy and need to be managed just like any other business critical assets.
Building a Data Platform Strata SF 2019mark madsen
Building a data lake involves more than installing Hadoop or putting data into AWS. The goal in most organizations is to build multi-use data infrastructure that is not subject to past constraints. This tutorial covers design assumptions, design principles, and how to approach the architecture and planning for multi-use data infrastructure in IT.
[This is a new, changed version of the presentations of the same title from last year's Strata]
PoT - probeer de mogelijkheden van datamining zelf uit 30-10-2014Daniel Westzaan
IBM Proof of Technology
Probeer de Mogelijkheden van Datamining zelf uit
30-10-2014 Amsterdam, IBM Client Center
Presentatie van Laila Fettah & Robin van Tilburg
Pay no attention to the man behind the curtain - the unseen work behind data ...mark madsen
Goal: explain the nature of the work of an analytics team to a manager, and enable people on those teams to explain what a data science team needs to a manager.
It seems as if every organization wants to enable analytical-decision making and embed analytics into operational processes. What can you do with analytics? It looks like anything is possible. What can you really do? Probably a lot less than you expect. Why is this? Vendors promise easy-to-use analytics tools and services but they rarely deliver. The products may be easy but the work is still hard.
Using analytics to solve problems depends on many factors beyond the math: people, processes, the skills of the analyst, the technology used, the data. Technology is the easy part. Figuring out what to do and how to do it is a lot harder. Despite this, fancy new tools get all the attention and budget.
People and data are the truly hard parts. People, because many believe that data is absolute rather than relative, and that analytic models produce an answer rather than a range of answers with varying degrees of truth, accuracy and applicability. Data, because managing data for analytics is a nuanced, detail-oriented and seemingly dull task left to back-office IT.
If your goal is to build a repeatable analytics capability rather than a one-off analytics project then you will need to address the parts that are rarely mentioned. This talk will explain some of the unseen and little-discussed aspects involved when building and deploying analytics.
How relevant is Predictive Analytics relevant today?Steven Mugerwa
This is my view on how relevant is Predictive Analytics relevant today. Although its a high level view, it gives great insights to a person who is looking for somewhere to begin. This was an essay for the
Data Quality Analytics: Understanding what is in your data, before using itDomino Data Lab
Analytics and data science are ever growing fields, as business decision makers continue to use data to drive decisions. The pinnacle of these fields are the models and their accuracy/fit,; what about the data? Is your data clean, and how do you know that? Our discussion will focus on best practices for data preprocessing for analytic uses. Beginning with essential distributional checks of a dataset to a propose method for automated data validation process during ETL for transactional data.
Data Scientist has been regarded as the sexiest job of the twenty first century. As data in every industry keeps growing the need to organize, explore, analyze, predict and summarize is insatiable. Data Science is creating new paradigms in data driven business decisions. As the field is emerging out of its infancy a wide range of skill sets are becoming an integral part of being a Data Scientist. In this talk I will discuss the different driven roles and the expertise required to be successful in them. I will highlight some of the unique challenges and rewards of working in a young and dynamic field.
Moving Data Science from an Event to A Program: Considerations in Creating Su...Domino Data Lab
The exponential growth of Big Data and Analytics has outpaced the ability of organizations to govern their data appropriately. The ability to reuse the work done by data scientists work is becoming an economic necessity. The mix of data sources is changing from tradition transactional and ERP systems to include a mix of structured, semi-structured and unstructured data. Data Governance needs to adapt to these changes. This session discusses these data changes and proposed how to adapt current data governance processes. These include, how the concept of a stakeholder has changed and the need for expansion of communications and content management. We look at need to consolidate data from disparate systems and how it governed. Lastly we will investigate how context is emerging as an important factor in governance and how it can be leveraged to provide for accurate, reliable data reuse.
Enabling data scientists within an enterprise requires a well-thought out approach from an organization, technology, and business results perspective. In this talk, Tim and Hussain will share common pitfalls to data science enablement in the enterprise and provide their recommendations to avoid them. Taking an example, actionable use case from the financial services industry, they will focus on how Anaconda plays a pivotal role in setting up big data infrastructure, integrating data science experimentation and production environments, and deploying insights to production. Along the way, they will highlight opportunities for leveraging open source and unleashing data science teams while meeting regulatory and compliance challenges.
This presentation was part of the talk delivered by T Ashok Founder & CEO STAG Software at the HSTC 2013: "Think Testing" Conference on Nov 21 & 22 at Hyderabad.
Webinář: Ochrana dat ve virtuálním prostředí pomocí nástroje Veeam B&R / 3.10...Jaroslav Prodelal
Ochrana dat je jednou z nejdůležitějších činností, kterou musí IT oddělení zajistit nad rámec samotného provozu. S příchodem virtualizace se změnil i způsob jakým lze data chránit a na trhu se objevily nástroje, které jsou pro tyto účely přímo navrženy.
V tomto webináři bych vás rád seznámil s produktem Veeam Backup & Replication a zároveň vám nabídnul alternativy a jejich jednoduché srovnání.
Zúčastněte se webináře a zajistěte si tak informace, které vám pomohou při ochraně dat ve vašem virtuálním prostředí. Platí pro VMware vSphere a Microsoft Hyper-V virtuální infrastruktury.
Agenda:
-------------
* ochrana dat ve virtuálním prostředí
* představení Veeam backup & Replication
* zálohování
* obnova
* replikace
* dostupné edice a jejich srovnání
* licencování
* alternativy k Veeam Backup & Replication
* aktuální nabídky a promo akce
English bookWomen's Running Magazine Subscription WHSmith yogisri001
Trikarana Transcendental Meditation (TTM)
Yogi Sriji is an enlightened spiritual leader; founder of Trikarana Yoga Charitable Trust and Trikarana Transcendental Meditation (TTM) Center, a unit of the Trust, started in the year 2009 in Coimbatore, an Industrial City in Tamil Nadu, India.
Simon Duffy gave this talk as part of the Newcastle Business School's series - Little Heresies. He explores the genesis, achievements and weaknesses of personal budgets and the problem of expecting Government to be able to innovate.
Specializzata nello studio delle lingue all’estero per studenti dalle scuole medie agli over 50, School and Vacation offre a tutti la possibilità di imparare o migliorare le lingue straniere. Tale opportunità è proposta a prezzi vantaggiosi o agli stessi prezzi pubblicati dalle scuole estere, con un servizio su misura, curato nei minimi dettagli.
Difference B/w Data Analytics, Data Analysis, Data Mining, Data Science, Machine Learning, and Big Data
The most popular and rapidly evolving technologies in the world are Data Analytics, Data Analysis, Data Mining, Data Science, Machine Learning, and Big Data. All firms, large and small, are increasingly looking for IT experts who can filter through the data and help with the efficient implementation of sound business decisions. In light of the current competitive environment, Data Analytics, Data Analysis, Data Mining, Data Science, Machine Learning, and Big Data are essential technologies that drive company growth and development. In this topic, “Difference Between Data Analytics, Data Analysis, Data Mining, Data Science, Machine Learning, And Big Data,” we will examine the key definitions and skills needed to obtain them. We will also examine the main differences between Data Analytics, Data Analysis, Data Mining, Data Science, Machine Learning, and Big Data. So let’s start by briefly introducing each concept.
Data Analysis vs Data Analytics
Data Analysis is the process of analyzing, organizing, and manipulating a collection of data to extract relevant information. An “Analytics platform” is a piece of software that enables data and statistics to be generated and examined systematically, whereas a “business analyst” is a person who applies an analytical method to a collection of information for a specific goal. As this is becoming increasingly popular the corporate sector has started to broadly accept it. Data Analysis makes it easy to understand the data. It provides an important historical context for understanding what has occurred recent past. To master Power BI check out Power BI Online Course
Data Analytics includes both decision-making processes and performance enhancement through relevant forecasts. Businesses may utilize data analytics to enhance business decisions, evaluate market trends, and analyze customer satisfaction, all of which can lead to the creation of new, enhanced products and services. Using Data Analytics, it is possible to make more accurate forecasts for the future by examining previous data. To master Data Analytics Skills visit Data Analytics Course in Pune
Want Free Career Counseling?
Just fill in your details, and one of our experts will call you!
Call us: +918308103366
WhatsApp Us: https://wa.me/+918308103366
Data Analytics
Data Analysis
Data Analytics is analytics that is used to make conclusions based on data.
Data Analysis is a subset of data analytics that is used to analyze data and derive specific insights from it.
Using historical data and customer expectations, businesses may develop a solid business strategy.
Making the most of historical data helps organizations identify new possibilities promote business growth and make more effective decisions.
The term “data analytics” refers to the collecting and assessment of data that involves one or more users.
Understanding Data Science: Unveiling the Basics
What is Data Science?
Data science is an interdisciplinary field that combines techniques from statistics, mathematics, computer science, and domain knowledge to extract insights and knowledge from data. It involves collecting, processing, analyzing, and interpreting large and complex datasets to solve real-world problems.
Importance of Data Science
In today's data-driven world, organizations are inundated with data from various sources. Data science allows them to convert this raw data into actionable insights, enabling informed decision-making, improved efficiency, and innovation.
Intersection of Data Science, Statistics, and Computer Science
Data science borrows heavily from statistics and computer science. Statistical methods help in understanding data patterns, while computer science provides the tools to process and analyze large datasets efficiently.
Key Components of Data Science
Data Collection and Storage
The first step in data science is gathering relevant data from various sources. This data is then stored in databases or data warehouses for further processing.
Data Cleaning and Preprocessing
Raw data is often messy and inconsistent. Data cleaning involves removing errors, duplicates, and irrelevant information. Preprocessing includes transforming data into a usable format.
Exploratory Data Analysis (EDA)
EDA involves visualizing and summarizing data to uncover patterns, trends, and anomalies. It helps in forming hypotheses and guiding further analysis.
Machine Learning and Predictive Modeling
Machine learning algorithms are used to build predictive models from data. These models can make predictions and decisions based on new, unseen data.
Data Visualization
Visual representations of data, such as graphs and charts, help in understanding complex information quickly. Data visualization aids in conveying insights effectively.
The Data Science Process
Problem Definition
The data science process begins with understanding the problem you want to solve and defining clear objectives.
Data Collection and Understanding
Collect relevant data and understand its context. This step is crucial as the quality of the analysis depends on the quality of the data.
Data Preparation
Clean, preprocess, and transform the data into a suitable format for analysis. This step ensures that the data is accurate and ready for modeling.
Model Building
Select appropriate algorithms and build predictive models using machine learning techniques. This step involves training and fine-tuning the models.
Model Evaluation and Deployment
Evaluate the model's performance using metrics and test datasets. If the model performs well, deploy it for making predictions on new data.
Technologies Driving Data Science
Programming Languages
Languages like Python and R are widely used in data science due to their extensive libraries and versatility.
Machine Learning Libraries
Libraries like Scikit-Learn and TensorFlow prov
Data analytics presentation- Management career institute PoojaPatidar11
1. The basic definition of Data, Analytics, and Data Analytics
2. Definition: Data: Data is a set of values of qualitative or quantitative variables. It is information in the raw or unorganized form. It may be a fact, figure, characters, symbols etc
Analytics: Analytics is the discovery, interpretation, and communication of meaningful patterns in data and applying those patterns towards effective decision making.
Data Analytics: Data analytics refers to qualitative and quantitative techniques and processes used to enhance productivity and business gain.
3.Types of analytics: Predictive Analytics (What could happen?)
Prescriptive Analytics (What should we do)
Descriptive Analytics (What has happened?)
4.Why Data analytics? Data Analytics is needed in Business to Consumer applications (B2C)
5.The process of Data analytics: Data requirements,
Data collection, Data processing, Data cleaning, Exploratory data analysis,
Modeling and algorithms, Data product, Communication
6.The scope of Data Analytics: Bright future of data analytics, many professionals and students are interested in a career in data analytics.
7.Importance of data analytics:1. Predict customer trends and behaviors
Analyze,
2 interpret and deliver data in meaningful ways
3.Increase business productivity
4.Drive effective decision-making
8.why become a data analyst? talented gaps of skill candidates, good salaries for freshers, great future growth path
9. What recruiters look for in applicants: Problem-Solving Skills, Analytical Mind, Maths and Statistic Skills, Communication (both oral and written), Teamwork Abilities
10. Skill is required for Data analytics?
1.) Analytical Skills
2.) Numeracy Skills
3.) Technical and Computer Skills
4.) Attention to Details
5.) Business Skills
6.) Communication Skills
11. Data analytics tools
1.SAS: SAS (Statistical Analysis System) is a software suite developed by SAS Institute. sas language can be defined as a programming language in the computing field. This language is generally used for the purpose of statistical analysis. The language has the ability to read data from databases and common spreadsheets.
2. R: R is a programming language and software environment for statistical analysis, graphics representation and reporting.R is freely available under the GNU General Public License, and pre-compiled binary versions are provided for various operating systems like Linux, Windows, and Mac.
3.PYTHON: Python is a popular programming language Python is a powerful, flexible, open-sources language that is easy to use,
and has a powerful library for data manipulation and analysis.
4.TABLEAU: Tableau Software is a software company that produces interactive data visualization products focused on business intelligence.
When writing this new paper, my main objective was to provide a clear understanding of where the term "Big Data" comes from, why is that term so popular now, what does it really mean and what can be its implication for businesses. Because the full power of Big Data can be revealed only by Analytics, i provided a description of a widely recognized and used analytical techniques to help you figure out how used in conjunction with Big Data, analytics can boost Business Performance.
i expected that by the end of this paper :
- you will smile the next time you read or hear at the terms big data, hadoop, or analytics :)
- you will understand the technologies that are behind the scene when one talks about "Big Data"
- you will know how to "make sense" of Big Data using Analytics
- you will get a basic idea of data mining techniques used in Business in general and in Big Data in particular
- you will be able to get every news about Big Data
Data science and data analytics professionals enable organizations to utilize the potential of predictive analytics to make informed decisions & help in transforming analytics maturity model of the organization.
Data science is an integrative field that uses scientific methods, processes, algorithms, and systems to extract, knowledge and awareness from data in various forms
Data science and data analytics major similarities and distinctions (1)Robert Smith
Those working in the field of technology hear the terms ‘Data Science’ and ‘Data Analytics’ probably all the time. These two words are often used interchangeably. Big data is a major component in the tech world today due to the actionable insights and results it offers for businesses. In order to study the data that your organization is producing, it is important to use the proper tools needed to comprehend big data to uncover the right information. To help you optimize your analytics, it is important for you to examine both the similarities and differences of data science and data analytics.
Data Science - Part I - Sustaining Predictive Analytics CapabilitiesDerek Kane
This is the first lecture in a series of data analytics topics and geared to individuals and business professionals who have no understand of building modern analytics approaches. This lecture provides an overview of the models and techniques we will address throughout the lecture series, we will discuss Business Intelligence topics, predictive analytics, and big data technologies. Finally, we will walk through a simple yet effective example which showcases the potential of predictive analytics in a business context.
The need, applications, challenges, new trends and
a consulting perspective
(Why is Big Data a strategic need for optimization of organizational processes especially in the business domains and what is the consultant’s role?)
With every transaction and activity, organizations churn out data. This process happens even in the case of idle operation. Hence, data needs to be effectively analyzed to manage all processes better. Data can be used to make sense of the current situation and predict outcomes. It also can be used to optimize business processes and operations. This is easier said than done as data is being produced at an unprecedented rate, huge volumes and a high degree of variety. For the outcome of the data analysis to be relevant, all the data sets must be factored in to the analysis and predictions. This is where big data analysis comes in with its sophisticated tools that are also now easy on the pocket if one prefers the open source.
The future of high potential marketing lead generation would be based on big data. Virtually every business vertical can benefit from big data initiatives. Even those without deep pockets can use the cloud model for business analytics/big data analysis.
Some challenges remain to be addressed to engender large scale adoption but the current benefits outweigh the concerns.
India has seen a massive growth in big data adoption and the trend will grow though it is generally amongst the bigger players. As quality of data improves and customer reluctance to being honest when they volunteer data reduces, the forecasts will become more accurate and Big Data will have come to its rightful place as a key enabler.
This talk is an introduction to Data Science. It explains Data Science from two perspectives - as a profession and as a descipline. While covering the benefits of Data Science for business, It explaints how to get started for embracing data science in business.
Data science is the study of where information comes from, what it represents and how it can be turned into a valuable resource in the creation of business and IT strategies. Mining large amounts of structured and unstructured data to identify patterns can help an organization rein in costs, increase efficiencies, recognize new market opportunities and increase the organization's competitive advantage.
Implicitly or explicitly all competing businesses employ a strategy to select a mix
of marketing resources. Formulating such competitive strategies fundamentally
involves recognizing relationships between elements of the marketing mix (e.g.,
price and product quality), as well as assessing competitive and market conditions
(i.e., industry structure in the language of economics).
What is the TDS Return Filing Due Date for FY 2024-25.pdfseoforlegalpillers
It is crucial for the taxpayers to understand about the TDS Return Filing Due Date, so that they can fulfill your TDS obligations efficiently. Taxpayers can avoid penalties by sticking to the deadlines and by accurate filing of TDS. Timely filing of TDS will make sure about the availability of tax credits. You can also seek the professional guidance of experts like Legal Pillers for timely filing of the TDS Return.
[Note: This is a partial preview. To download this presentation, visit:
https://www.oeconsulting.com.sg/training-presentations]
Sustainability has become an increasingly critical topic as the world recognizes the need to protect our planet and its resources for future generations. Sustainability means meeting our current needs without compromising the ability of future generations to meet theirs. It involves long-term planning and consideration of the consequences of our actions. The goal is to create strategies that ensure the long-term viability of People, Planet, and Profit.
Leading companies such as Nike, Toyota, and Siemens are prioritizing sustainable innovation in their business models, setting an example for others to follow. In this Sustainability training presentation, you will learn key concepts, principles, and practices of sustainability applicable across industries. This training aims to create awareness and educate employees, senior executives, consultants, and other key stakeholders, including investors, policymakers, and supply chain partners, on the importance and implementation of sustainability.
LEARNING OBJECTIVES
1. Develop a comprehensive understanding of the fundamental principles and concepts that form the foundation of sustainability within corporate environments.
2. Explore the sustainability implementation model, focusing on effective measures and reporting strategies to track and communicate sustainability efforts.
3. Identify and define best practices and critical success factors essential for achieving sustainability goals within organizations.
CONTENTS
1. Introduction and Key Concepts of Sustainability
2. Principles and Practices of Sustainability
3. Measures and Reporting in Sustainability
4. Sustainability Implementation & Best Practices
To download the complete presentation, visit: https://www.oeconsulting.com.sg/training-presentations
Premium MEAN Stack Development Solutions for Modern BusinessesSynapseIndia
Stay ahead of the curve with our premium MEAN Stack Development Solutions. Our expert developers utilize MongoDB, Express.js, AngularJS, and Node.js to create modern and responsive web applications. Trust us for cutting-edge solutions that drive your business growth and success.
Know more: https://www.synapseindia.com/technology/mean-stack-development-company.html
Falcon stands out as a top-tier P2P Invoice Discounting platform in India, bridging esteemed blue-chip companies and eager investors. Our goal is to transform the investment landscape in India by establishing a comprehensive destination for borrowers and investors with diverse profiles and needs, all while minimizing risk. What sets Falcon apart is the elimination of intermediaries such as commercial banks and depository institutions, allowing investors to enjoy higher yields.
RMD24 | Retail media: hoe zet je dit in als je geen AH of Unilever bent? Heid...BBPMedia1
Grote partijen zijn al een tijdje onderweg met retail media. Ondertussen worden in dit domein ook de kansen zichtbaar voor andere spelers in de markt. Maar met die kansen ontstaan ook vragen: Zelf retail media worden of erop adverteren? In welke fase van de funnel past het en hoe integreer je het in een mediaplan? Wat is nu precies het verschil met marketplaces en Programmatic ads? In dit half uur beslechten we de dilemma's en krijg je antwoorden op wanneer het voor jou tijd is om de volgende stap te zetten.
Putting the SPARK into Virtual Training.pptxCynthia Clay
This 60-minute webinar, sponsored by Adobe, was delivered for the Training Mag Network. It explored the five elements of SPARK: Storytelling, Purpose, Action, Relationships, and Kudos. Knowing how to tell a well-structured story is key to building long-term memory. Stating a clear purpose that doesn't take away from the discovery learning process is critical. Ensuring that people move from theory to practical application is imperative. Creating strong social learning is the key to commitment and engagement. Validating and affirming participants' comments is the way to create a positive learning environment.
3.0 Project 2_ Developing My Brand Identity Kit.pptxtanyjahb
A personal brand exploration presentation summarizes an individual's unique qualities and goals, covering strengths, values, passions, and target audience. It helps individuals understand what makes them stand out, their desired image, and how they aim to achieve it.
Personal Brand Statement:
As an Army veteran dedicated to lifelong learning, I bring a disciplined, strategic mindset to my pursuits. I am constantly expanding my knowledge to innovate and lead effectively. My journey is driven by a commitment to excellence, and to make a meaningful impact in the world.
Unveiling the Secrets How Does Generative AI Work.pdfSam H
At its core, generative artificial intelligence relies on the concept of generative models, which serve as engines that churn out entirely new data resembling their training data. It is like a sculptor who has studied so many forms found in nature and then uses this knowledge to create sculptures from his imagination that have never been seen before anywhere else. If taken to cyberspace, gans work almost the same way.
Discover the innovative and creative projects that highlight my journey throu...dylandmeas
Discover the innovative and creative projects that highlight my journey through Full Sail University. Below, you’ll find a collection of my work showcasing my skills and expertise in digital marketing, event planning, and media production.
Discover the innovative and creative projects that highlight my journey throu...
What is business analytics
1. 26
What is Business Analytics?
TEKST: ISABELLE VALETTE, Sherpa Consulting AS
■ ■ ■ ■ ■ ■ ■ ■ ■ ■ ■ ■ ■ ■ ■ ■ ■ ■ ■ ■ ■ ■ ■ ■ ■ ■ ■ ■ ■ ■ ■ ■ ■ ■ ■
Business Analytics (BA) refers to the use of
analytics together with business proces-
ses. In “The Secrets of Analytical Leaders”,
Wayne Eckerson defines it well: “analytics
describes the people, processes, and
technologies that turn data into insights
that drive business decisions and
actions.” I would like to add that the people,
processes, and technologies need to cover
5 fields of expertise to turn data into insights:
1. Business process understanding
2. Business Intelligence
3. (Big) Data
4. Statistics
5. Security and data privacy
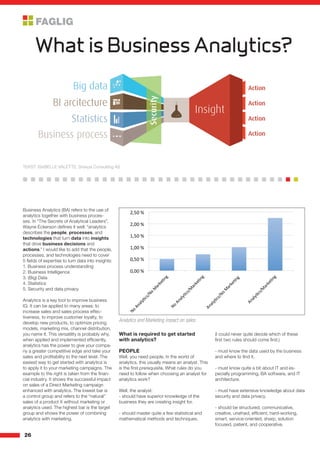
Analytics is a key tool to improve business
IQ. It can be applied to many areas: to
increase sales and sales process effec-
tiveness, to improve customer loyalty, to
develop new products, to optimize pricing
models, marketing mix, channel distribution,
you name it. This versatility is probably why,
when applied and implemented efficiently,
analytics has the power to give your compa-
ny a greater competitive edge and take your
sales and profitability to the next level. The
easiest way to get started with analytics is
to apply it to your marketing campaigns. The
example to the right is taken from the finan-
cial industry. It shows the successful impact
on sales of a Direct Marketing campaign
enhanced with analytics. The lowest bar is
a control group and refers to the “natural”
sales of a product X without marketing or
analytics used. The highest bar is the target
group and shows the power of combining
analytics with marketing.
What is required to get started
with analytics?
PEOPLE
Well, you need people. In the world of
analytics, this usually means an analyst. This
is the first prerequisite. What rules do you
need to follow when choosing an analyst for
analytics work?
Well, the analyst:
- should have superior knowledge of the
business they are creating insight for.
- should master quite a few statistical and
mathematical methods and techniques.
(I could never quite decide which of these
first two rules should come first.)
- must know the data used by the business
and where to find it.
- must know quite a bit about IT and es-
pecially programming, BA software, and IT
architecture.
- must have extensive knowledge about data
security and data privacy.
- should be structured, communicative,
creative, unafraid, efficient, hard-working,
smart, service-oriented, sharp, solution
focused, patient, and cooperative.
Analytics and Marketing impact on sales
2. 27
This very sexy job has recently found a fancy
tittle to go with it: data scientist.
BUSINESS
PROCESSES
There are 4 proces-
ses involved in
creating analytics: a
statistical process, a
data process, an IT
process, and a business process like sales,
marketing, or HR. The statistical process is a
must to produce analytics and often refers to
a statistical methodology. CRISP-DM (Cross
Industry Standard Process for Data Mining)
is a methodology often used by analysts to
create analytics. It focuses on the workflow
that extracts insight out of data using ap-
plied statistics (econometric modeling),
mathematics (multivariate analysis), and/or
machine learning (data mining).
When you start out with analytics, it is often
best to minimize the complexity around the
processes involved. The statistical process,
as we have seen, is a must. When it comes
to the other processes, try to simplify them
as much as possible to begin with. That’s
because, once the size of data and the
number of processes increase, analytics be-
comes more than just statistical techniques.
Why? Because this is when the require-
ments for analytics also increase in comple-
xity. If you have one task with little data, use
excel. If you have many tasks with a lot of
data, then you need the big analytical guns:
an IT architecture to handle massive data-
sets, analytics software to perform complex
analytical processes efficiently, and people
who know how to make all this stuff work.
IT or BUSINESS
INTELLIGENCE
ARCHITECTURE
Business intelli-
gence (BI) covers the
processes, methods,
and IT-solutions used
to provide fact based insight to the busi-
ness. BI is normally used in the company or
organization as a decision support system.
The platforms for BA and BI are intimately
connected with one another and the line
between the two can be vague. To simplify:
BI is like a magical hat, and the business
analyst is the magician pulling out the rabbit
(i.e. insights).
There are many ways to get started with
BA. I have seen amazing business insights
created with only the statistics tool’s func-
tionalities (Analysis ToolPak) in Excel, and
in the beginning, that might be sufficient to
produce insight. You can also download
Analytics software for free, such as RapidMi-
ner, R, or Python. If you are not very familiar
with various programming languages, I
would recommend RapidMiner; the user in-
terface is easiest to learn, the online tutorials
are sufficient, and the software runs on both
Windows and Mac OS X.
(BIG) DATA
Data refers to a
piece of information
or a fact. The terms
data, information,
and knowledge are
frequently used for
overlapping concepts. They represent,
however, different level of abstraction and
reasoning. Data is the lowest level, informa-
tion comes next, and finally, knowledge is
the highest level among all three. Predictions
are often seen as the highest form of know-
ledge creation. Predicting the future with
predictive analytics has been what one often
associates with analytics; however, it is only
one dimension of analytics. Descriptive and
prescriptive analytics can also create a lot of
value for your business.
“What is Big Data?” is a question that I get
asked a lot lately. In May 2011, the McKin-
sey Global Institute released a paper that
defines “Big Data” as “data sets whose size
is beyond the ability of typical software da-
tabase tools to capture, store, manage and
analyze.” Here we are not talking about gi-
gabytes, or a few terabytes, but hundreds or
even thousands of terabytes. In “Taming the
big data tidal wave”, Bill Franks digs into the
characteristics of this new source of data:
Volume, velocity, variety, and complexity.
IBM added another characteristic to “Big
Data”: Veracity. The volume of “Big Data” is
huge, no doubt about it. However, it is not
because it is big that it is insightful.
So, what is all the fuss around “Big Data”,
and how does it relate to analytics? “Big
Data” is nothing but a new source of data
(Twitter, Internet and phone logs, etc.) fed
into the analytical processes. Traditionally,
analytics started with building statistical
models on historical data. Past events, past
information, and past history were used to
predict the future. “Big Data” is a powerful
new source of information because it relates
very much to real time events and real time
action that, combined with all the history,
can become an explosively accurate and
informative input to create analytics. “Big
Data” can enhance the power of analytics. It
may also contribute to a change in the tradi-
tional way of looking at a customer; we may
see a swift change in the future: from valuing
the most loyal and/or the most profitable
customers to valuing the most loyal, profita-
ble, and/or the most influential customers.
Isabelle Valette
Head of Business Analytics
Sherpa Consulting
STATISTICS/
MATHEMATICS
TECHNIQUES
AND METHODS
The goal of analytics
is to create insights
generating true
business impact. Every field of research that
helps you achieve this is part of the analy-
tics methodology. The analyst must at all
times chose the tools that are best suited
and most appropriate to solve the busi-
ness problems at hands. John Chambers,
the eminent and distinguished statistician,
explains: “Greater Statistics can be defined
simply, if loosely, as everything connected
to learning from data, from the first plan-
ning or collection to the last presentation
and report.” In this aspect, many disciplines
will cross the path of “Greater Statistics” to
help extract insights from data: econometric
modeling, MapReduce algorithms, multi-
variate analysis, data mining, mathematical
or linguistic computation, SQL or Java
programming, geocoding, anthropology, etc.
The analyst would be wise to open his mind
to many fields to improve his/her insight
creation skills. Therefore debating the diffe-
rences between, and the respective value of,
different fields of insight creation is pointless,
since they have different role, purpose, and
benefits. The question anyone should ask is
“is this method or technique contributing to
the insight creation process?” If the answer
is yes, than this tool should be included in
the analytics methodology.
SECURITY &
DATA PRIVACY
The elephant in the
room is usually rela-
ted to privacy and se-
curity issues around
data usage. It is es-
pecially relevant with the emergence of “Big
Data” technology. Compliance challenges
are a great opportunity for resources from
different departments to come together,
brainstorm, and find consensus on how the
data is going to be used and not used. Once
consensus has been reached, one would be
advised to anchor the data usage guidelines
with top management to secure under-
standing, ownership, and approval on data
usage, privacy, and security.
To summarize, analytics is ultimately about
creating business value and having a busi-
ness impact.
I wish you all the best with your analytical
ambition.