Download to read offline


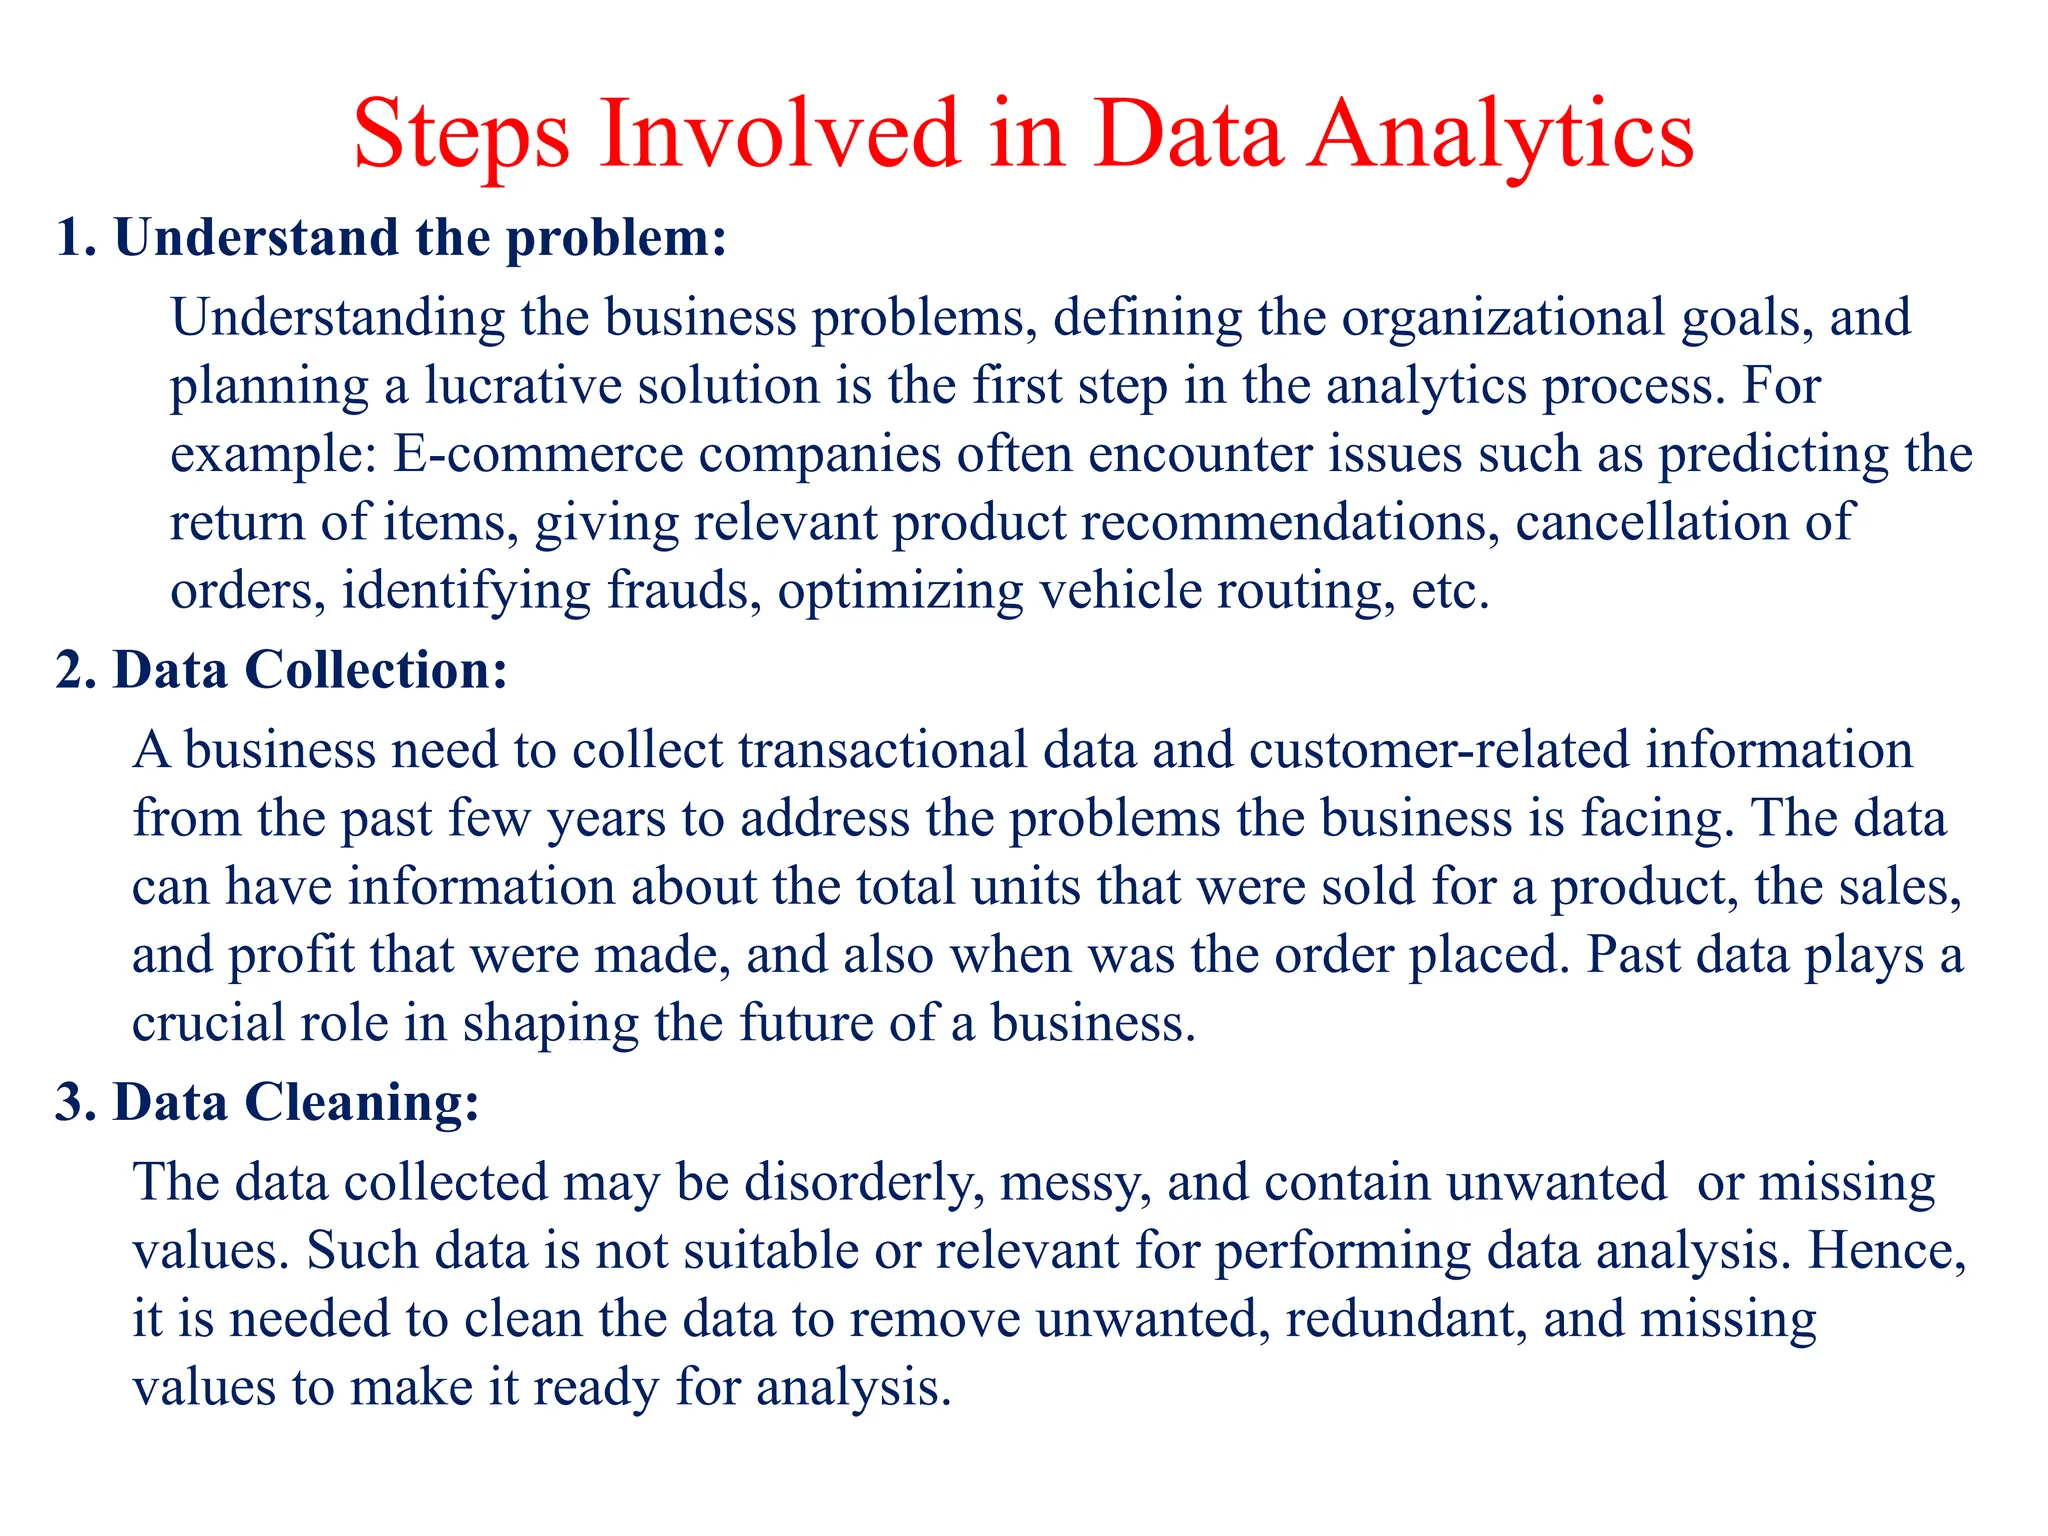


Business analytics transforms business data into insights for improved decision-making through statistical methods and computing technologies. The process involves understanding problems, collecting and cleaning data, analyzing it, and interpreting results to derive actionable insights. Key benefits include improved decision-making, business optimization, and competitive advantage, with applications in various sectors like retail, healthcare, and manufacturing.