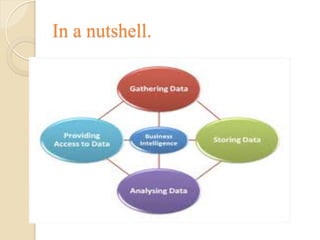
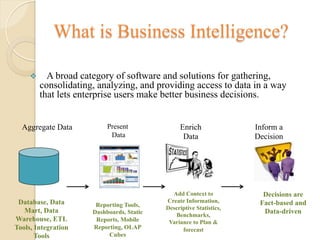
Basic Understanding of BUSINESS
INTELLIGENCE, DATAANALYTICS
and Data Visualization.
MSquare Systems Inc.,dba M-Square
What role does BI plays?
Ø BI addresses the specific business and technical challenges faced
by government agencies — including legacy systems, large data
volumes, data quality and consistency, diverse sets of users and
data security.
Ø Turn data into information that inspires understanding and
reduces the manual manipulation of reports.
Ø Empower analysts with user-driven Business Discovery
capabilities that enables them to quickly and easily explore data
in a natural way.
Ø Aggregate and analyze high volumes of data from multiple,
disparate sources.
Ø Search across all data quickly to see the big picture and make
better decisions to support the mission.
In a nutshell.
What is Business Intelligence?
v  A broad category of software and solutions for gathering,
consolidating, analyzing, and providing access to data in a way
that lets enterprise users make better business decisions.
Aggregate Data
Database, Data
Mart, Data
Warehouse, ETL
Tools, Integration
Tools
Present
Data
Enrich
Data
Inform a
Decision
Reporting Tools,
Dashboards, Static
Reports, Mobile
Reporting, OLAP
Cubes
Add Context to
Create Information,
Descriptive Statistics,
Benchmarks,
Variance to Plan &
forecast
Decisions are
Fact-based and
Data-driven
Business Intelligence Methods.
Ø  Advanced analytics
Ø  Reporting
Ø  Multidimensional
Ø  OLAP – Online
Analytical Processing on
complex data.
Ø  Mining visualization
Ø  Data warehousing
Business Intelligence Trends in
Ø Mobile
Ø Cloud
Ø Social Media
Ø Advanced Analytics
Taking it to the cloud!
Ø Cloud-based business
intelligence model DHS
can now access business
intelligence functionality in
a software as a service
model via a private cloud,
paying only for the
resources it uses.
What BI technologies will be the most important to your organization
in the next 3 years?
Ø  Predictive Analytics
Ø  Visualization/Dashboards
Ø  Master Data Management
Ø  The Cloud
Ø  Analytic Databases
Ø  Mobile BI
Ø  Open Source
Ø  Text Analytics
OLAP
Ø  Activities performed by end users
in online systems
v Specific, open-ended query generation
v SQL
v Ad hoc reports
v Statistical analysis
v Building DSS applications
Ø  Modeling and visualization
capabilities
Ø  Special class of tools
v DSS/BI/BA front ends
v Data access front ends
v Database front ends
v Visual information access systems
Data Mining
Ø Organizes and employs information and knowledge
from databases
Ø Statistical, mathematical, artificial intelligence, and
machine-learning techniques
Ø Automatic and fast
Ø Tools look for patterns
v Simple models
v Intermediate models
v Complex Models
Data Mining & Decission.
Ø Data mining application classes of problems
v Classification
v Clustering
v Association
v Sequencing
v Regression
v Forecasting
v Others
Ø Hypothesis or discovery driven
Ø Iterative
Ø Scalable
Knowledge Discovery in Databases
Ø Data mining used to find patterns in data
v Identification of data
v Preprocessing
v Transformation to common format
v Data mining through algorithms
v Evaluation
DataVisualization
Ø Technologies supporting
visualization and
interpretation
v Digital imaging, GIS, GUI,
tables, multi-dimensions,
graphs, VR, 3D, animation
v Identify relationships and
trends
Ø Data manipulation allows
real time look at
performance data
Multidimensionality
Ø Data organized according to business standards,
not analysts
Ø Conceptual
Ø Factors
v Dimensions
v Measures
v Time
Ø Significant overhead and storage
Ø Expensive
Ø Complex
Embracing Business Analytics and Optimization gives
organizations the answers they need to outperform
•  Information Strategy
•  Mastering Information
•  Business Analytics
Rapid, informed, confident decisions
consistent across the organization
Business
Value
Use OverTime
Top performers are more
likely to use an analytic
approach over intuition*
5.4x
*within business processes
What does Data Analytics
mean?
Ø  Data analytics refers to qualitative and
quantitative techniques and processes
used to enhance productivity and business
gain.
Ø  Data is extracted and categorize to
identify and analyze behavioral data and
patterns, and techniques vary according to
organizational requirements.
Ø  Exploratory data analysis
(EDA), where new features in
the data are discovered, and
Ø  Confirmatory data analysis
(CDA), where existing
hypotheses are proven true or
false.
Ø  Qualitative data analysis (QDA)
is used in the social sciences to
draw conclusions from non-
numerical data like words,
photographs or video.
Its broadly classified into
Relational Data (Tables/Transaction/
Legacy Data)
Text Data (Web)
Semi-structured Data (XML)
Graph Data
Social Network, Semantic
Web(RDF), …
Streaming Data
You can only scan the data once
Support & Partner
Getting Started or Support –
Muthu Natarajan
muthu.n@msquaresystems.com.
www.msquaresystems.com
Phone: 703-222-5500/202-400-5003.

Business intelligence data analytics-visualization

  • 1.
    Basic Understanding ofBUSINESS INTELLIGENCE, DATAANALYTICS and Data Visualization. MSquare Systems Inc.,dba M-Square
  • 2.
    What role doesBI plays? Ø BI addresses the specific business and technical challenges faced by government agencies — including legacy systems, large data volumes, data quality and consistency, diverse sets of users and data security. Ø Turn data into information that inspires understanding and reduces the manual manipulation of reports. Ø Empower analysts with user-driven Business Discovery capabilities that enables them to quickly and easily explore data in a natural way. Ø Aggregate and analyze high volumes of data from multiple, disparate sources. Ø Search across all data quickly to see the big picture and make better decisions to support the mission.
  • 3.
  • 4.
    What is BusinessIntelligence? v  A broad category of software and solutions for gathering, consolidating, analyzing, and providing access to data in a way that lets enterprise users make better business decisions. Aggregate Data Database, Data Mart, Data Warehouse, ETL Tools, Integration Tools Present Data Enrich Data Inform a Decision Reporting Tools, Dashboards, Static Reports, Mobile Reporting, OLAP Cubes Add Context to Create Information, Descriptive Statistics, Benchmarks, Variance to Plan & forecast Decisions are Fact-based and Data-driven
  • 5.
    Business Intelligence Methods. Ø Advanced analytics Ø  Reporting Ø  Multidimensional Ø  OLAP – Online Analytical Processing on complex data. Ø  Mining visualization Ø  Data warehousing
  • 6.
    Business Intelligence Trendsin Ø Mobile Ø Cloud Ø Social Media Ø Advanced Analytics
  • 7.
    Taking it tothe cloud! Ø Cloud-based business intelligence model DHS can now access business intelligence functionality in a software as a service model via a private cloud, paying only for the resources it uses.
  • 8.
    What BI technologieswill be the most important to your organization in the next 3 years? Ø  Predictive Analytics Ø  Visualization/Dashboards Ø  Master Data Management Ø  The Cloud Ø  Analytic Databases Ø  Mobile BI Ø  Open Source Ø  Text Analytics
  • 9.
    OLAP Ø  Activities performedby end users in online systems v Specific, open-ended query generation v SQL v Ad hoc reports v Statistical analysis v Building DSS applications Ø  Modeling and visualization capabilities Ø  Special class of tools v DSS/BI/BA front ends v Data access front ends v Database front ends v Visual information access systems
  • 10.
    Data Mining Ø Organizes andemploys information and knowledge from databases Ø Statistical, mathematical, artificial intelligence, and machine-learning techniques Ø Automatic and fast Ø Tools look for patterns v Simple models v Intermediate models v Complex Models
  • 11.
    Data Mining &Decission. Ø Data mining application classes of problems v Classification v Clustering v Association v Sequencing v Regression v Forecasting v Others Ø Hypothesis or discovery driven Ø Iterative Ø Scalable
  • 12.
    Knowledge Discovery inDatabases Ø Data mining used to find patterns in data v Identification of data v Preprocessing v Transformation to common format v Data mining through algorithms v Evaluation
  • 13.
    DataVisualization Ø Technologies supporting visualization and interpretation v Digitalimaging, GIS, GUI, tables, multi-dimensions, graphs, VR, 3D, animation v Identify relationships and trends Ø Data manipulation allows real time look at performance data
  • 14.
    Multidimensionality Ø Data organized accordingto business standards, not analysts Ø Conceptual Ø Factors v Dimensions v Measures v Time Ø Significant overhead and storage Ø Expensive Ø Complex
  • 15.
    Embracing Business Analyticsand Optimization gives organizations the answers they need to outperform •  Information Strategy •  Mastering Information •  Business Analytics Rapid, informed, confident decisions consistent across the organization Business Value Use OverTime Top performers are more likely to use an analytic approach over intuition* 5.4x *within business processes
  • 16.
    What does DataAnalytics mean? Ø  Data analytics refers to qualitative and quantitative techniques and processes used to enhance productivity and business gain. Ø  Data is extracted and categorize to identify and analyze behavioral data and patterns, and techniques vary according to organizational requirements.
  • 17.
    Ø  Exploratory dataanalysis (EDA), where new features in the data are discovered, and Ø  Confirmatory data analysis (CDA), where existing hypotheses are proven true or false. Ø  Qualitative data analysis (QDA) is used in the social sciences to draw conclusions from non- numerical data like words, photographs or video. Its broadly classified into
  • 18.
    Relational Data (Tables/Transaction/ LegacyData) Text Data (Web) Semi-structured Data (XML) Graph Data Social Network, Semantic Web(RDF), … Streaming Data You can only scan the data once
  • 19.
    Support & Partner GettingStarted or Support – Muthu Natarajan muthu.n@msquaresystems.com. www.msquaresystems.com Phone: 703-222-5500/202-400-5003.