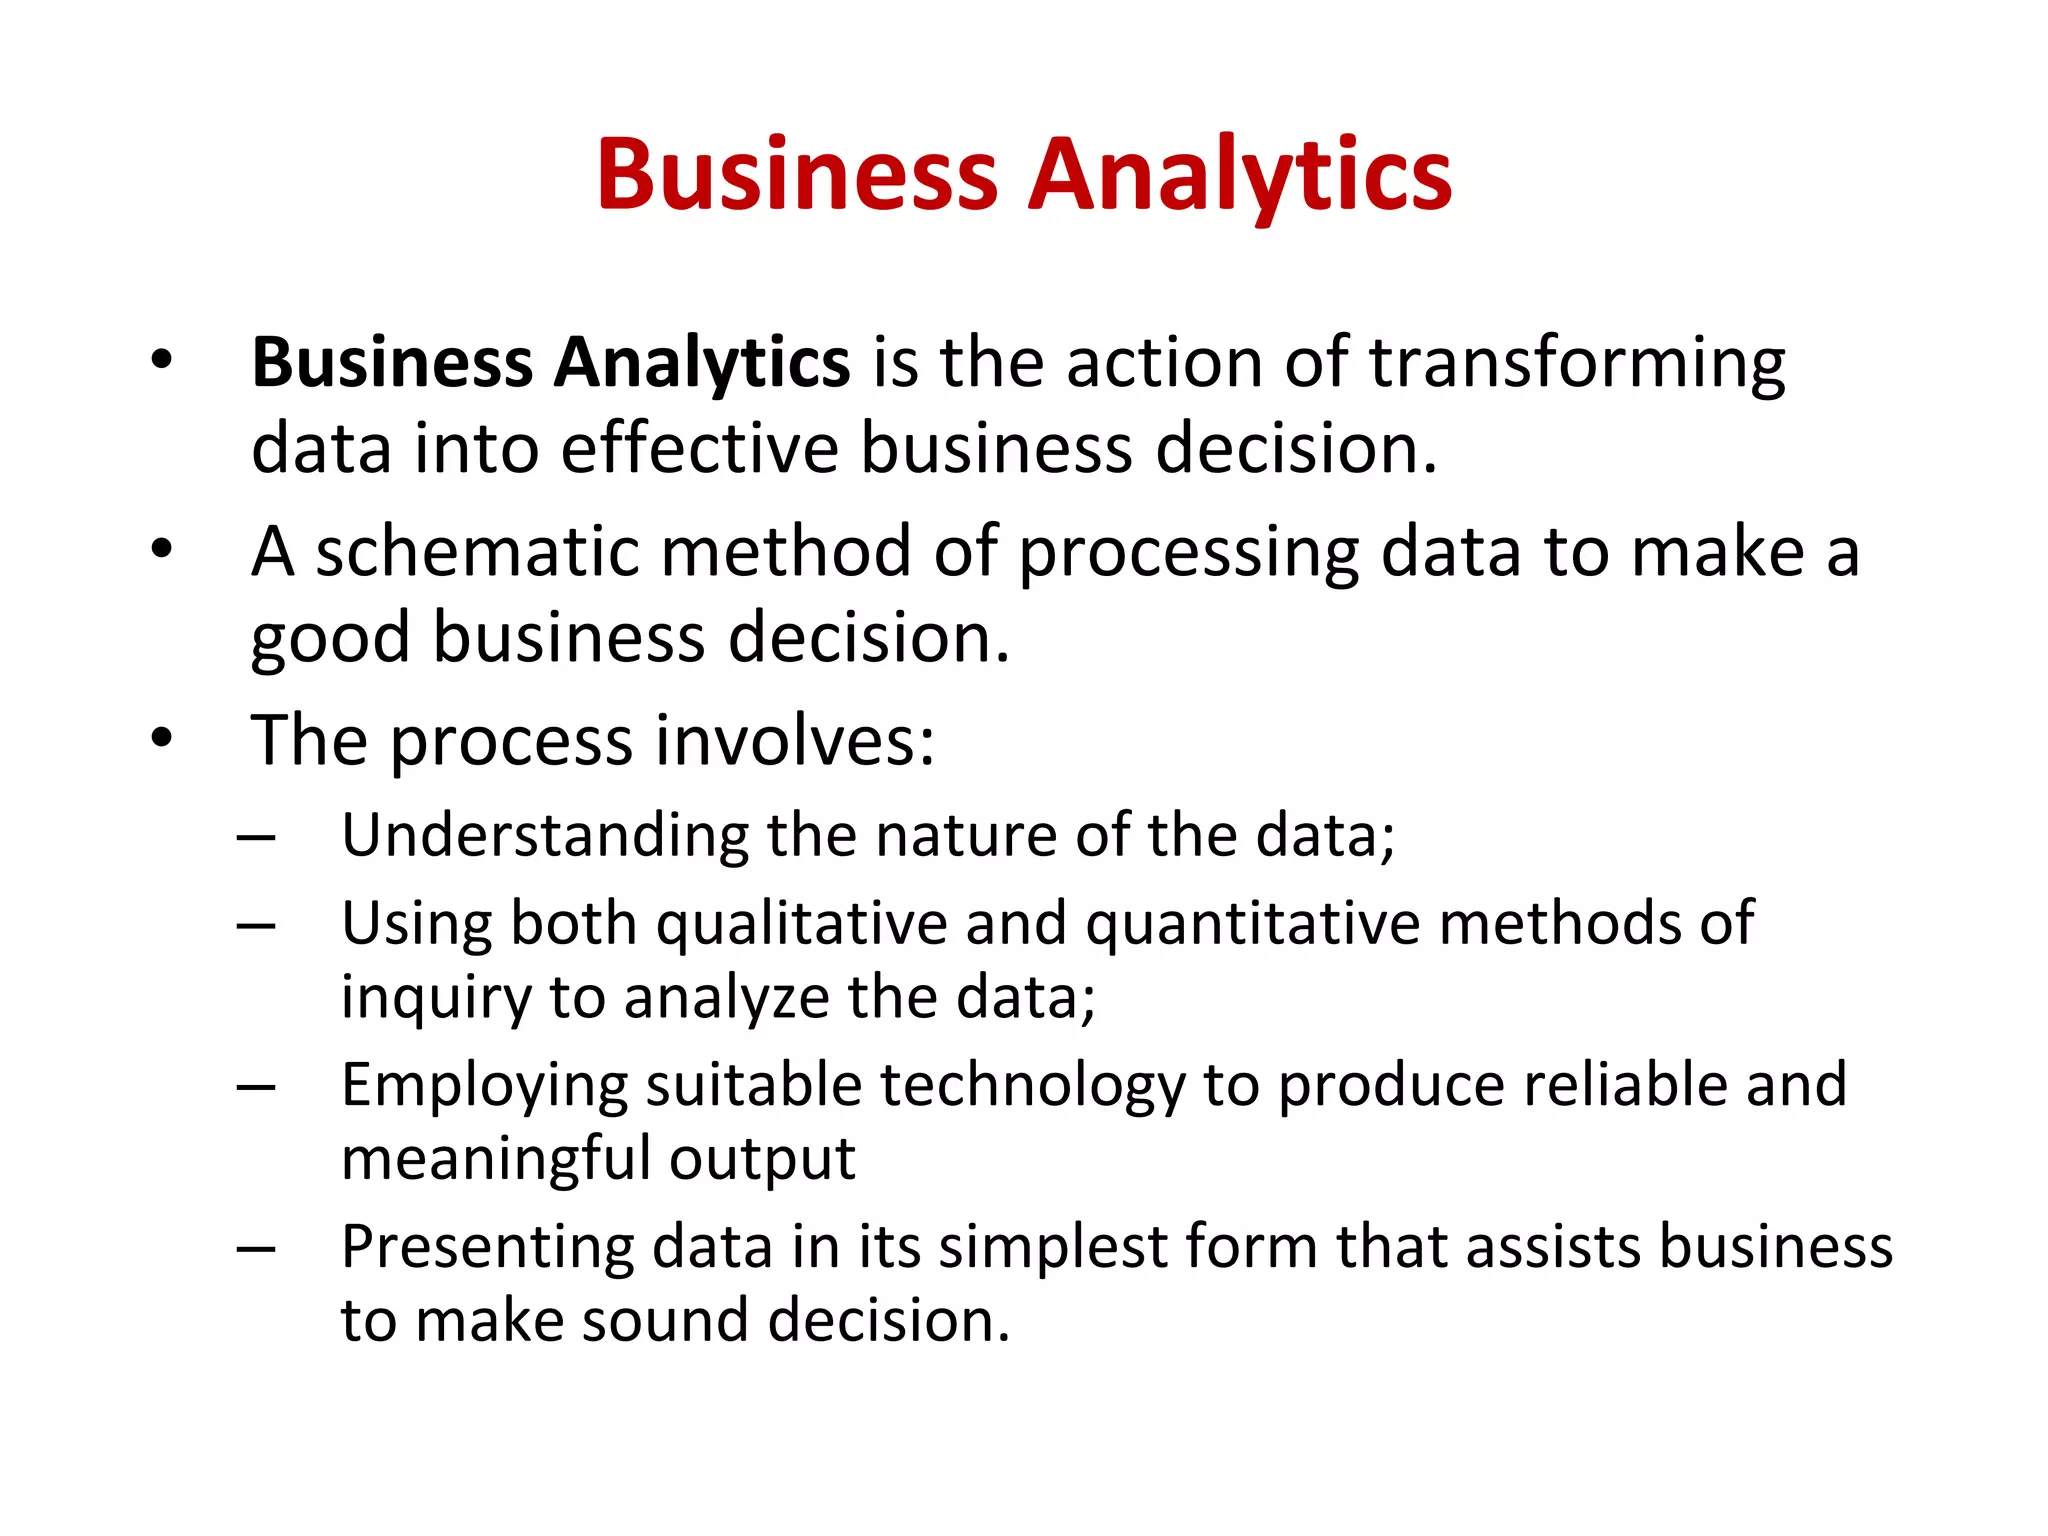
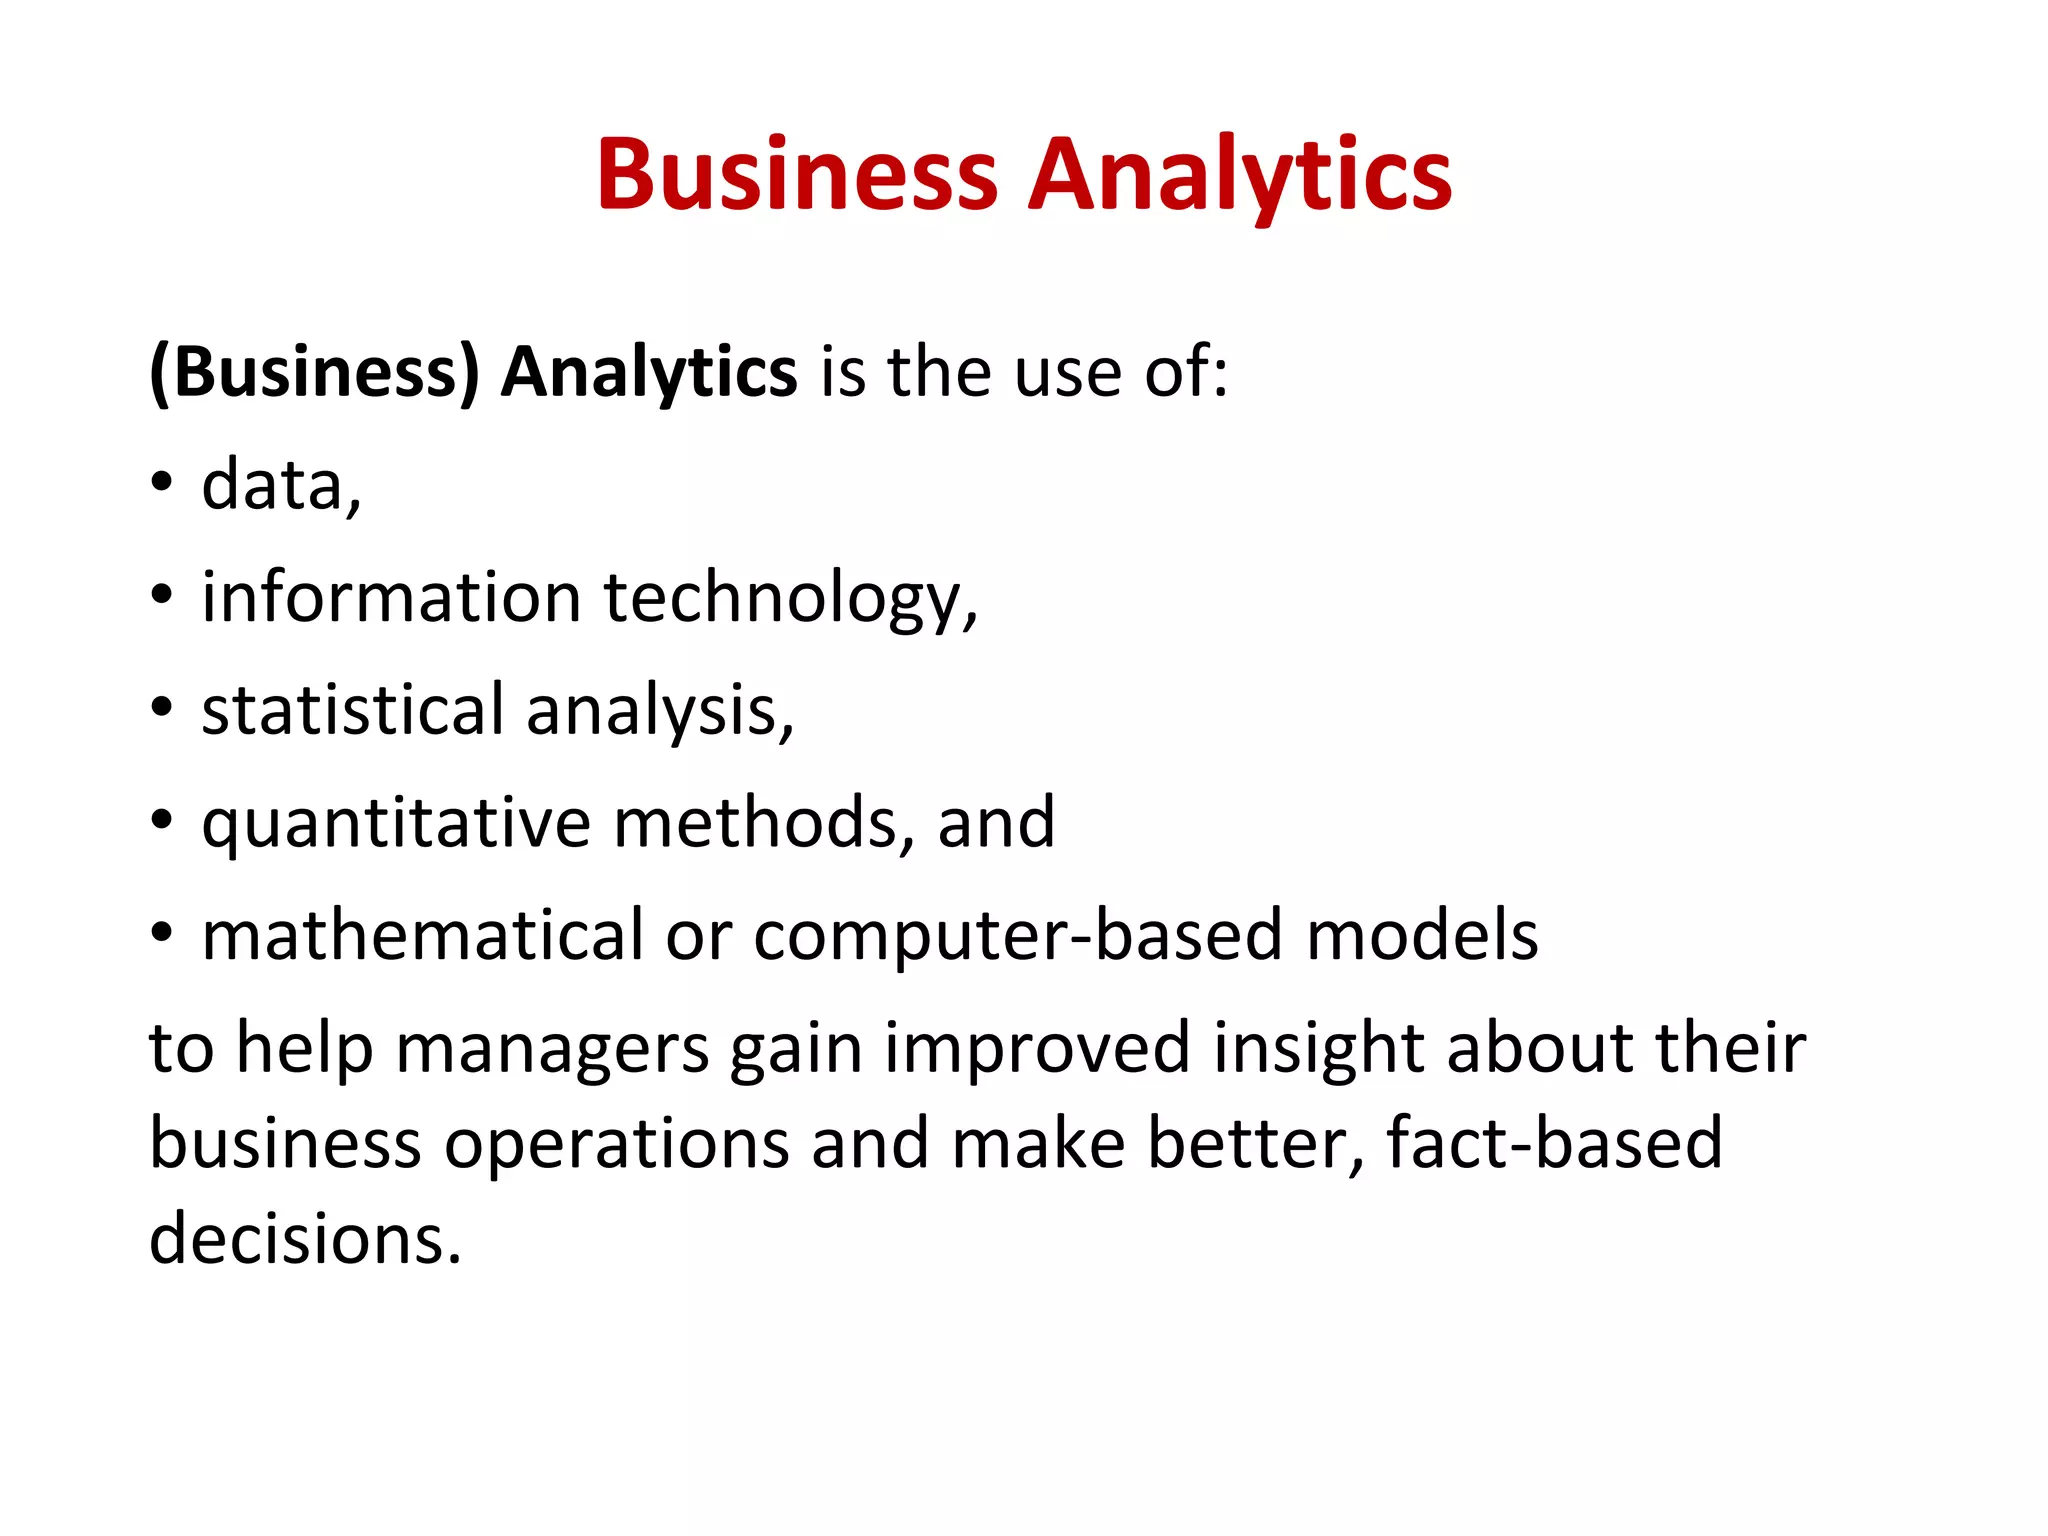
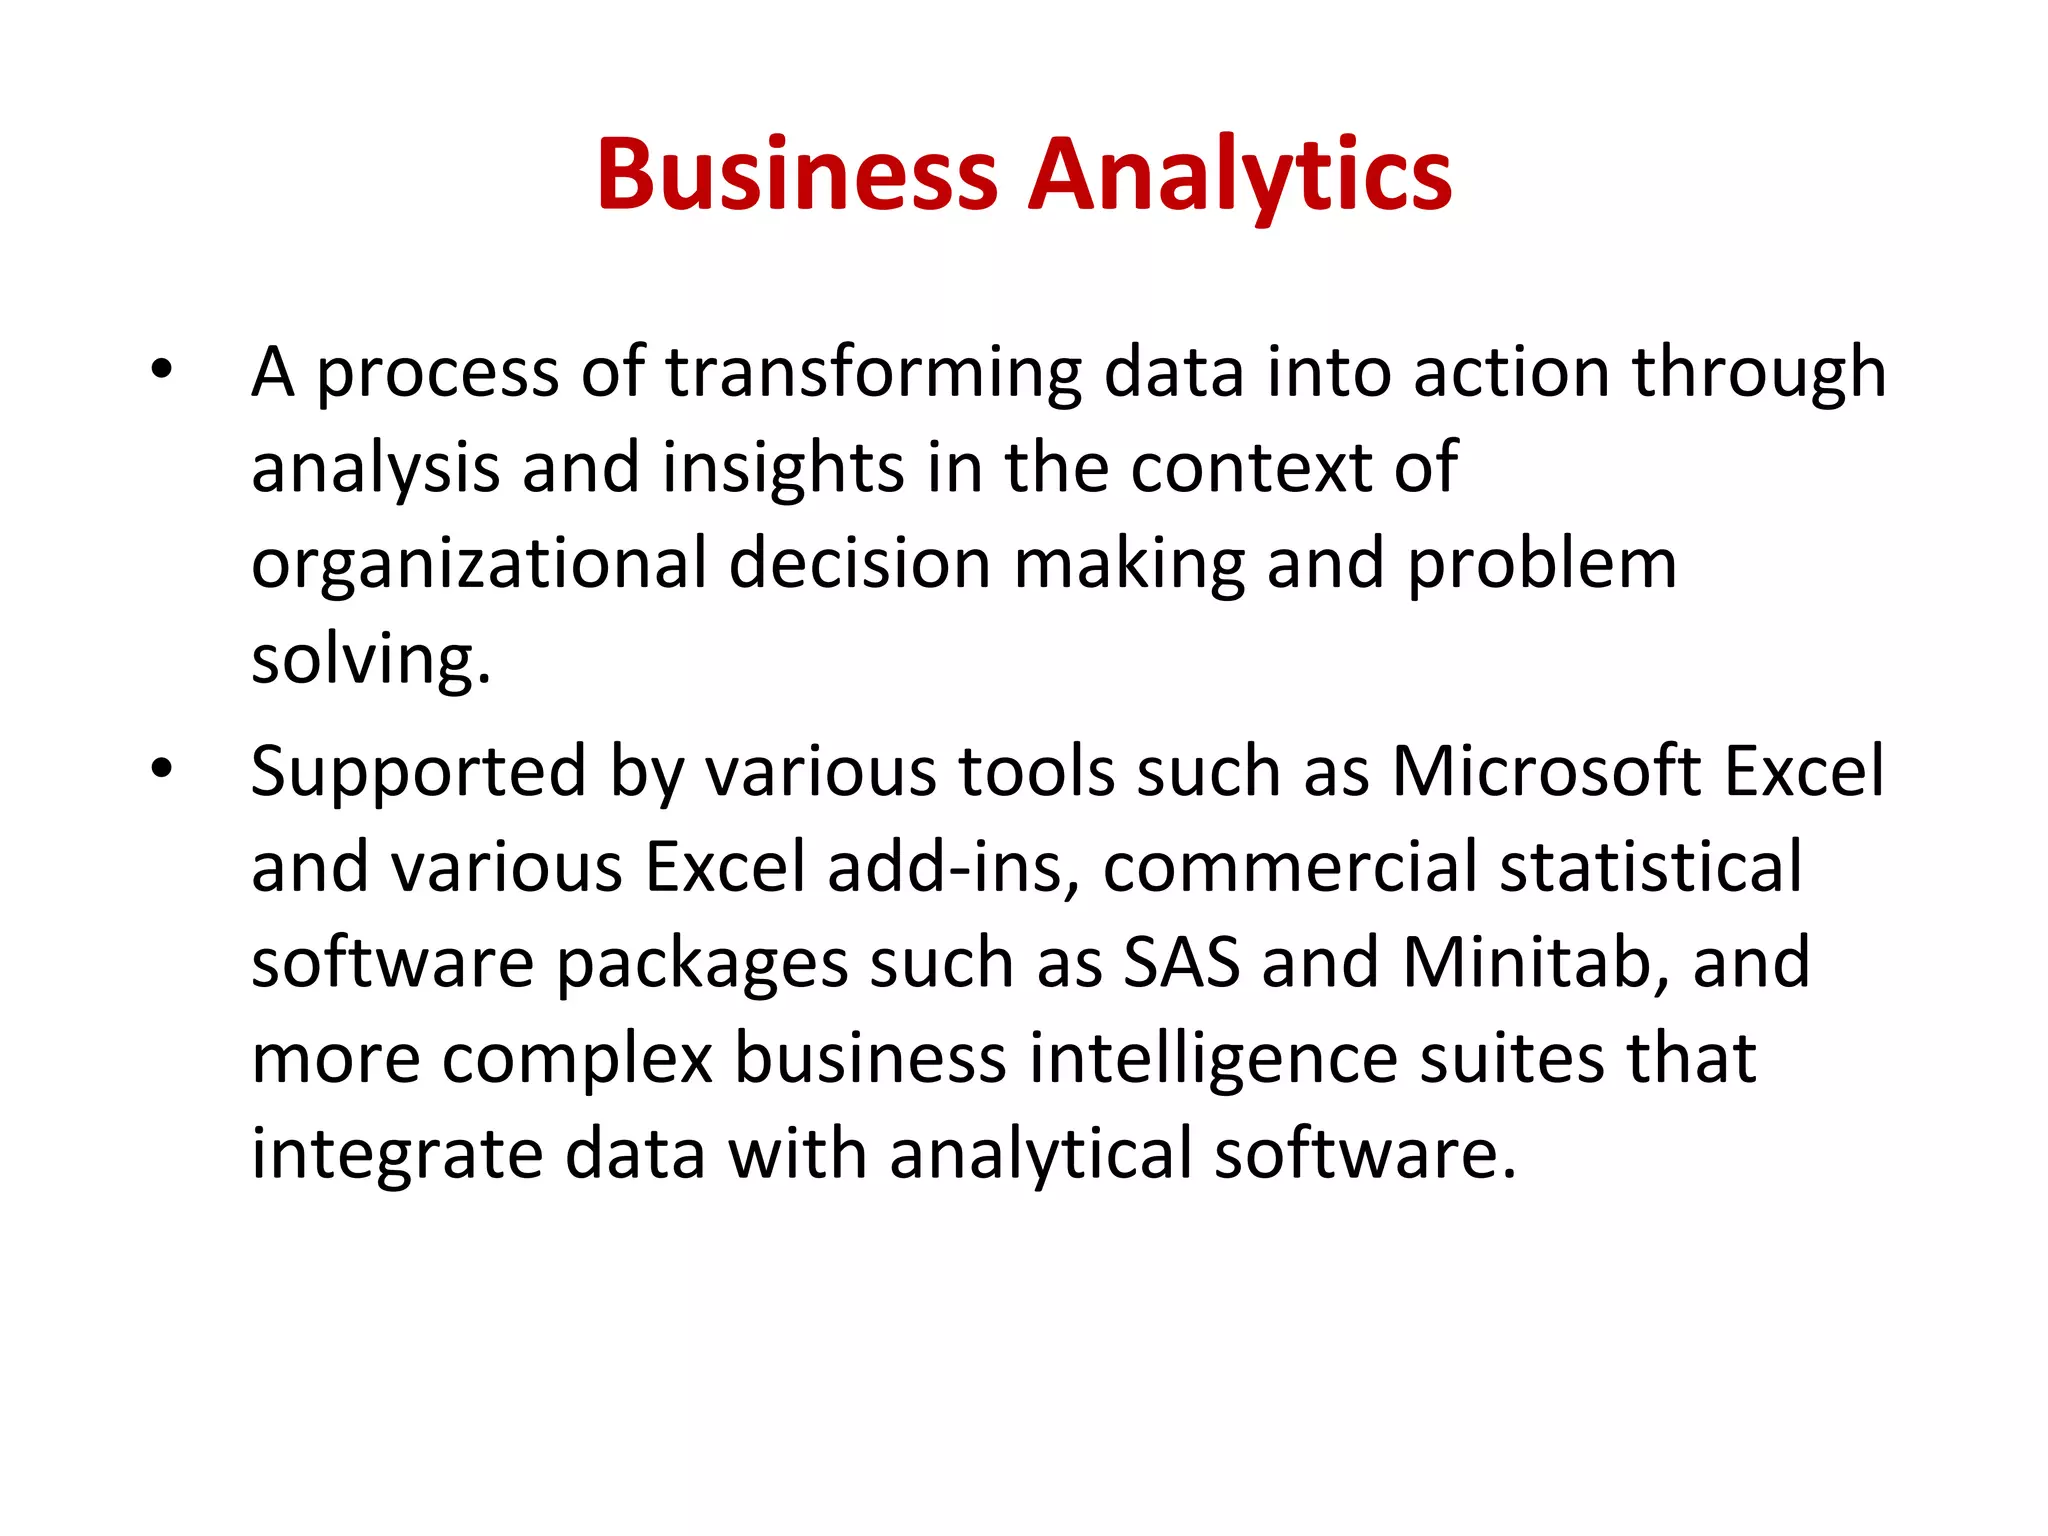
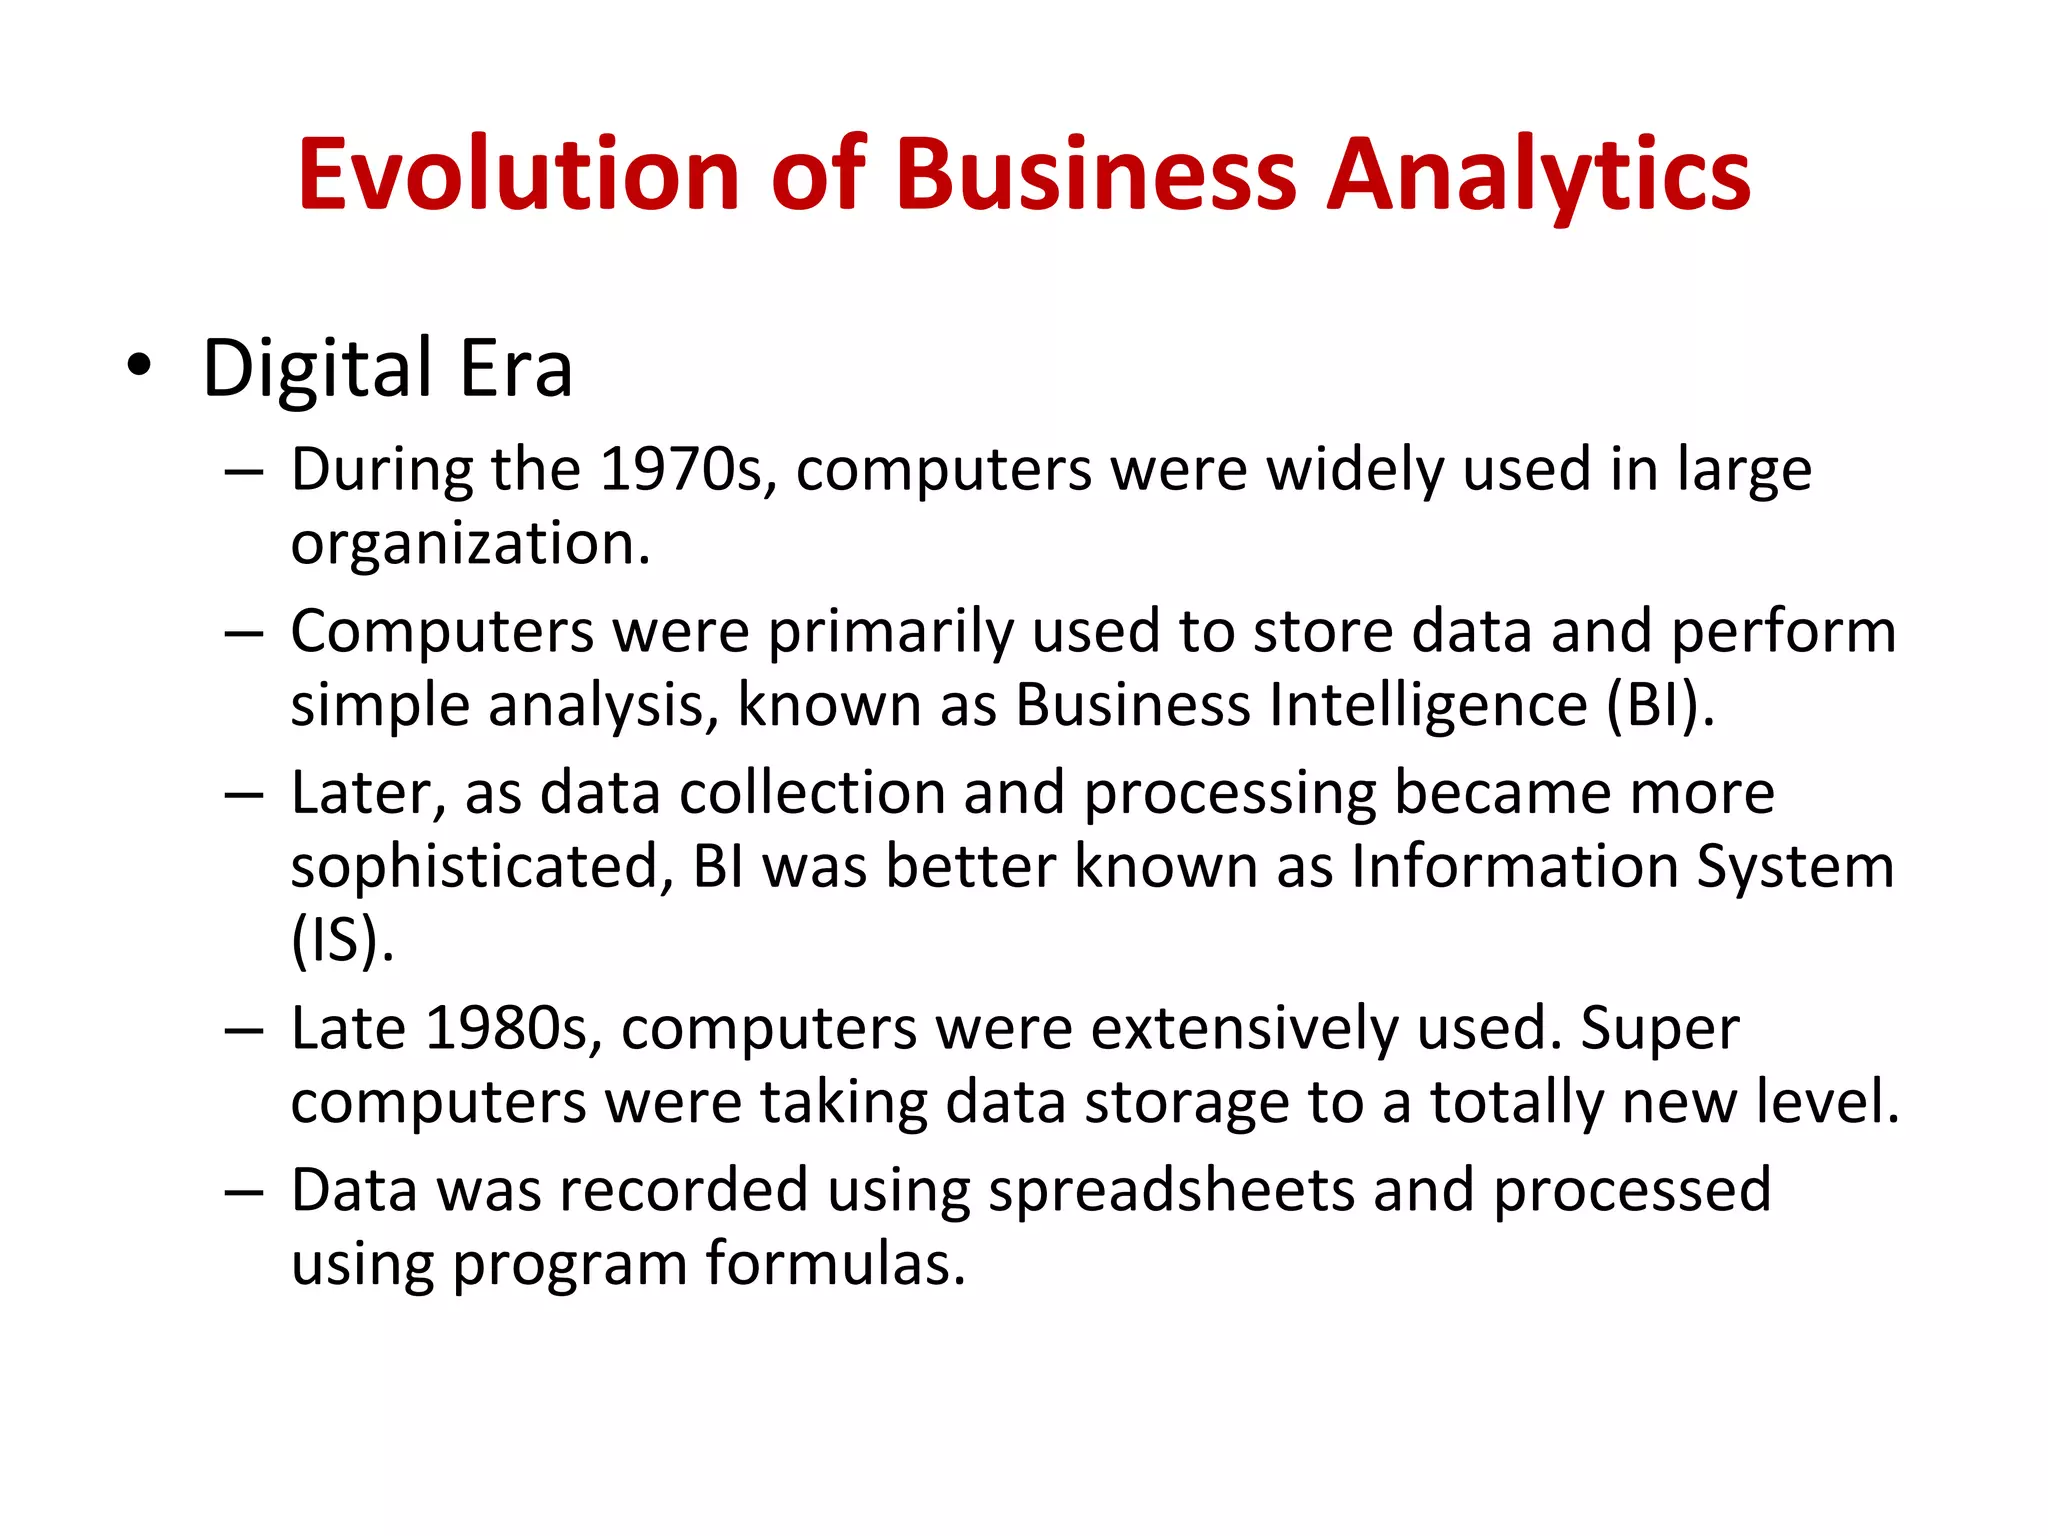
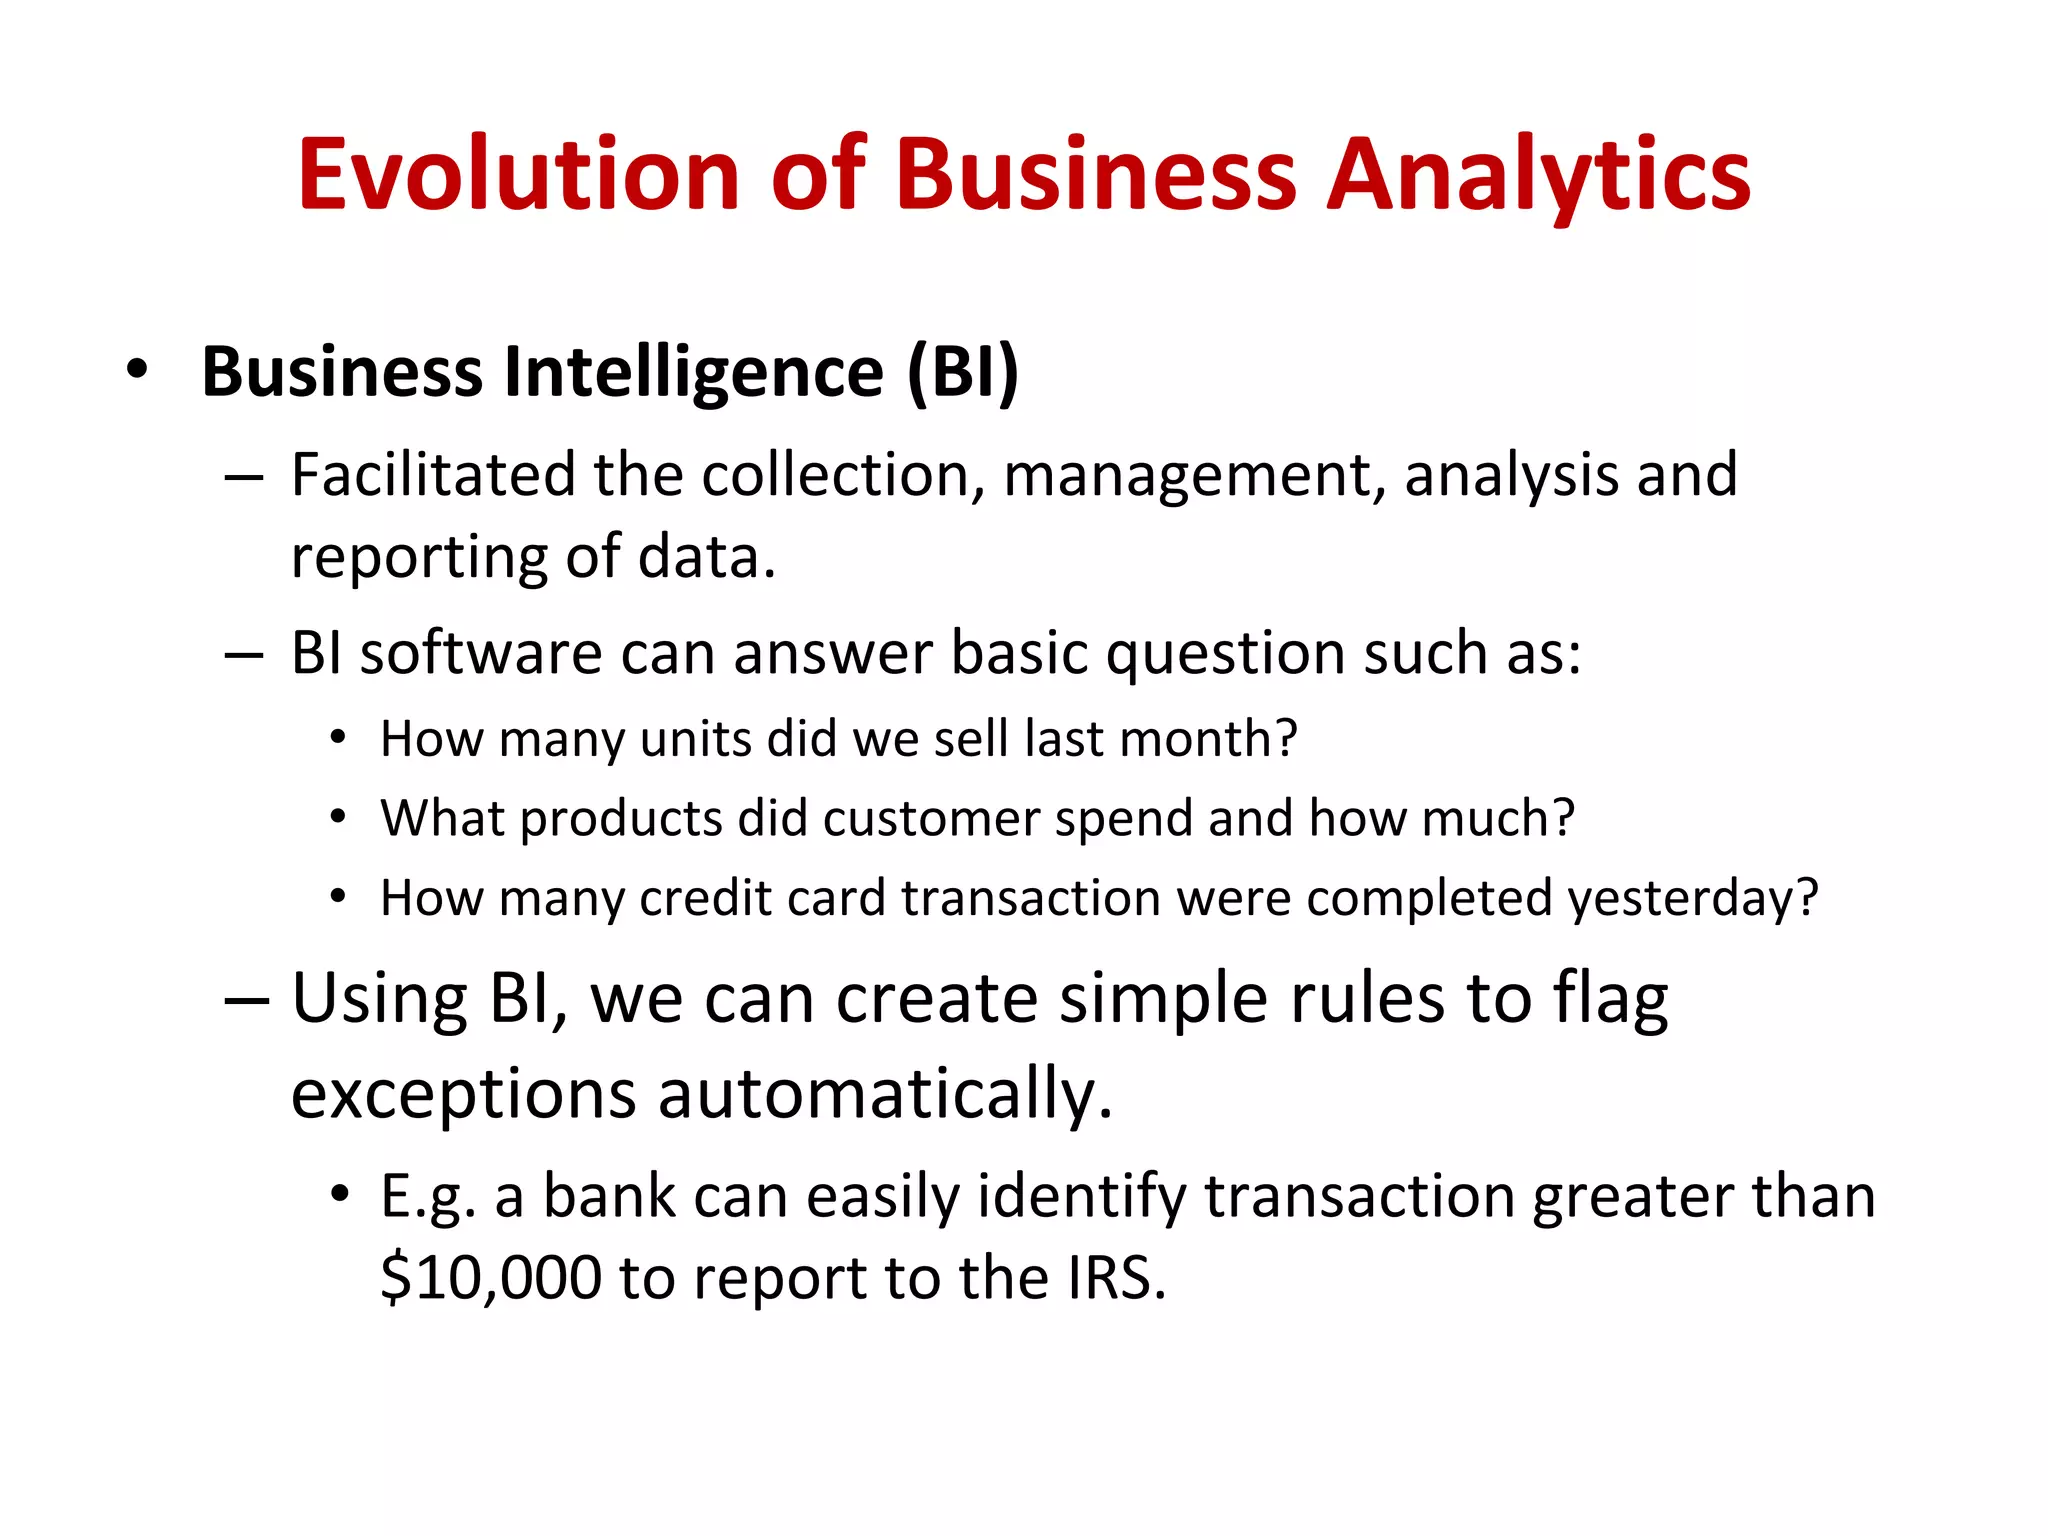
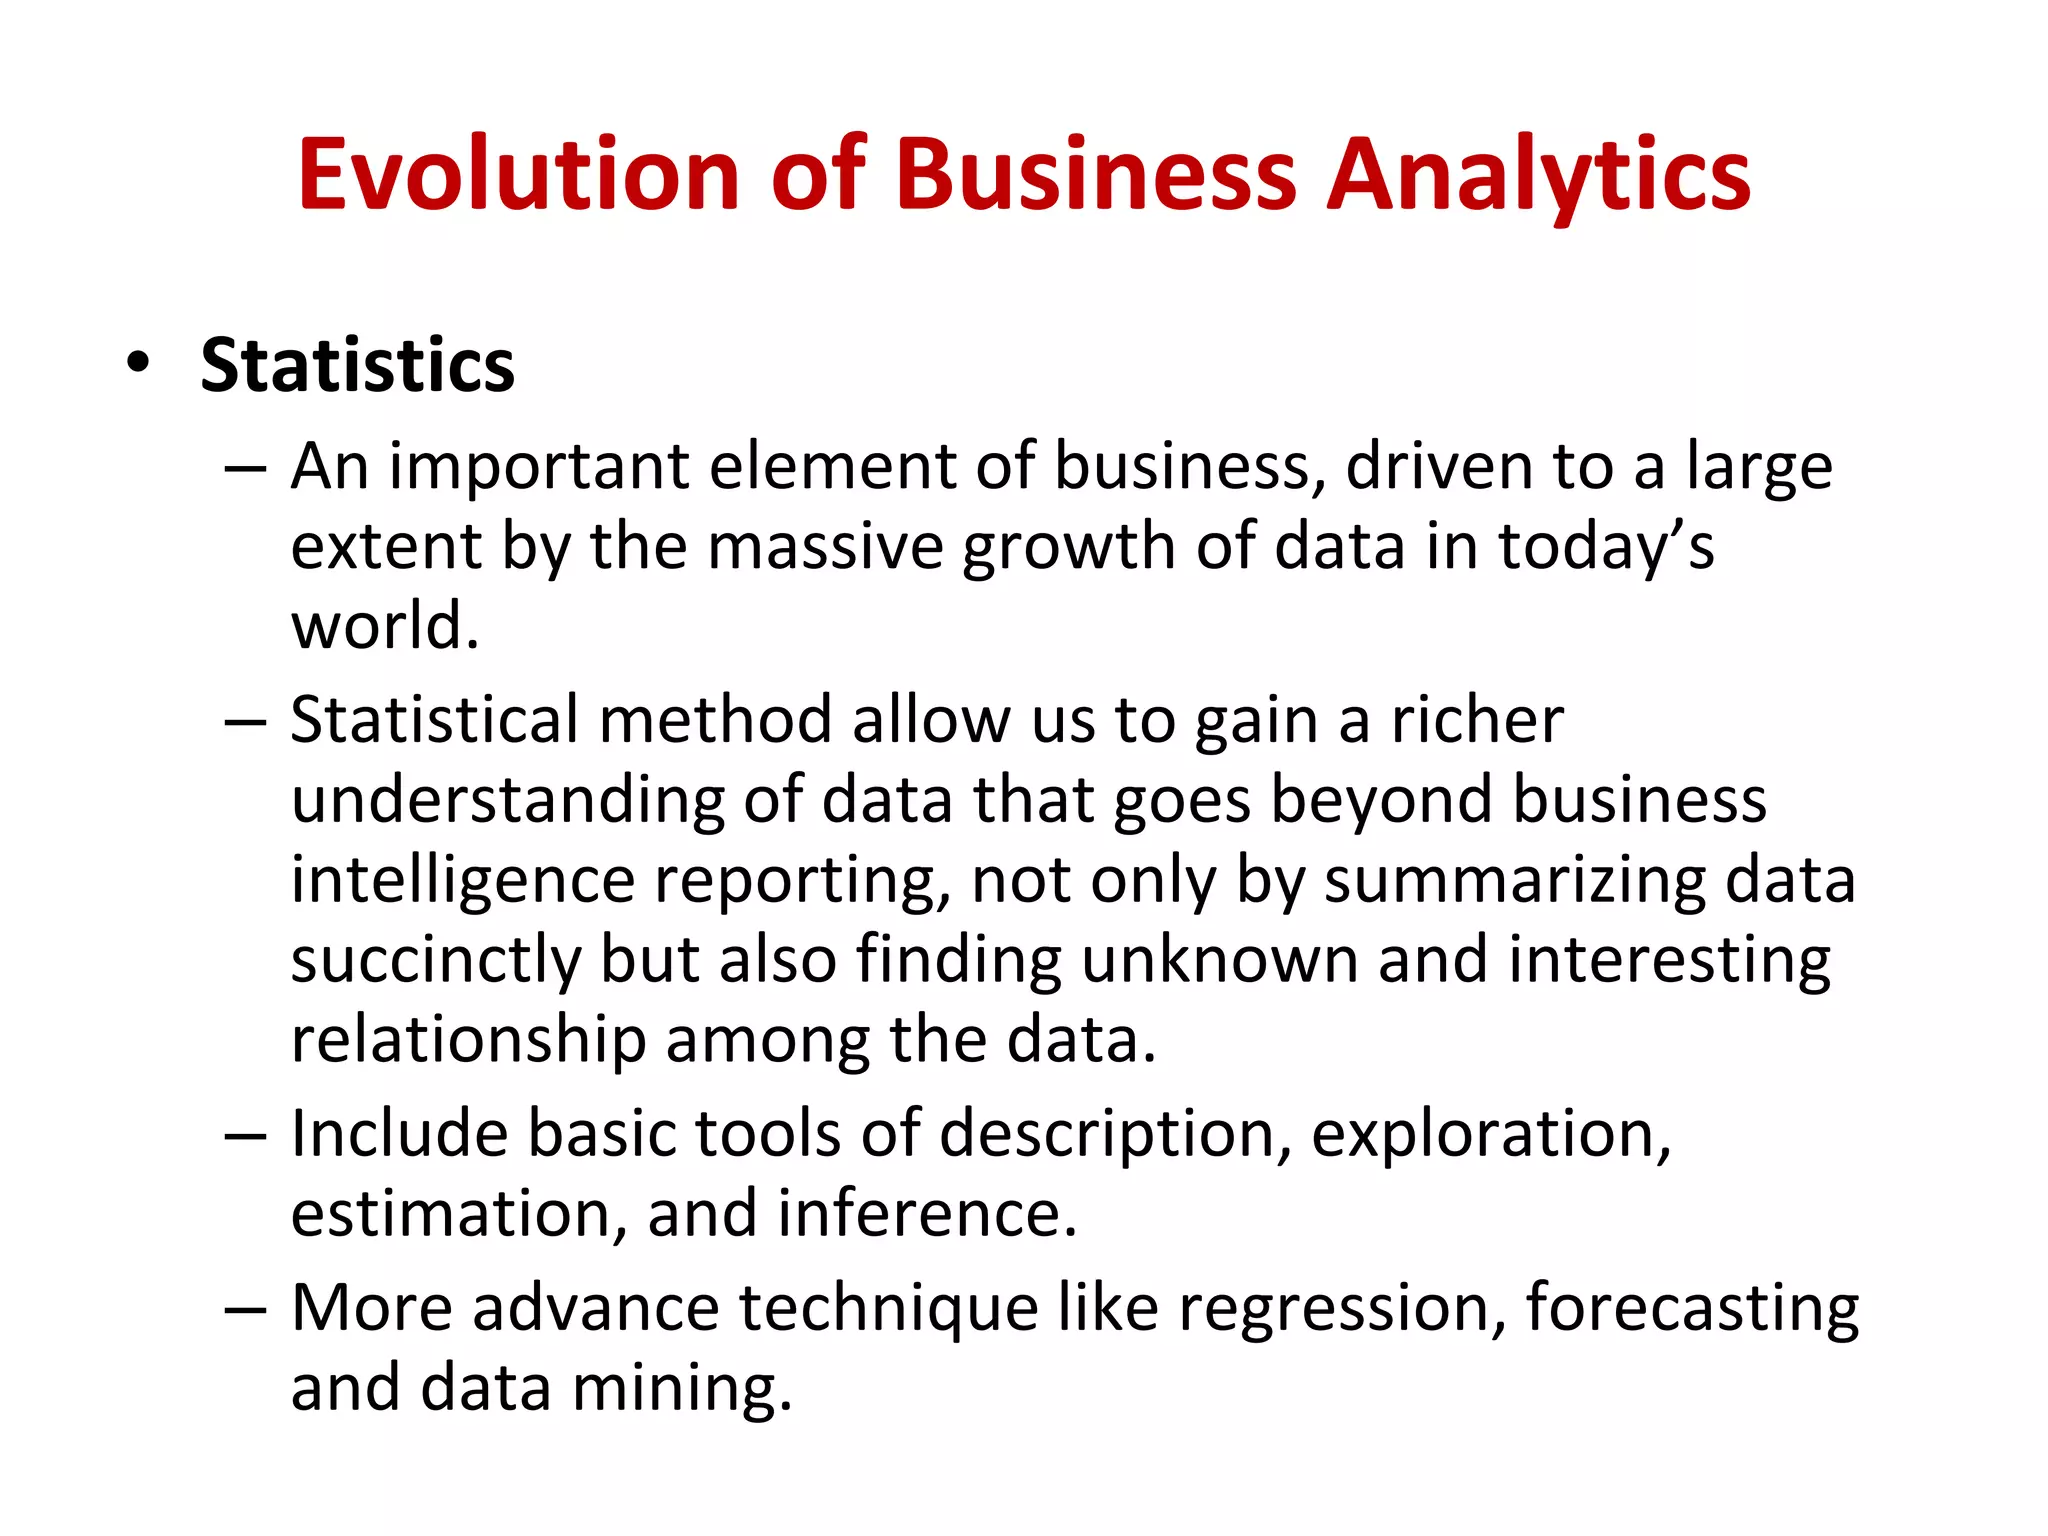
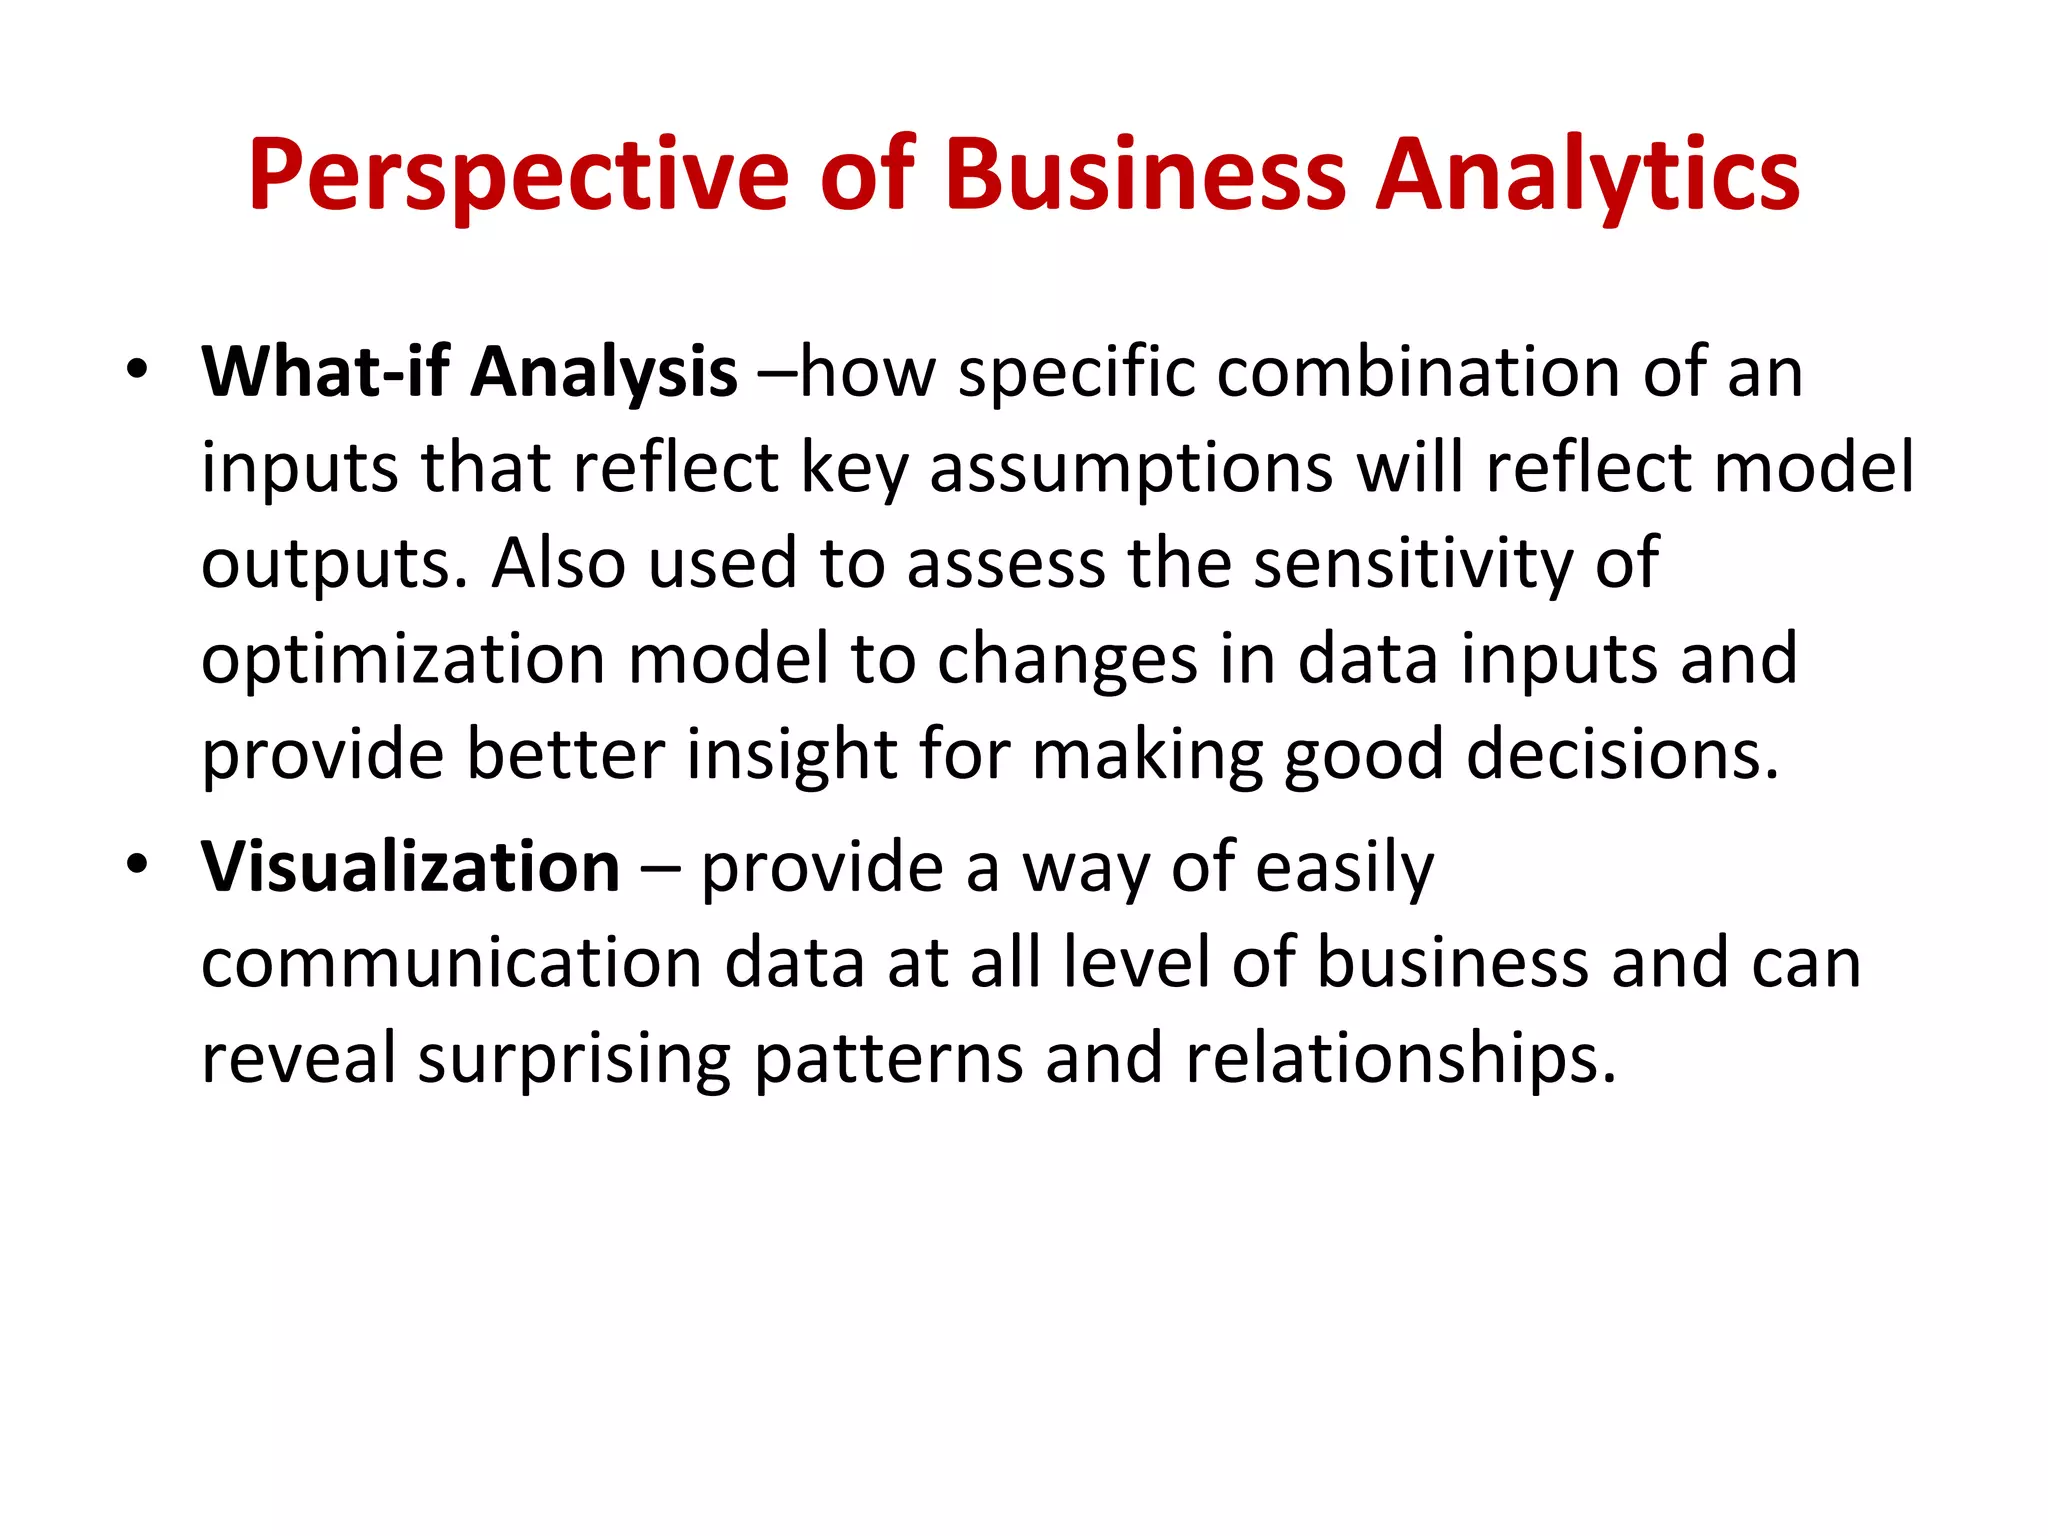
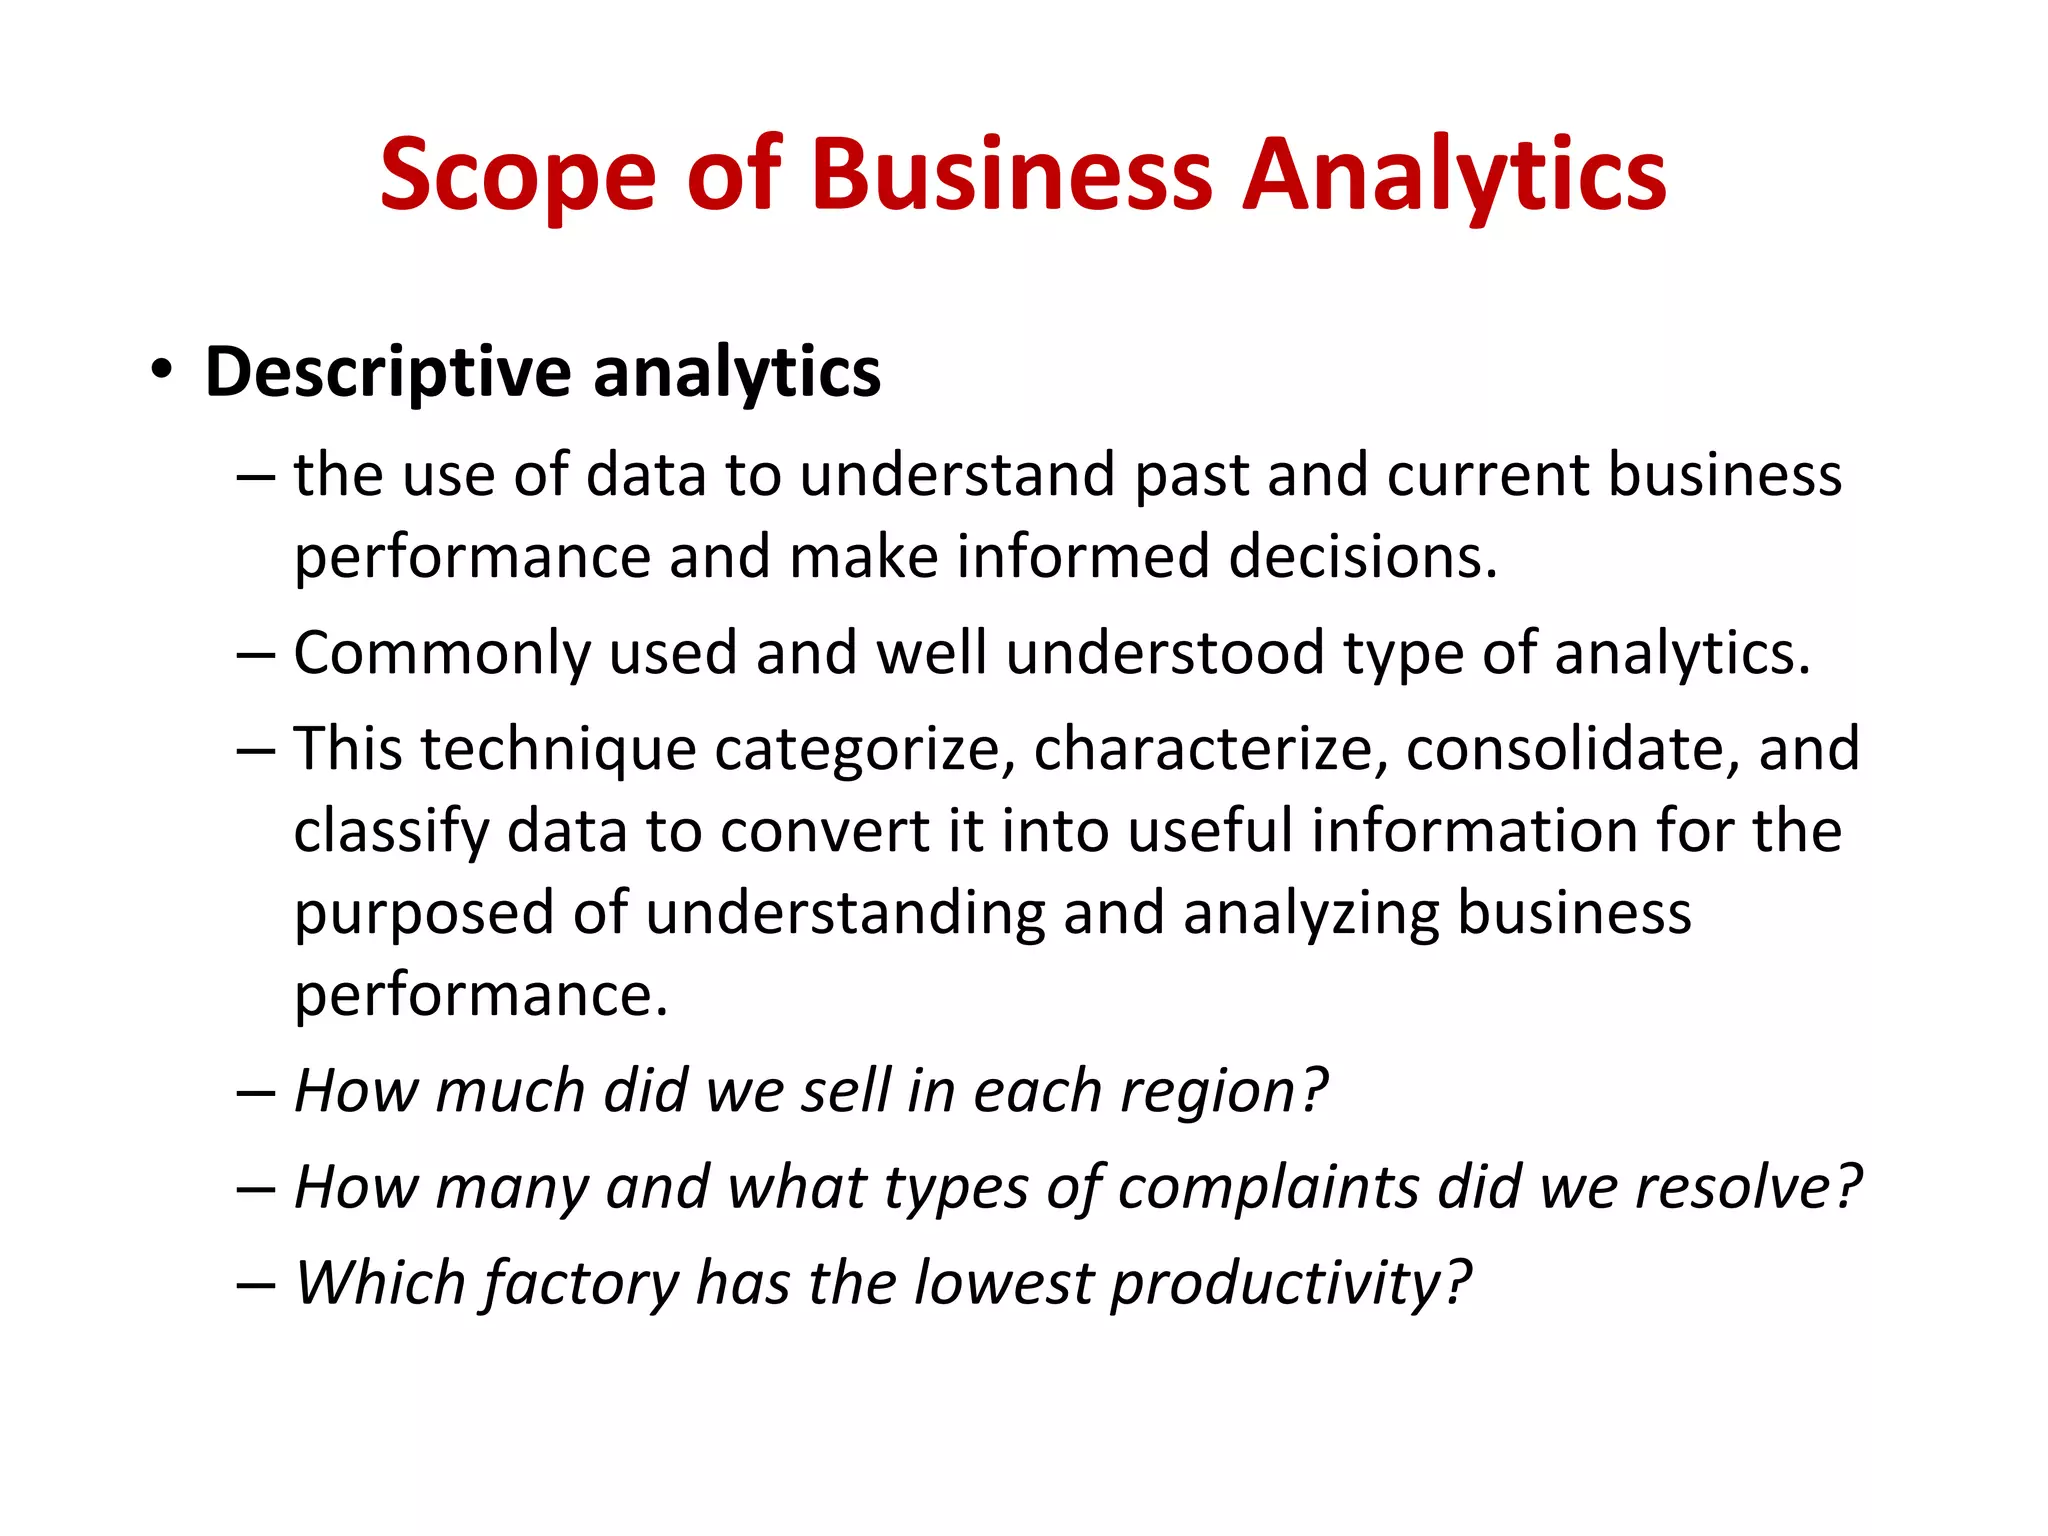
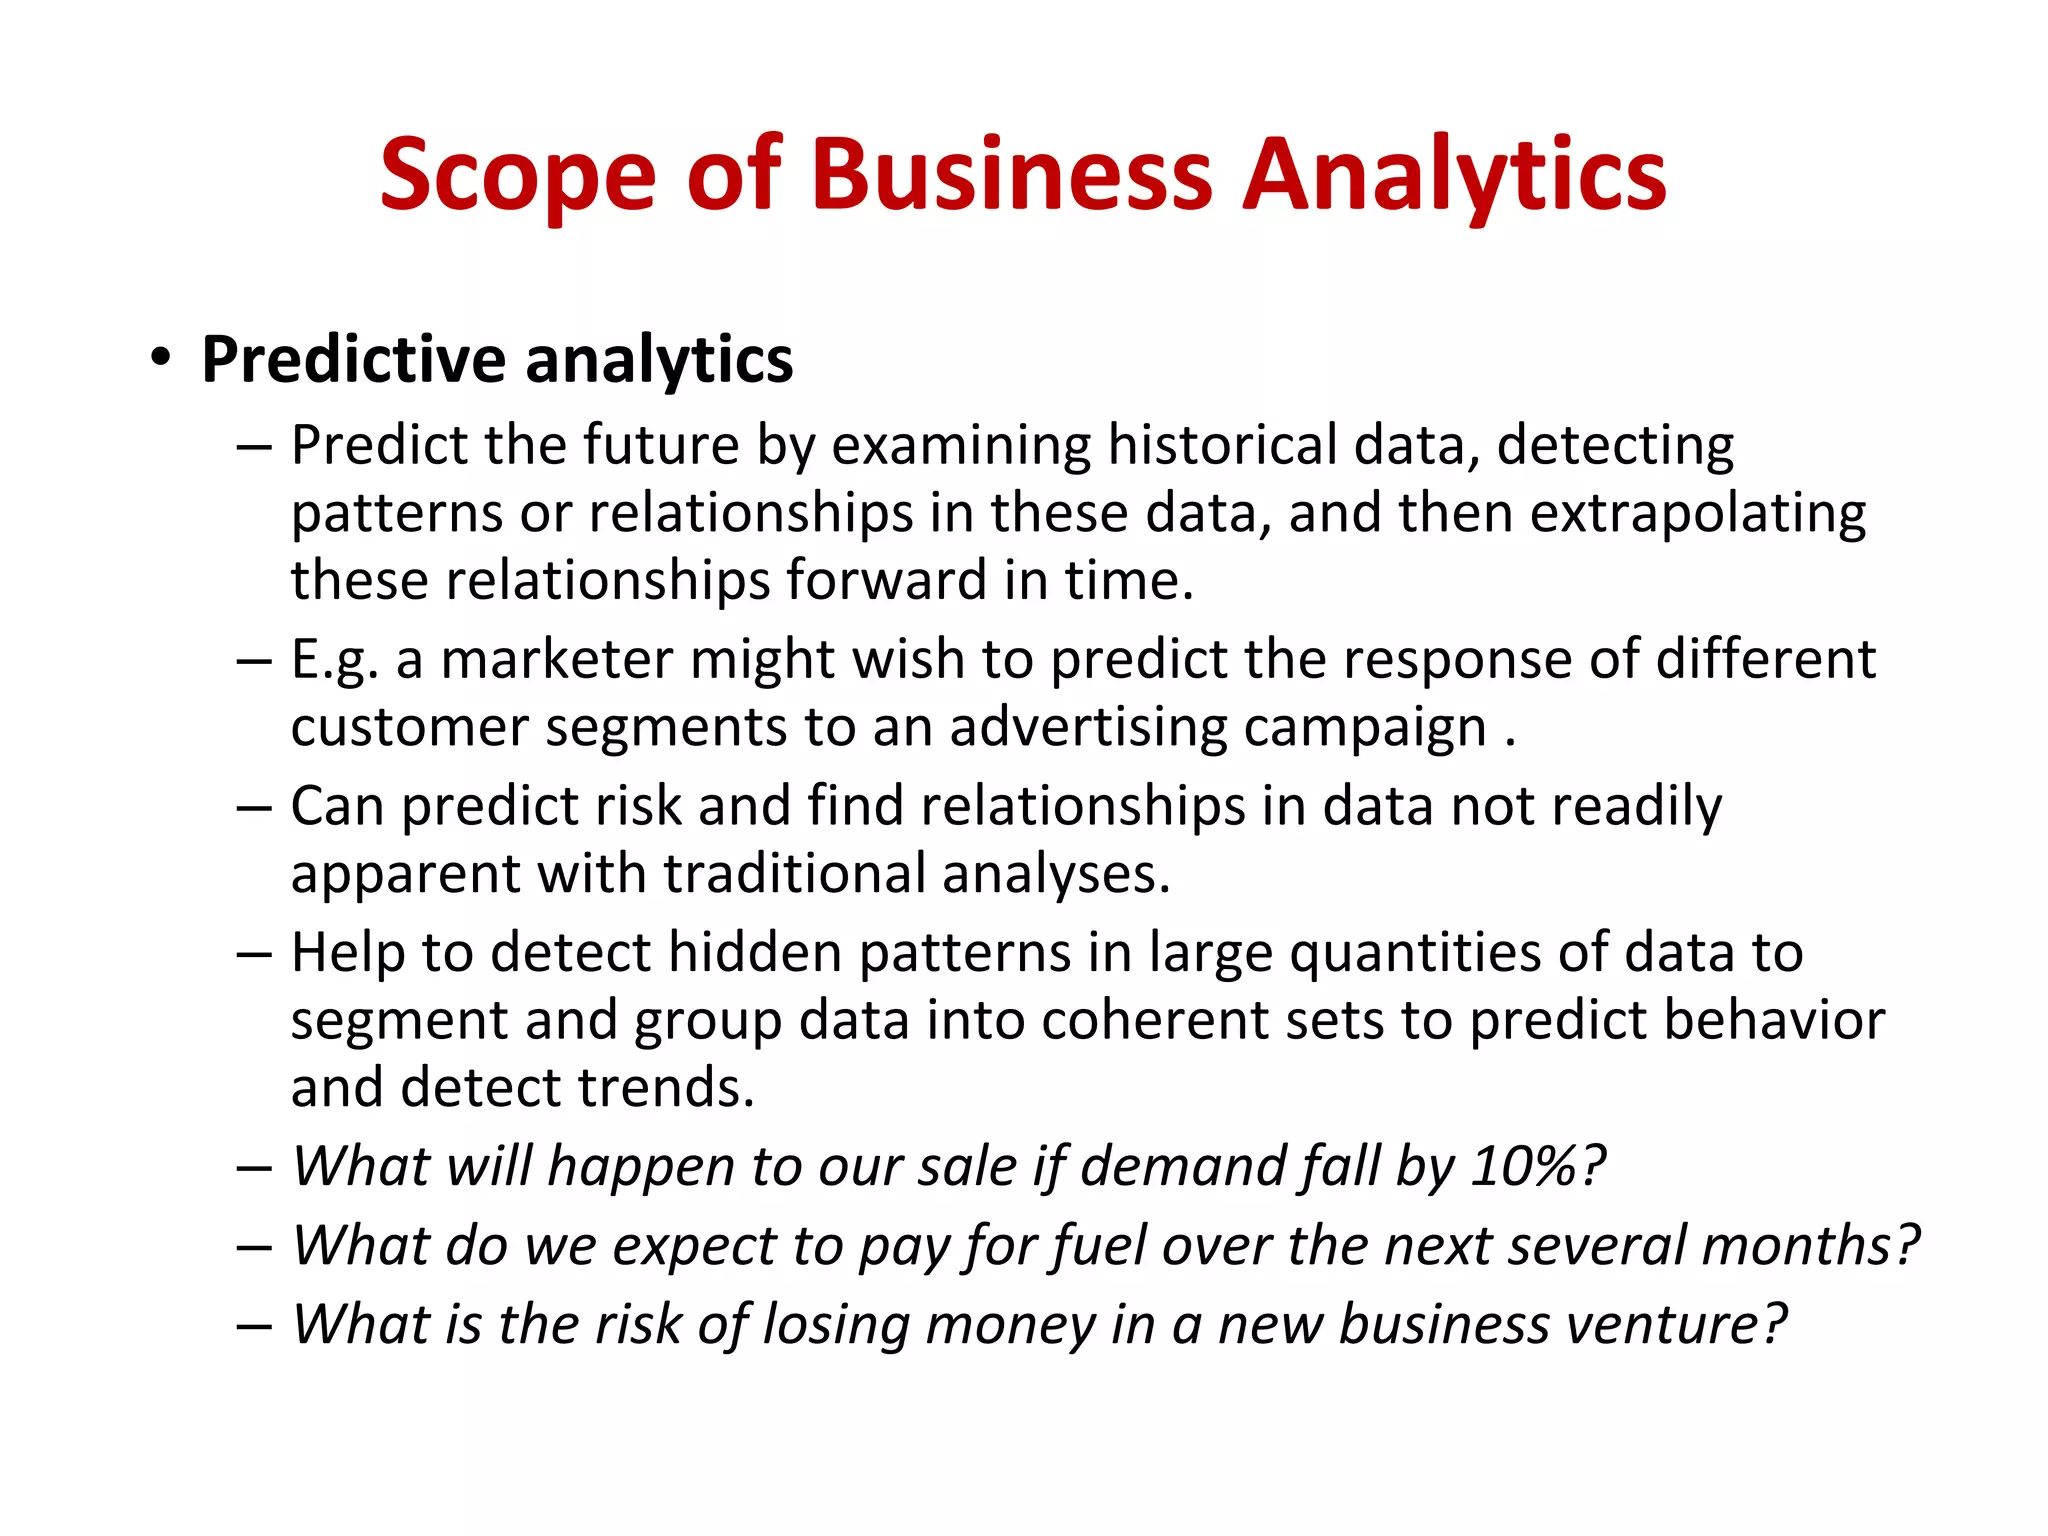
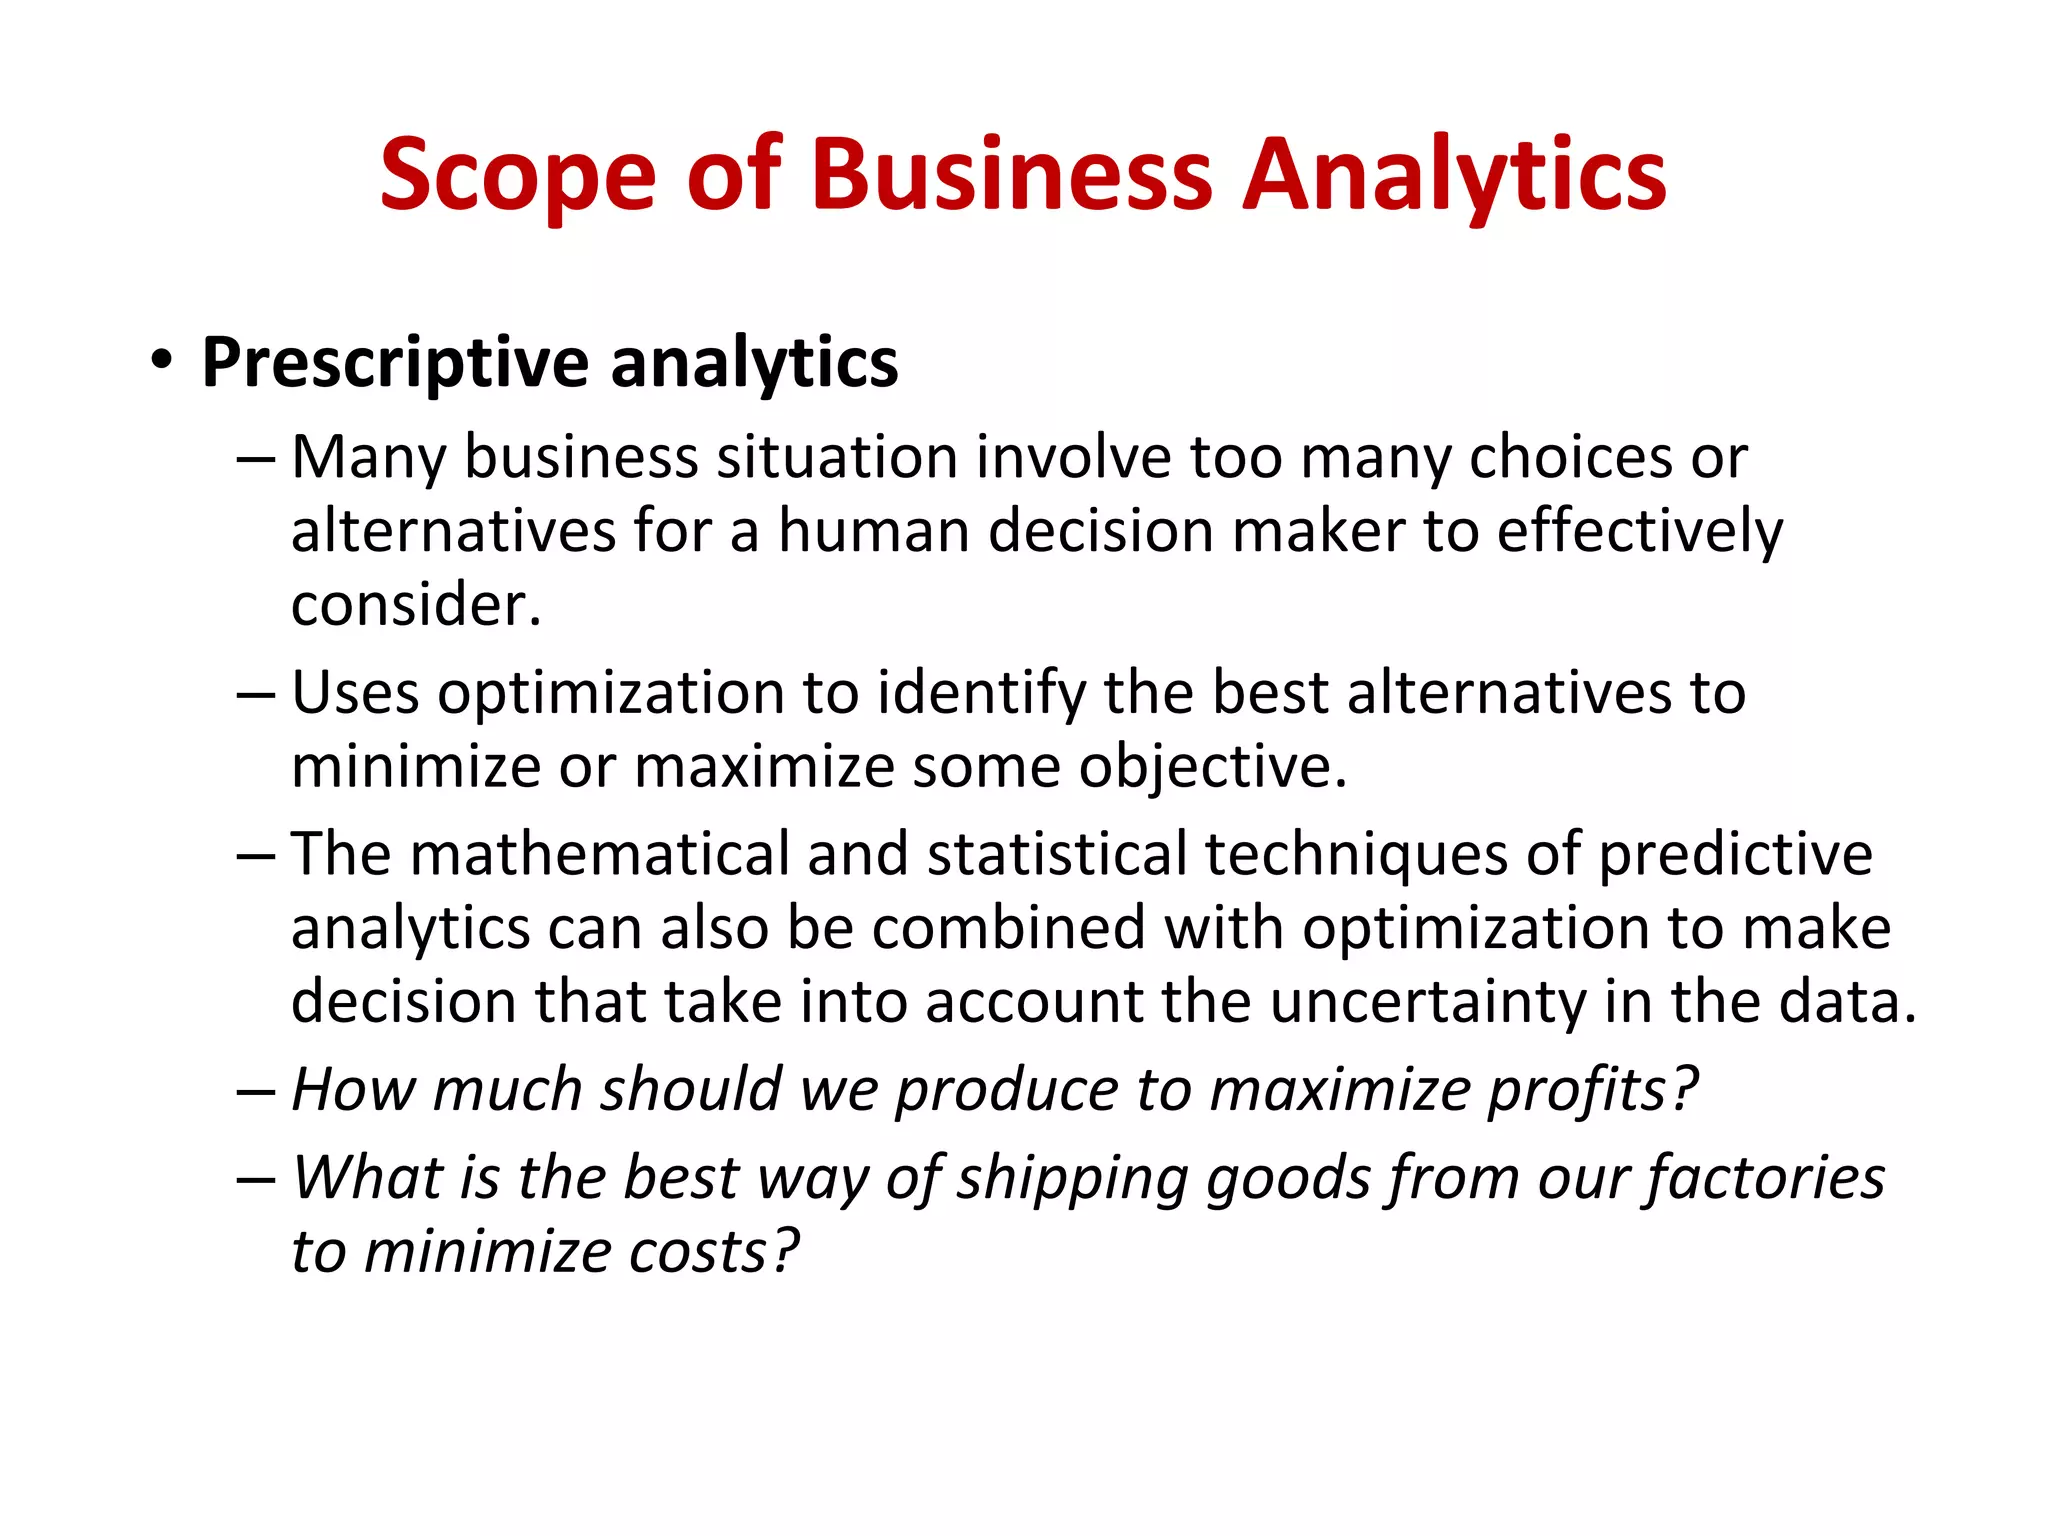
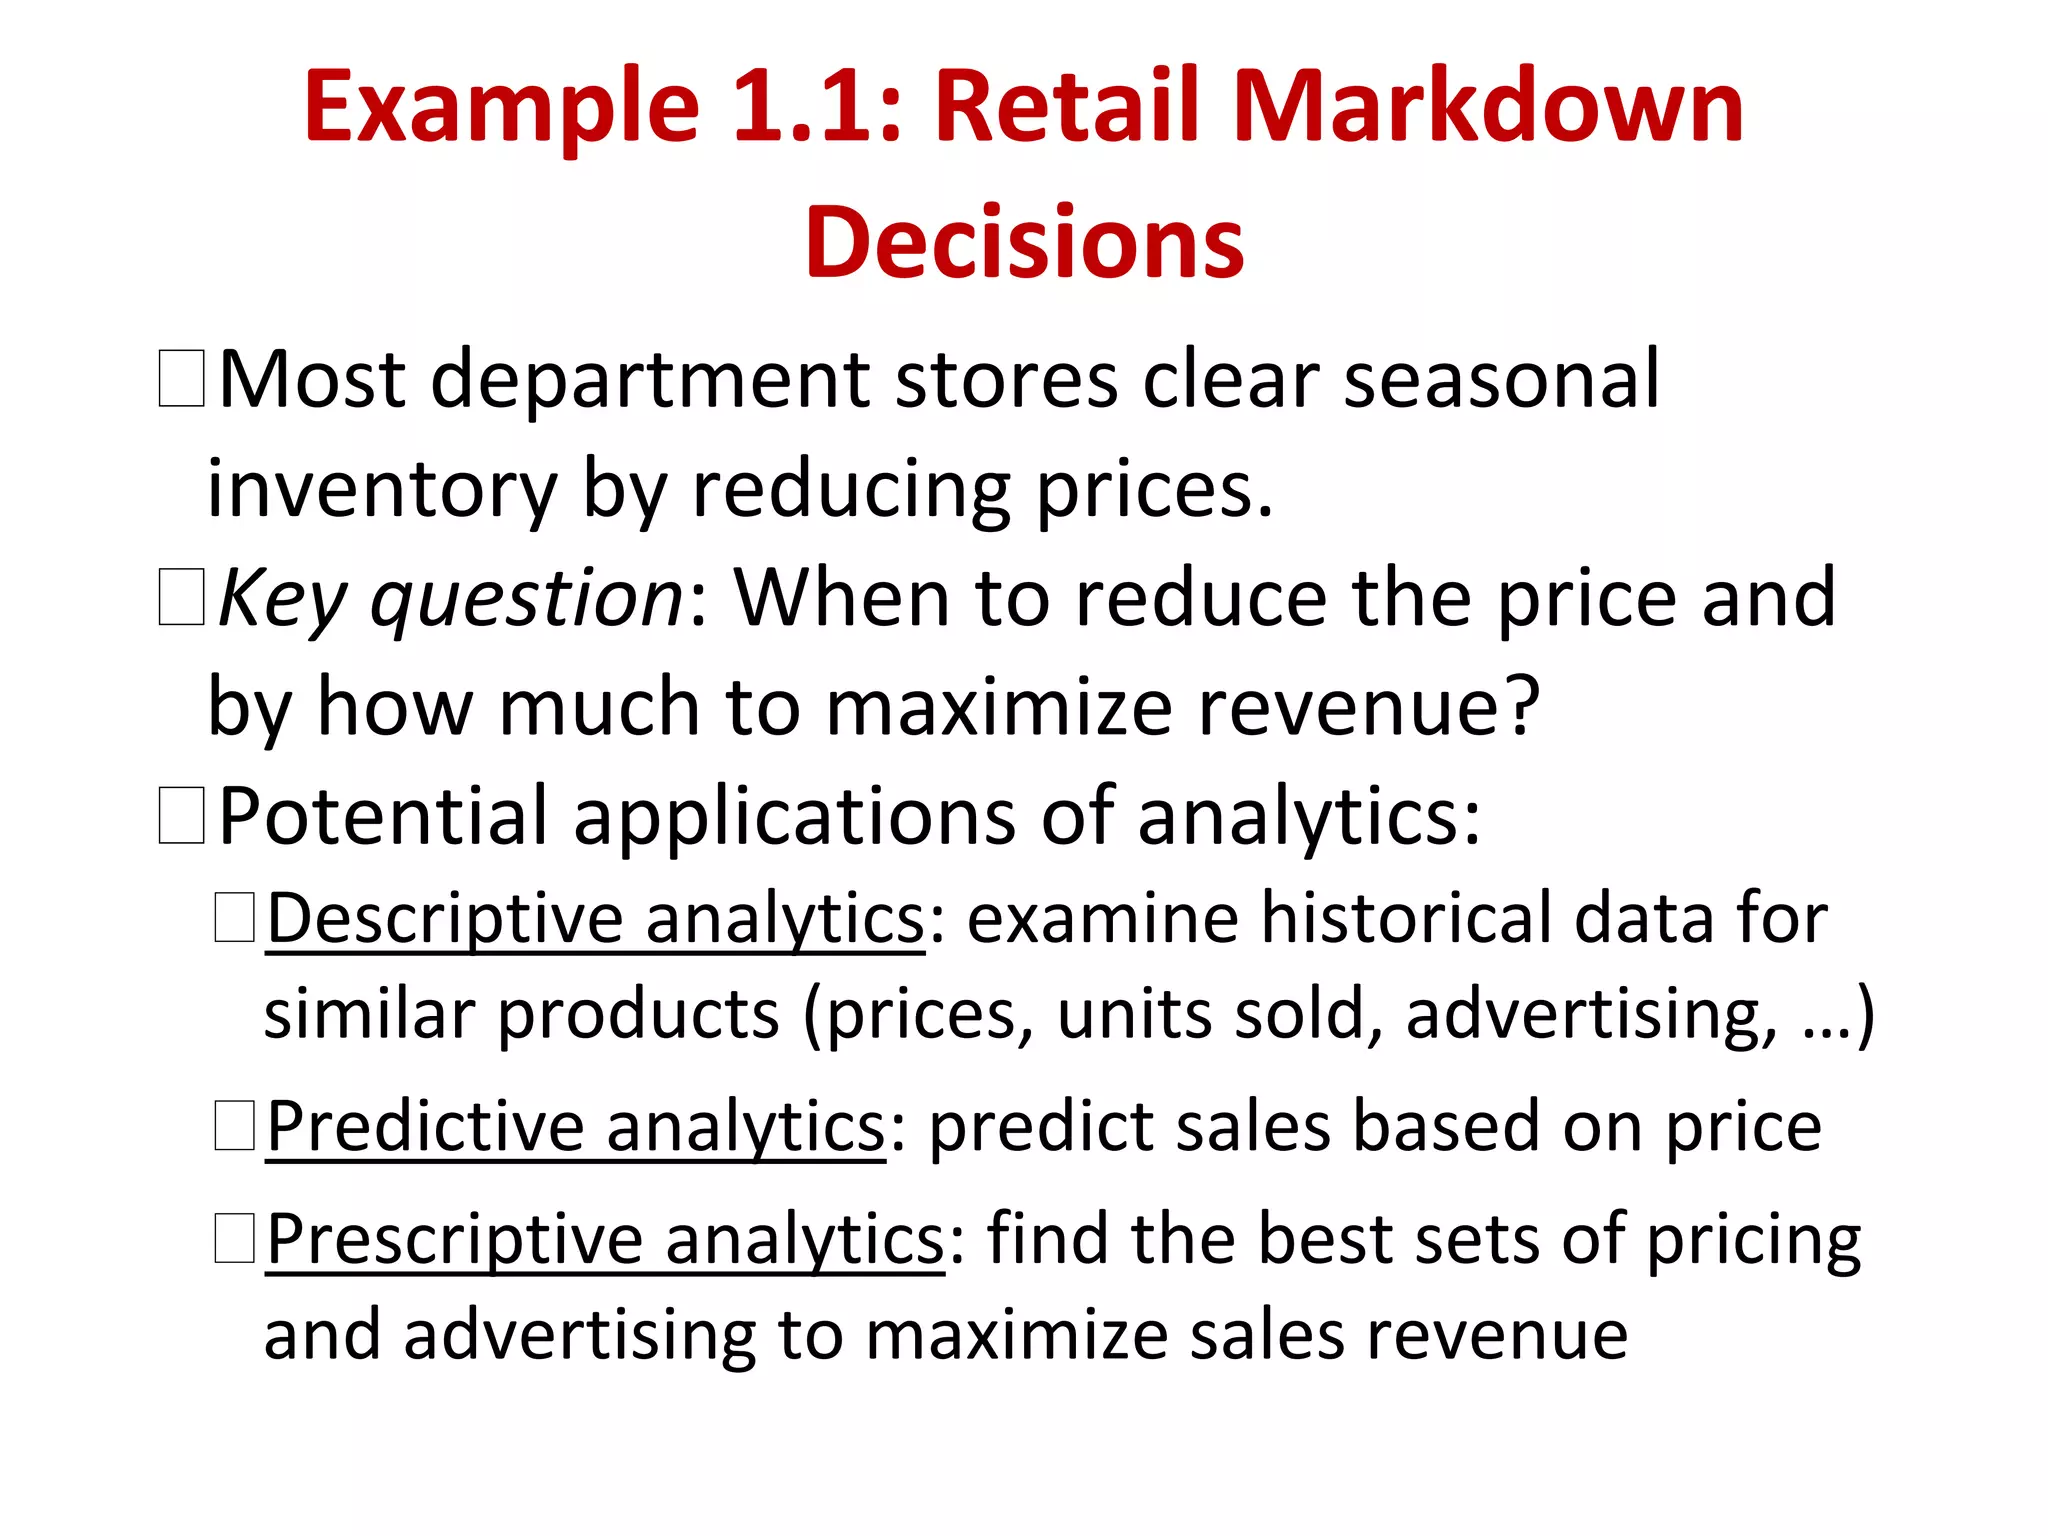
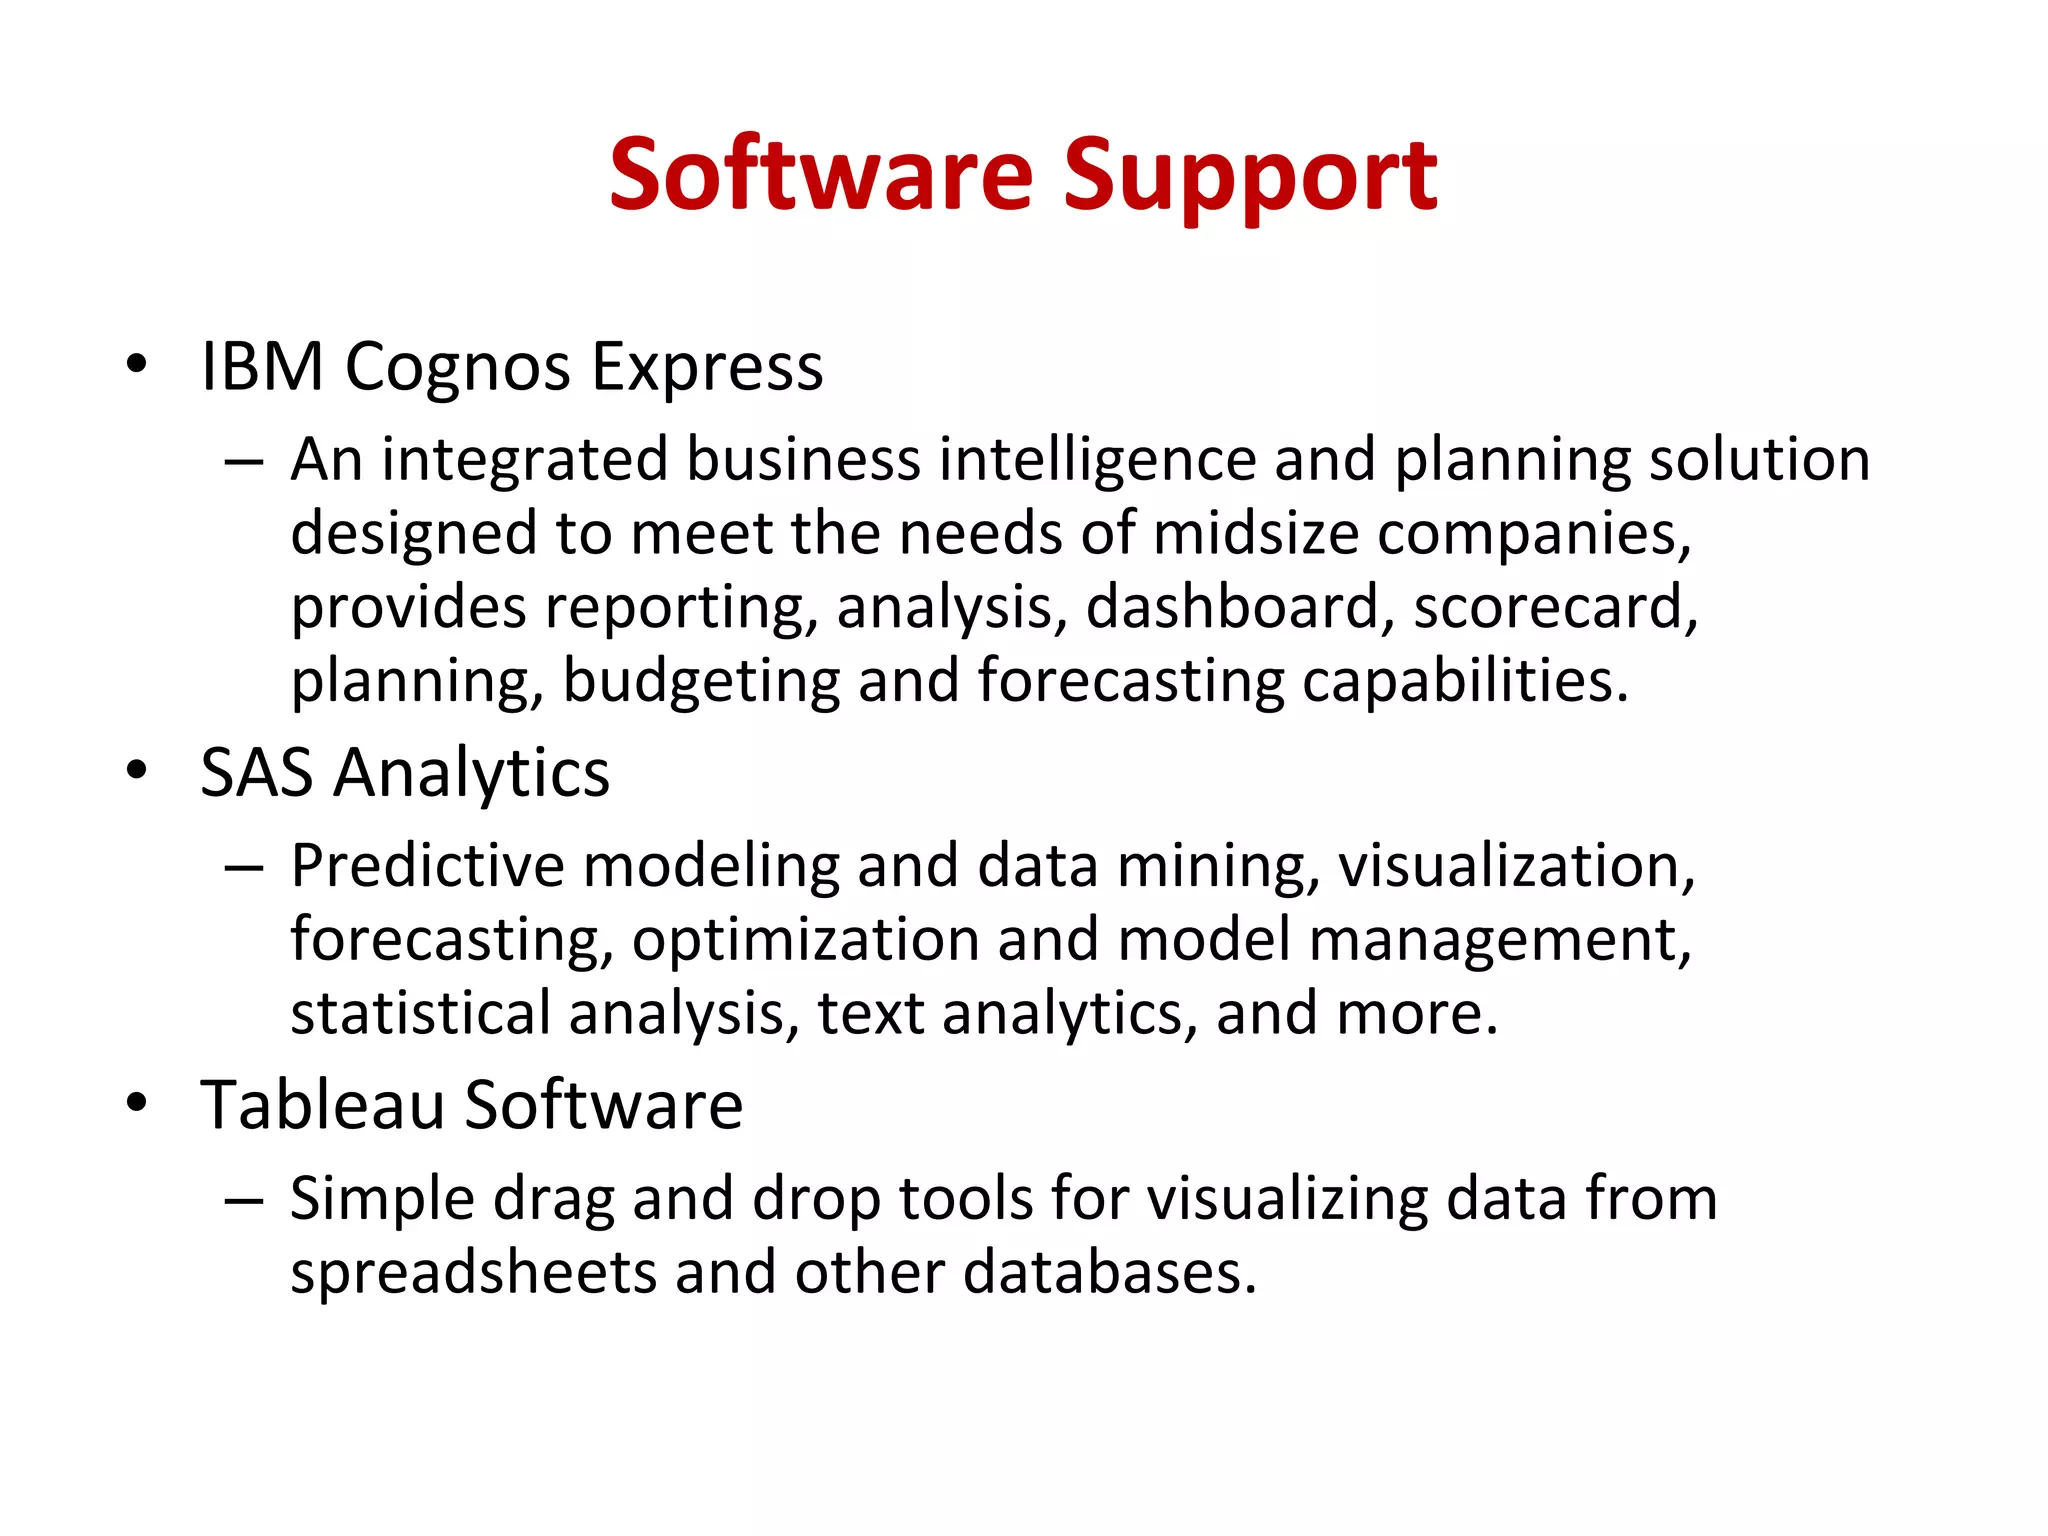
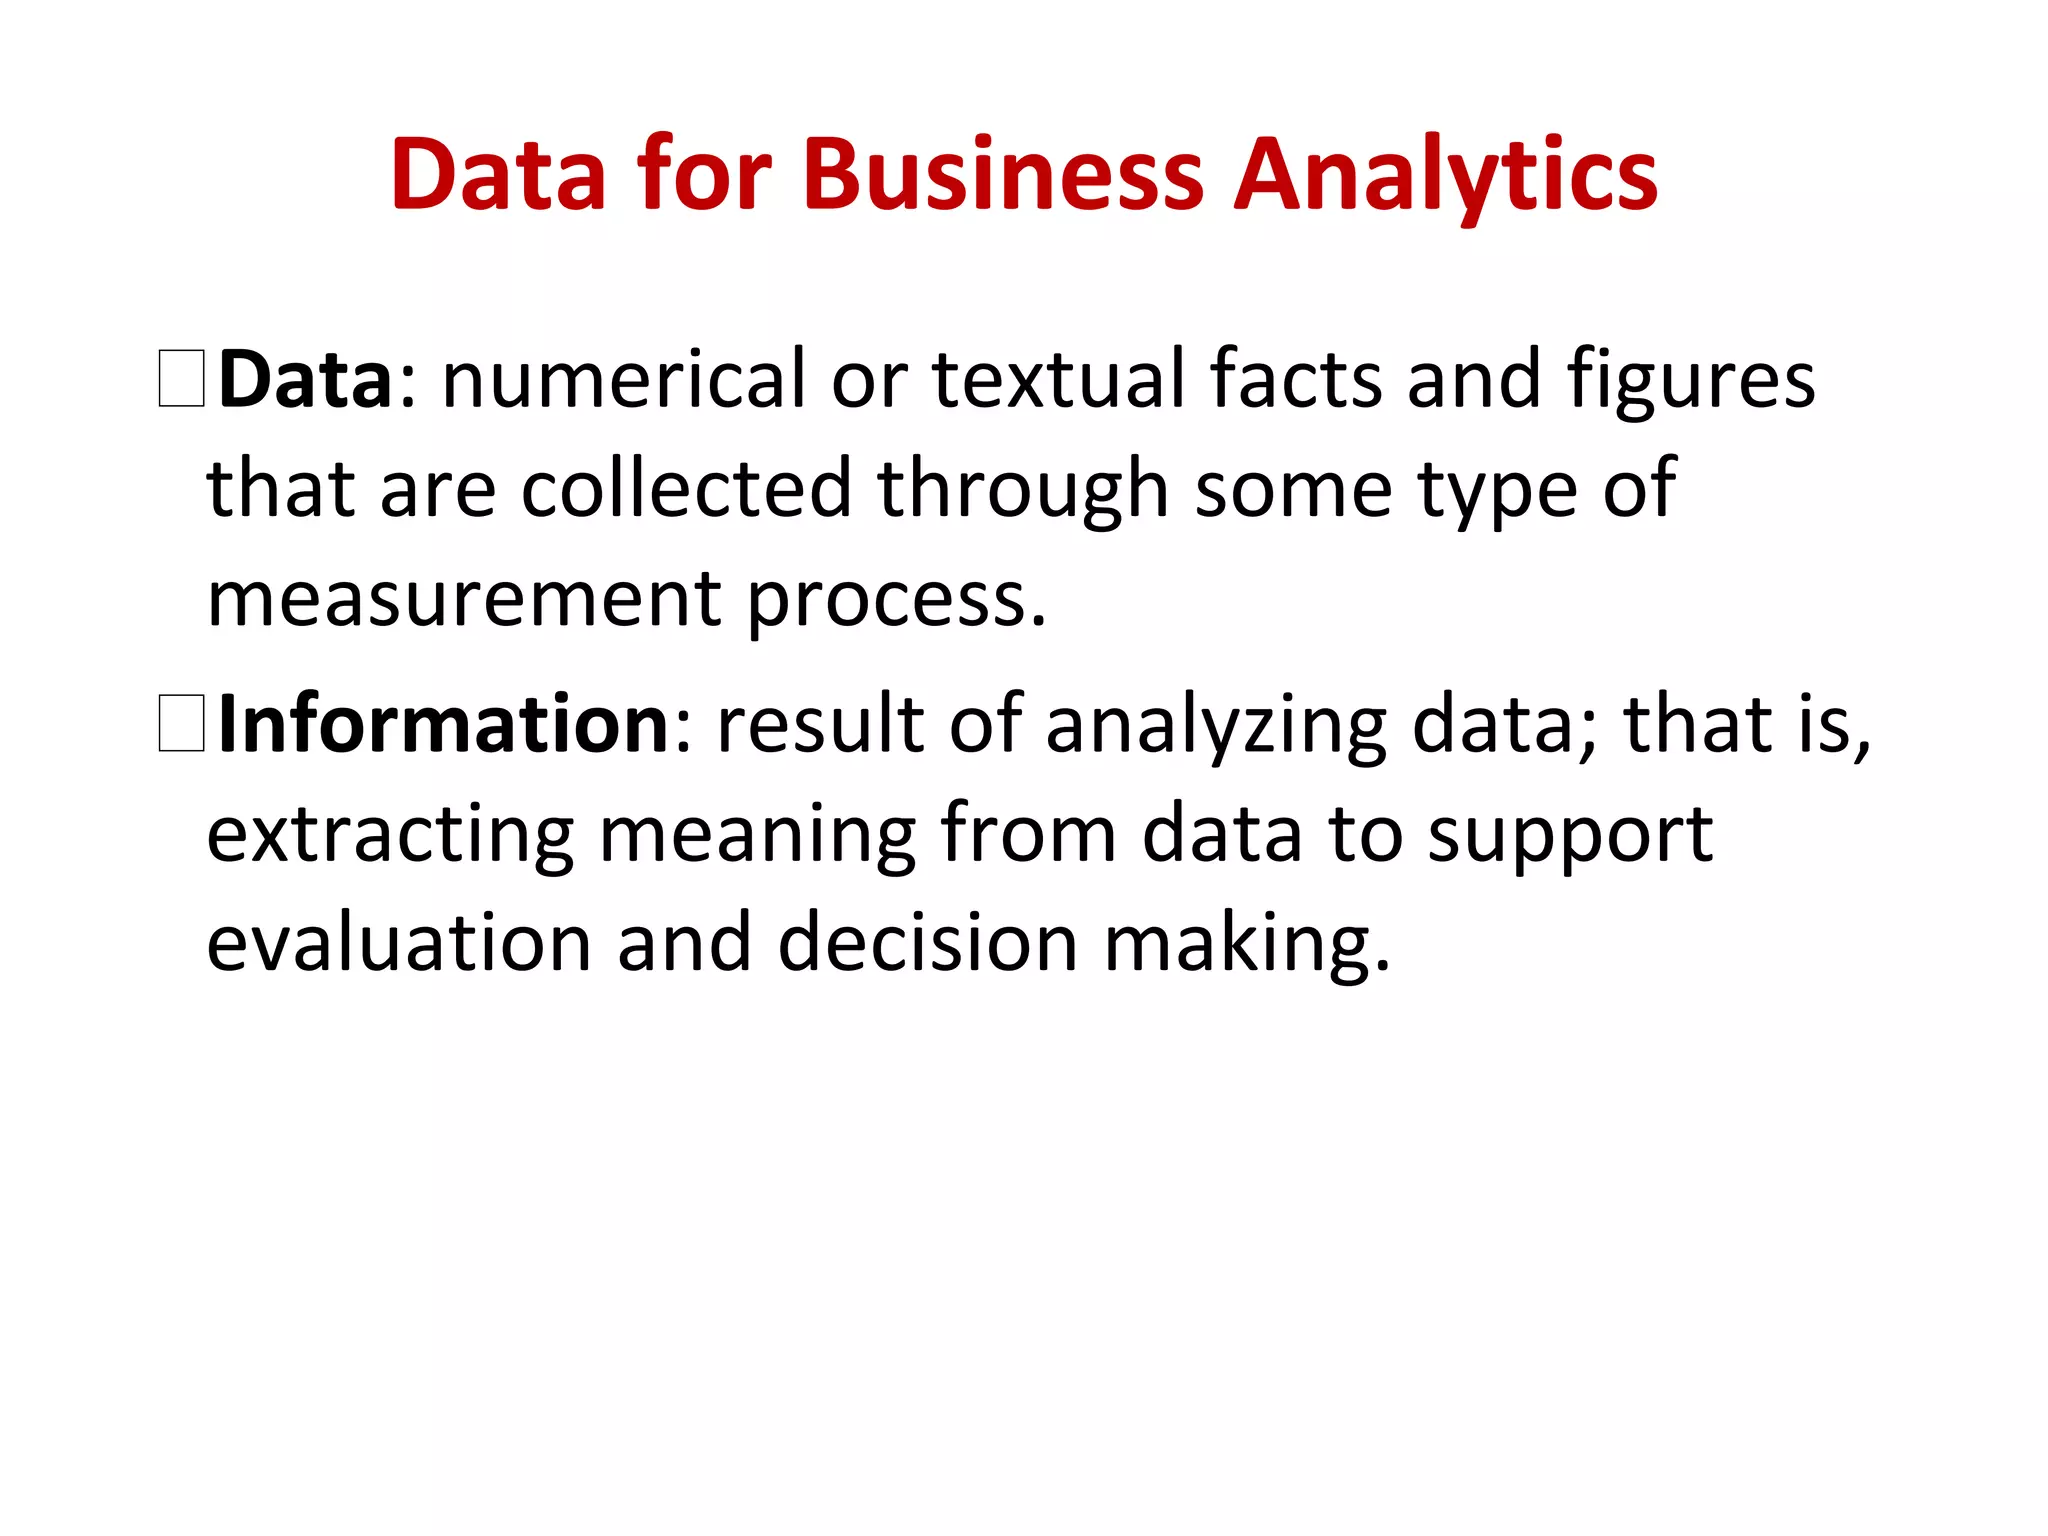
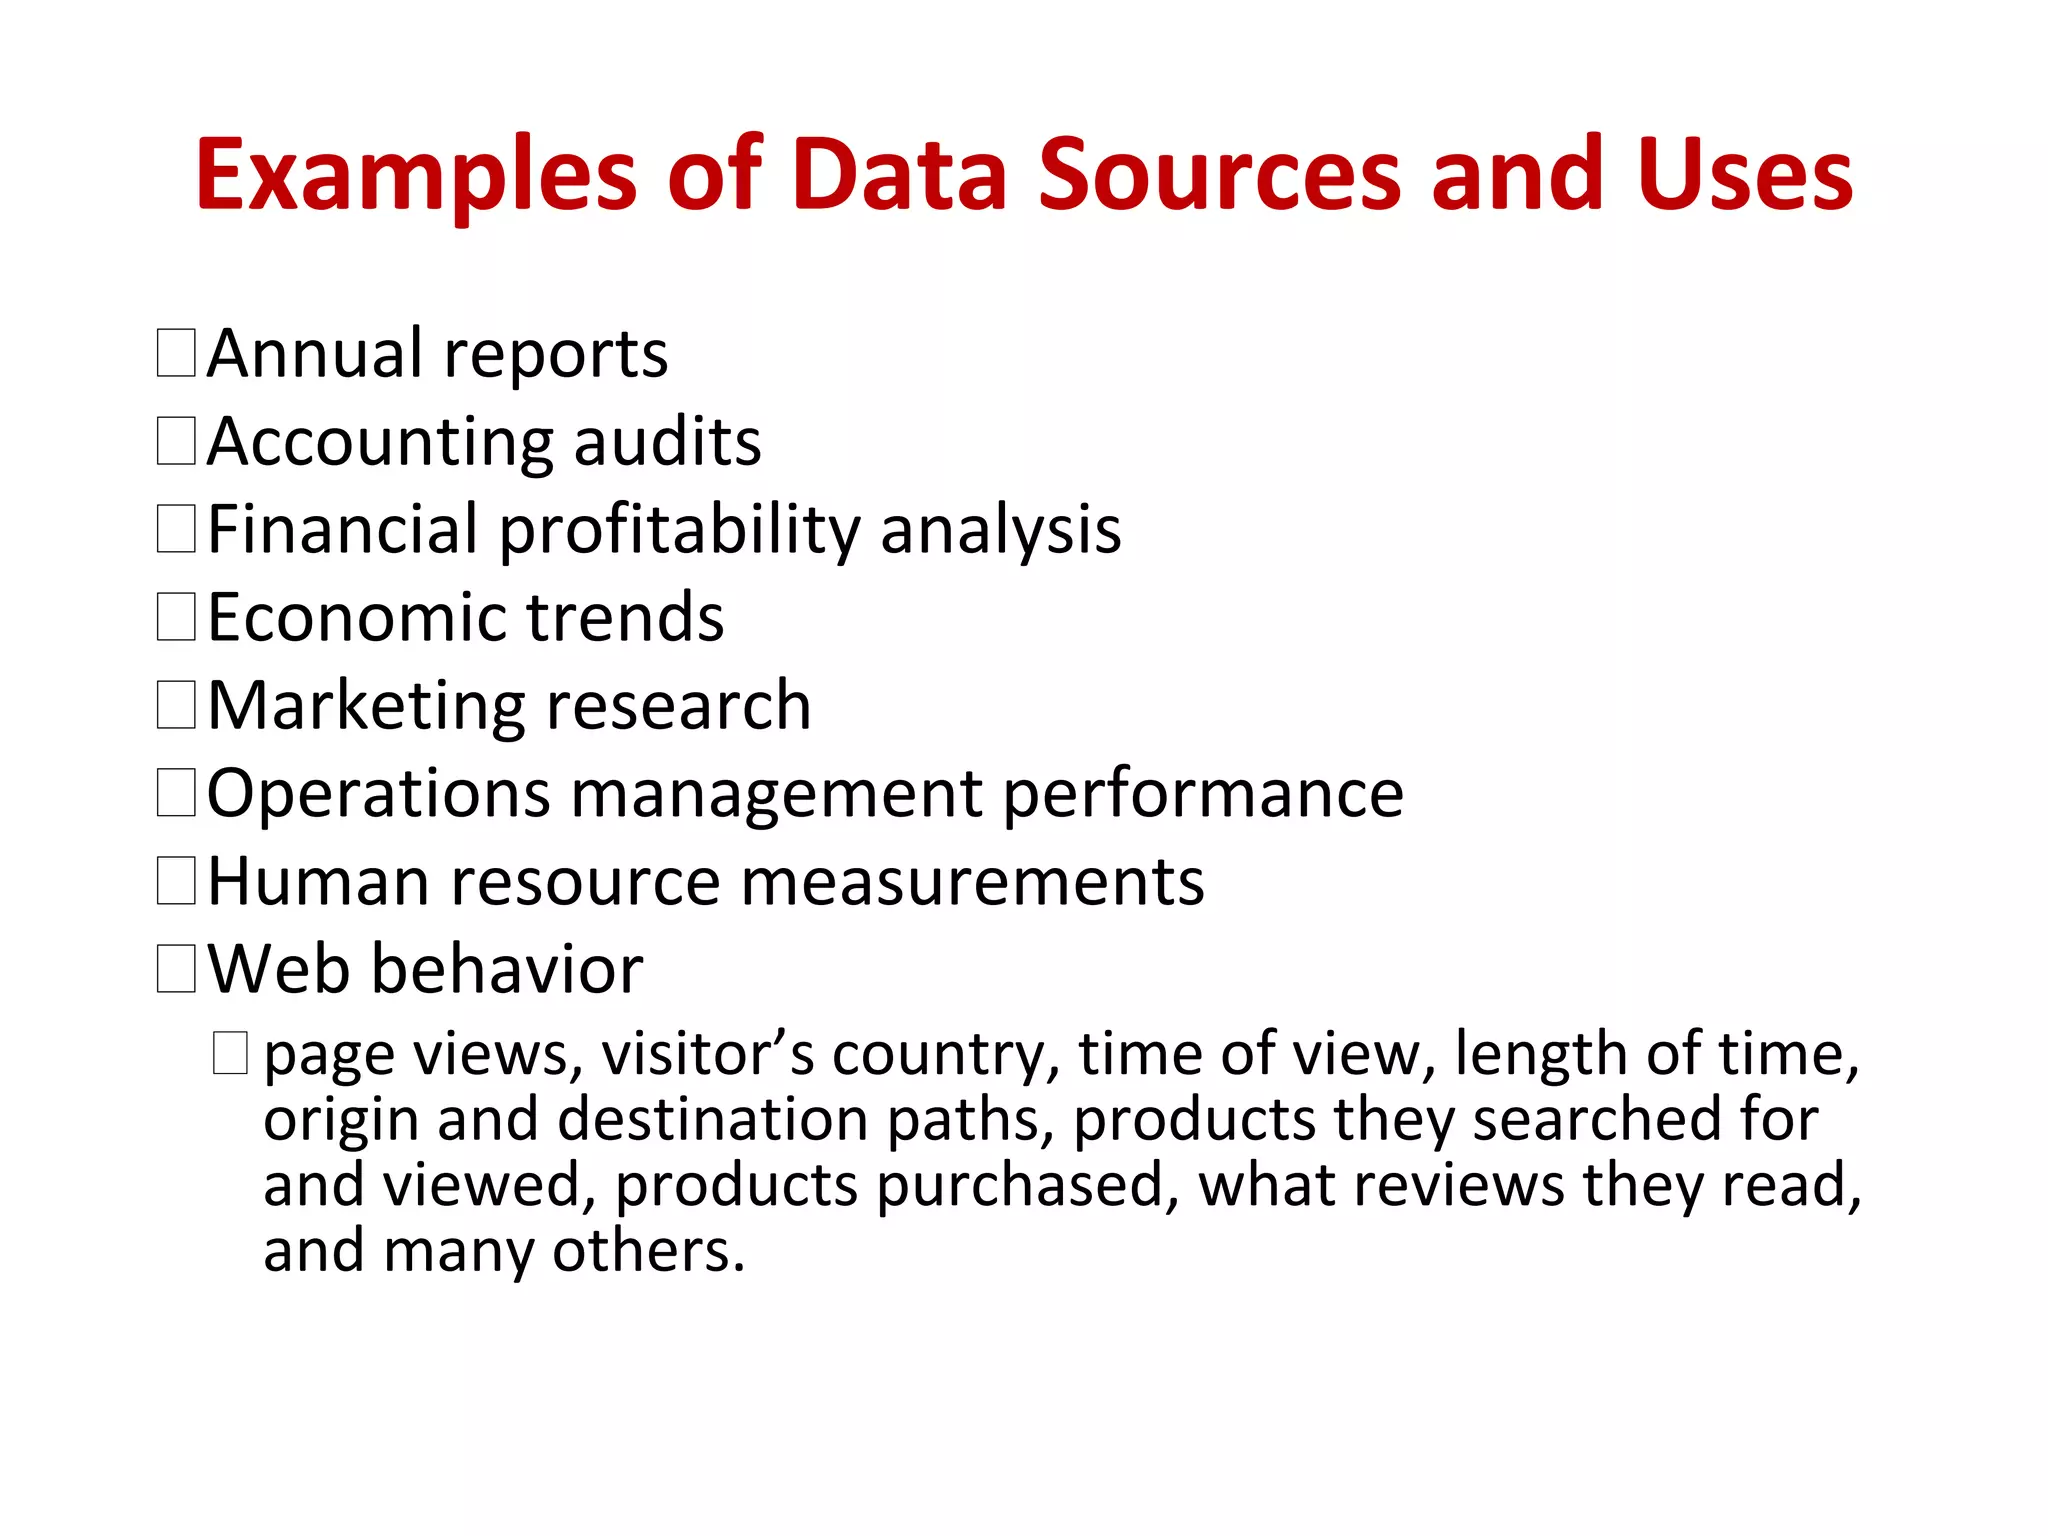
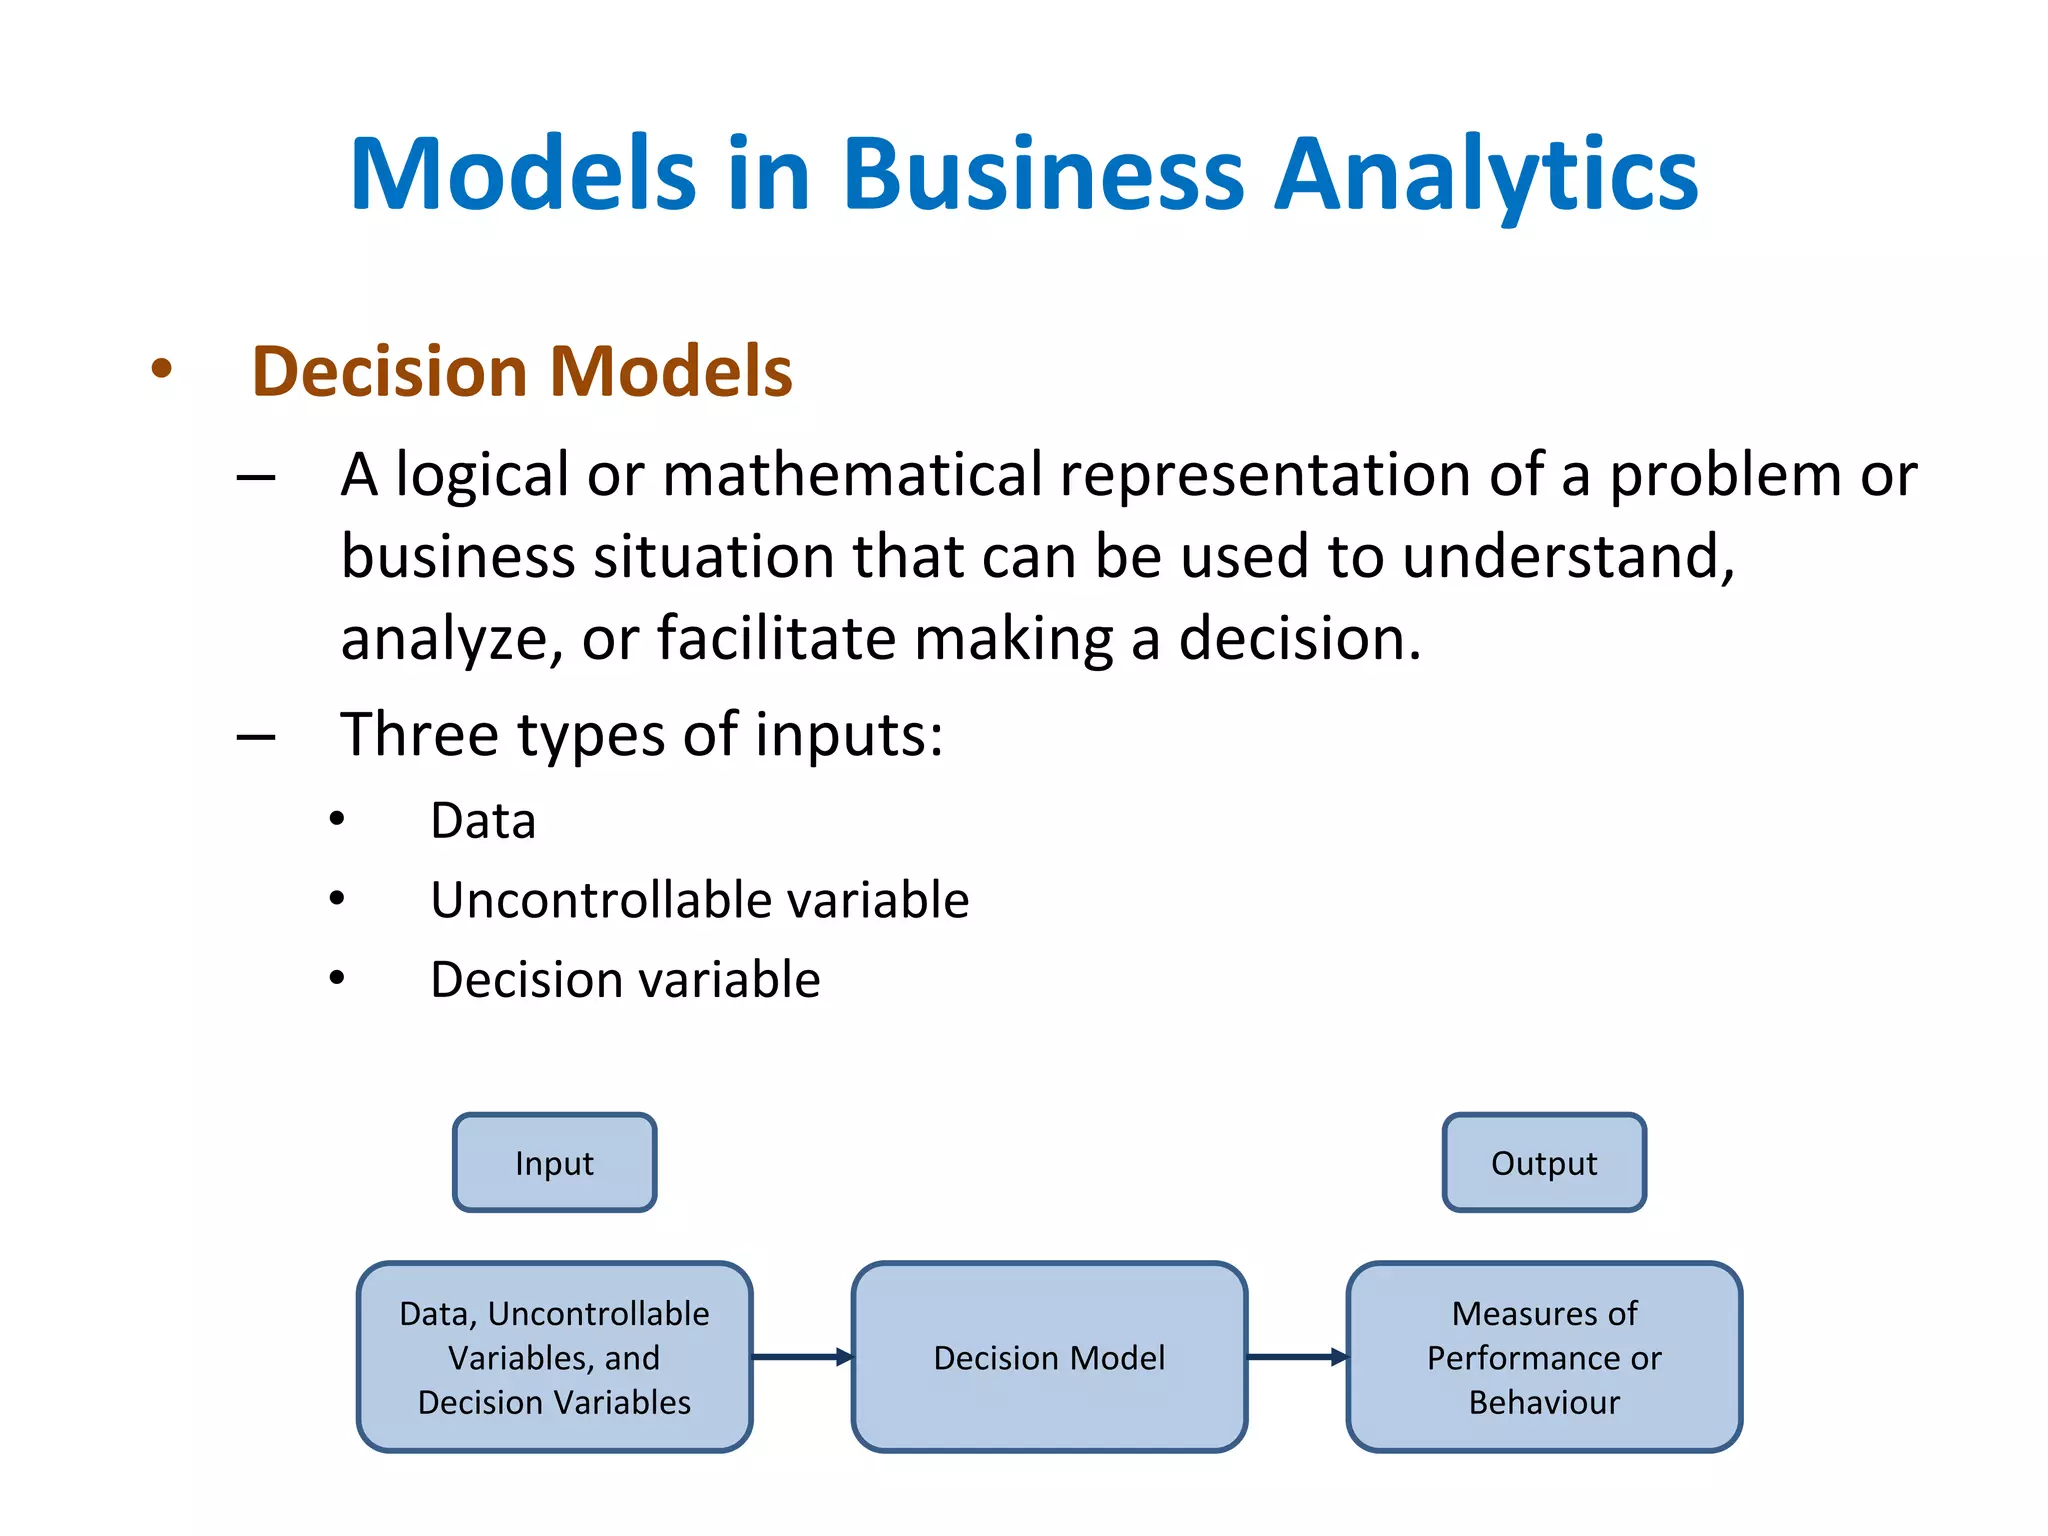
Introduction to
Business Analytics
• Business Analytics is the action of transforming
data into effective business decision.
• A schematic method of processing data to make a
good business decision.
• The process involves:
– Understanding the nature of the data;
– Using both qualitative and quantitative methods of
inquiry to analyze the data;
– Employing suitable technology to produce reliable and
meaningful output
– Presenting data in its simplest form that assists business
to make sound decision.
Business Analytics
(Business) Analytics is the use of:
• data,
• information technology,
• statistical analysis,
• quantitative methods, and
• mathematical or computer-based models
to help managers gain improved insight about their
business operations and make better, fact-based
decisions.
Business Analytics
• A process of transforming data into action through
analysis and insights in the context of
organizational decision making and problem
solving.
• Supported by various tools such as Microsoft Excel
and various Excel add-ins, commercial statistical
software packages such as SAS and Minitab, and
more complex business intelligence suites that
integrate data with analytical software.
Business Analytics
• Pricing
– setting prices for consumer and industrial goods, government
contracts, and maintenance contracts
• Customer segmentation
– identifying and targeting key customer groups in retail, insurance, and
credit card industries
• Merchandising
– determining brands to buy, quantities, and allocations
• Location
– finding the best location for bank branches and ATMs, or where to
service industrial equipment
• Social Media
– understand trends and customer perceptions; assist marketing
managers and product designers
Examples of Applications
• Began with the introduction of computers in late
1940s.
• Early computers provided the ability to store and
analyze data in ways that were either very difficult or
impossible to do so manually.
• The evolution has led to a few new terms in
business.
Evolution of Business Analytics
• Pre-Industrial Era
– When production time was done manually, before
machines were formerly introduced and scale of
production was given less importance.
– Data was recorded on a manual basis either in books or in
ledgers, but was not thoroughly engaged in making
business decision.
Evolution of Business Analytics
• Industrial Era
– Machines and scale of production were revolutionizing the
manufacturing industry.
– Took careful note of the data that was flowing.
– Usage of data was limited for selected internal decision
making only because there was no technology available to
share data.
– Data collection was tedious process because all data was
collected manually.
– As the business expanded, the process of tracking day-to-
day operational data become more difficult.
Evolution of Business Analytics
• Digital Era
– During the 1970s, computers were widely used in large
organization.
– Computers were primarily used to store data and perform
simple analysis, known as Business Intelligence (BI).
– Later, as data collection and processing became more
sophisticated, BI was better known as Information System
(IS).
– Late 1980s, computers were extensively used. Super
computers were taking data storage to a totally new level.
– Data was recorded using spreadsheets and processed
using program formulas.
Evolution of Business Analytics
• Business Intelligence (BI)
– Facilitated the collection, management, analysis and
reporting of data.
– BI software can answer basic question such as:
• How many units did we sell last month?
• What products did customer spend and how much?
• How many credit card transaction were completed yesterday?
– Using BI, we can create simple rules to flag
exceptions automatically.
• E.g. a bank can easily identify transaction greater than
$10,000 to report to the IRS.
Evolution of Business Analytics
• Information Systems (IS)
– BI has evolved into the modern discipline called
Information System (IS).
Evolution of Business Analytics
• Statistics
– An important element of business, driven to a large
extent by the massive growth of data in today’s
world.
– Statistical method allow us to gain a richer
understanding of data that goes beyond business
intelligence reporting, not only by summarizing data
succinctly but also finding unknown and interesting
relationship among the data.
– Include basic tools of description, exploration,
estimation, and inference.
– More advance technique like regression, forecasting
and data mining.
Evolution of Business Analytics
• Operations research/Management science (OR/MS)
– Operation research started from efforts to improve
military operations prior to and during WWII.
– Scientist then realize that the mathematical tools and
technique developed could also be applied to problem in
business and industries.
– The term Management Sciences used to described the
management of business applications.
– Use modelling and optimization techniques for translating
real problems into mathematics, spreadsheet or other
computer languages.
– Using them to find the best (optimal) solutions and
decisions.
Evolution of Business Analytics
• Decision support systems (DSS)
– Combine BI concepts with OR/MS models to create
analytical based computer systems to support decision
making.
– Include three components:
• Data management
• Model management
• Communication system
– Used for many applications including pension fund
management, portfolio management, work-shift schedule,
distribution planning etc.
Evolution of Business Analytics
Perspective of Business Analytics
• Data Mining – focused on a better understanding
characteristics and patterns among variables in large
databases using a variety of statistical and analytical
tools.
• Simulation and Risk Analysis – relies on spreadsheet
models and statistical analysis to examine the impact
of uncertainty in the estimates and their potential
interaction with one another on the output variable
of interest.
Perspective of Business Analytics
• What-if Analysis –how specific combination of an
inputs that reflect key assumptions will reflect model
outputs. Also used to assess the sensitivity of
optimization model to changes in data inputs and
provide better insight for making good decisions.
• Visualization – provide a way of easily
communication data at all level of business and can
reveal surprising patterns and relationships.
Perspective of Business Analytics
• Descriptive analytics
– the use of data to understand past and current business
performance and make informed decisions.
– Commonly used and well understood type of analytics.
– This technique categorize, characterize, consolidate, and
classify data to convert it into useful information for the
purposed of understanding and analyzing business
performance.
– How much did we sell in each region?
– How many and what types of complaints did we resolve?
– Which factory has the lowest productivity?
Scope of Business Analytics
• Predictive analytics
– Predict the future by examining historical data, detecting
patterns or relationships in these data, and then extrapolating
these relationships forward in time.
– E.g. a marketer might wish to predict the response of different
customer segments to an advertising campaign .
– Can predict risk and find relationships in data not readily
apparent with traditional analyses.
– Help to detect hidden patterns in large quantities of data to
segment and group data into coherent sets to predict behavior
and detect trends.
– What will happen to our sale if demand fall by 10%?
– What do we expect to pay for fuel over the next several months?
– What is the risk of losing money in a new business venture?
Scope of Business Analytics
• Prescriptive analytics
– Many business situation involve too many choices or
alternatives for a human decision maker to effectively
consider.
– Uses optimization to identify the best alternatives to
minimize or maximize some objective.
– The mathematical and statistical techniques of predictive
analytics can also be combined with optimization to make
decision that take into account the uncertainty in the data.
– How much should we produce to maximize profits?
– What is the best way of shipping goods from our factories
to minimize costs?
Scope of Business Analytics
�Most department stores clear seasonal
inventory by reducing prices.
�Key question: When to reduce the price and
by how much to maximize revenue?
�Potential applications of analytics:
�Descriptive analytics: examine historical data for
similar products (prices, units sold, advertising, …)
�Predictive analytics: predict sales based on price
�Prescriptive analytics: find the best sets of pricing
and advertising to maximize sales revenue
Example 1.1: Retail Markdown
Decisions
• IBM Cognos Express
– An integrated business intelligence and planning solution
designed to meet the needs of midsize companies,
provides reporting, analysis, dashboard, scorecard,
planning, budgeting and forecasting capabilities.
• SAS Analytics
– Predictive modeling and data mining, visualization,
forecasting, optimization and model management,
statistical analysis, text analytics, and more.
• Tableau Software
– Simple drag and drop tools for visualizing data from
spreadsheets and other databases.
Software Support
�Data: numerical or textual facts and figures
that are collected through some type of
measurement process.
�Information: result of analyzing data; that is,
extracting meaning from data to support
evaluation and decision making.
Data for Business Analytics
�Annual reports
�Accounting audits
�Financial profitability analysis
�Economic trends
�Marketing research
�Operations management performance
�Human resource measurements
�Web behavior
�page views, visitor’s country, time of view, length of time,
origin and destination paths, products they searched for
and viewed, products purchased, what reviews they read,
and many others.
Examples of Data Sources and Uses
• Data set - a collection of data.
– Examples: Marketing survey responses, a table of
historical stock prices, and a collection of
measurements of dimensions of a manufactured item.
• Database - a collection of related files containing
records on people, places, or things.
– A database file is usually organized in a two-
dimensional table, where the columns correspond to
each individual element of data (called fields, or
attributes), and the rows represent records of related
data elements.
Data Sets and Databases
Example 1.2: A Sales Transaction
Database File
Entities
Records
Fields or Attributes
• Big data to refer to massive amounts of business data from a
wide variety of sources, much of which is available in real
time, and much of which is uncertain or unpredictable. IBM
calls these characteristics volume, variety, velocity, and
veracity.
• “The effective use of big data has the potential to transform
economies, delivering a new wave of productivity growth and
consumer surplus. Using big data will become a key basis of
competition for existing companies, and will create new
competitors who are able to attract employees that have the
critical skills for a big data world.” - McKinsey Global Institute, 2011
Big Data
• Metric – unit of measurement that provides a way to
objectively quantify performance.
• Measurement – the act of obtaining data associated with a
metric.
• Measures – numerical values associated with a metric.
• Discrete metric – derived from counting something e.g.
number of order, number of errors etc.
• Continuous metrics – based on a continuous scale of
measurement.
Metrics and Data Classification
• Categorical (nominal) data
– Sorted into categories according to specified characteristics.
– E.g. customer by geographical region, employees designation etc.
– No quantitative relationship to one another, but we usually assign
arbitrary number to each category to ease the process of managing the
data and computing statistics.
– Usually counted as proportions or percentages.
• Ordinal data
– Data that can be ordered or ranked according to some relationships to
one another.
– More meaningful because data can be compared to one another.
– E.g. rating a service as poor, average, good, very good or excellent –
natural order
– Have no fixed unit of measurement, so we cannot make meaningful
numerical statement about different between categories.
Type of Measurement Scale
• Interval data
– Ordinal data that have constant differences between observation and
have arbitrary zero points.
– Each point is placed at equal distance from one another.
– E.g. time and temperature.
– E.g. both Farenheit and Celcius scales represent a specified measure
of distance – degrees – but have an arbitrary zero points. Thus we
cannot take meaningful ratios.
– E.g. we cannot say that 50 degrees is twice as hot as 25 degrees.
• Ratio data
– Continuous and have a natural zero.
– Most business and economic data such as dollars and time.
Type of Measurement Scale
• Reliability
– Data are accurate and consistent.
• Validity
– Data correctly measure what they are supposed to
measure.
Data Reliability and Validity
• Model - an abstraction or representation of
a real system, idea, or object.
– Captures the most important features of a
problem and present them in a form that is
easy to interpret.
– Can be a written or verbal description of some
phenomenon, a visual representation such as
graph or a flowchart, a mathematical formula,
or a spreadsheet representation.
– Can be descriptive, predictive, or prescriptive.
Models in Business Analytics
• Decision Models
– A logical or mathematical representation of a problem or
business situation that can be used to understand,
analyze, or facilitate making a decision.
– Three types of inputs:
• Data
• Uncontrollable variable
• Decision variable
Models in Business Analytics
Data, Uncontrollable
Variables, and
Decision Variables
Decision Model
Measures of
Performance or
Behaviour
Input Output
• Model Assumptions
– Based on assumption that reflect the modeler’s view
of the “real world”.
– Some assumption are made to simplify the model
and make it more traceable – able to be easily
analyzed or solved.
– Also made to better characyerized historical data or
past observation.
– The task of the modeler is to select or build an
appropriate model that best represent the behavior
of the real situation.
– E.g. A demand prediction model.
Models in Business Analytics
• Uncertainty and Risk
– The future is always uncertain.
– Thus many predictive models incorporate
uncertainty and help decision makers analyze the
risks associated with their decisions.
– Uncertainty – imperfect knowledge of what will
happen.
– Risk – associated with consequences and likelihood
of what might happen.
Models in Business Analytics
• Prescriptive Decision Models
– Help decision makers to identify the best
solution to a decision problem.
– Optimization – a process of finding a set of
values for decision variables that minimize or
maximize some quantity of interest – profit,
revenue, cost, time and so on – called the
objective function.
– Any set of decision variables that optimizes the
objective function is called an optimal solution.
Models in Business Analytics
• Problem solving consists of six phases:
1) Recognizing a problem
2) Defining the problem
3) Structuring the problem
4) Analyzing the problem
5) Interpreting result and making decision
6) Implementing the solution
Problem Solving with Analytics
1) Recognizing a problem
– Managers faces different types of problems.
• Allocating financial resources
• Building or expanding facilities
• Determining product mix
• Strategically sourcing production
• Develop distribution plans
• Production and inventory schedules
• Staffing plans
• Analyze risks
• Determine investment strategies
• Making pricing decisions
– Identifying the gap between what is happening and what we
think should be happening.
– E.g A consumer product manager feels that the distribution
cost are too high
Problem Solving with Analytics
2) Defining the problem
– Finding the real problem and distinguishing it
from symptoms that are observed is a critical
steps.
– E.g. High Distribution Cost
– Why? Inefficiencies in routing trucks, poor
location of distribution center, increasing fuel
costs.
Problem Solving with Analytics
2) Defining the problem
– The complexity of a problem increases when the
following occur:
• The number of potential courses of action is large
• The problems belongs to a group rather than to an
individual
• The problem solver has several competing objectives
• External groups or individuals are affected by the
problem
• The problem solver and the true owner of the
problem are not the same
• Time limitations are important.
Problem Solving with Analytics
3) Structuring the problem
– Involves:
• stating goals and objectives
• characterizing the possible decisions
• Identifying any constraints or restrictions
– E.g redesign a distribution system
– How? What? Which one? How much?
Problem Solving with Analytics
4) Analyzing the problem
– Involves some sort of experimentation or
solution process such as:
• Evaluating different scenarios
• Analyzing risk associated with various decision
alternatives
• Finding a solution that meets certain goals
• Determining an optimal solution
Problem Solving with Analytics
5) Interpreting results and making decision
– Interpreting results from the analysis phase is crucial in
making good decision.
– Models cannot capture every details of the real problem,
and managers must understand the limitation of models
and their underlying assumptions and often incorporate
judgment into making a decision.
– Involves some sort of experimentation or solution
process such as:
• Evaluating different scenarios
• Analyzing risk associated with various decision alternatives
• Finding a solution that meets certain goals
• Determining an optimal solution
Problem Solving with Analytics
6) Implementing the solution
– Making it works in the organization, or translating
the results of a model back to the real world.
– This generally requires:
• Providing adequate resources
• Motivating employees
• Eliminating resistance to change
• Modifying organizational policies
• Developing trust.
– Problems and their solutions affect people:
customers, suppliers and employees.
– Good communication skills is vital.
Problem Solving with Analytics
End of Lesson

Chapter 1 - Introduction to Business Analytics.pptx

  • 1.
  • 2.
    • Business Analyticsis the action of transforming data into effective business decision. • A schematic method of processing data to make a good business decision. • The process involves: – Understanding the nature of the data; – Using both qualitative and quantitative methods of inquiry to analyze the data; – Employing suitable technology to produce reliable and meaningful output – Presenting data in its simplest form that assists business to make sound decision. Business Analytics
  • 3.
    (Business) Analytics isthe use of: • data, • information technology, • statistical analysis, • quantitative methods, and • mathematical or computer-based models to help managers gain improved insight about their business operations and make better, fact-based decisions. Business Analytics
  • 4.
    • A processof transforming data into action through analysis and insights in the context of organizational decision making and problem solving. • Supported by various tools such as Microsoft Excel and various Excel add-ins, commercial statistical software packages such as SAS and Minitab, and more complex business intelligence suites that integrate data with analytical software. Business Analytics
  • 5.
    • Pricing – settingprices for consumer and industrial goods, government contracts, and maintenance contracts • Customer segmentation – identifying and targeting key customer groups in retail, insurance, and credit card industries • Merchandising – determining brands to buy, quantities, and allocations • Location – finding the best location for bank branches and ATMs, or where to service industrial equipment • Social Media – understand trends and customer perceptions; assist marketing managers and product designers Examples of Applications
  • 6.
    • Began withthe introduction of computers in late 1940s. • Early computers provided the ability to store and analyze data in ways that were either very difficult or impossible to do so manually. • The evolution has led to a few new terms in business. Evolution of Business Analytics
  • 7.
    • Pre-Industrial Era –When production time was done manually, before machines were formerly introduced and scale of production was given less importance. – Data was recorded on a manual basis either in books or in ledgers, but was not thoroughly engaged in making business decision. Evolution of Business Analytics
  • 8.
    • Industrial Era –Machines and scale of production were revolutionizing the manufacturing industry. – Took careful note of the data that was flowing. – Usage of data was limited for selected internal decision making only because there was no technology available to share data. – Data collection was tedious process because all data was collected manually. – As the business expanded, the process of tracking day-to- day operational data become more difficult. Evolution of Business Analytics
  • 9.
    • Digital Era –During the 1970s, computers were widely used in large organization. – Computers were primarily used to store data and perform simple analysis, known as Business Intelligence (BI). – Later, as data collection and processing became more sophisticated, BI was better known as Information System (IS). – Late 1980s, computers were extensively used. Super computers were taking data storage to a totally new level. – Data was recorded using spreadsheets and processed using program formulas. Evolution of Business Analytics
  • 10.
    • Business Intelligence(BI) – Facilitated the collection, management, analysis and reporting of data. – BI software can answer basic question such as: • How many units did we sell last month? • What products did customer spend and how much? • How many credit card transaction were completed yesterday? – Using BI, we can create simple rules to flag exceptions automatically. • E.g. a bank can easily identify transaction greater than $10,000 to report to the IRS. Evolution of Business Analytics
  • 11.
    • Information Systems(IS) – BI has evolved into the modern discipline called Information System (IS). Evolution of Business Analytics
  • 12.
    • Statistics – Animportant element of business, driven to a large extent by the massive growth of data in today’s world. – Statistical method allow us to gain a richer understanding of data that goes beyond business intelligence reporting, not only by summarizing data succinctly but also finding unknown and interesting relationship among the data. – Include basic tools of description, exploration, estimation, and inference. – More advance technique like regression, forecasting and data mining. Evolution of Business Analytics
  • 13.
    • Operations research/Managementscience (OR/MS) – Operation research started from efforts to improve military operations prior to and during WWII. – Scientist then realize that the mathematical tools and technique developed could also be applied to problem in business and industries. – The term Management Sciences used to described the management of business applications. – Use modelling and optimization techniques for translating real problems into mathematics, spreadsheet or other computer languages. – Using them to find the best (optimal) solutions and decisions. Evolution of Business Analytics
  • 14.
    • Decision supportsystems (DSS) – Combine BI concepts with OR/MS models to create analytical based computer systems to support decision making. – Include three components: • Data management • Model management • Communication system – Used for many applications including pension fund management, portfolio management, work-shift schedule, distribution planning etc. Evolution of Business Analytics
  • 15.
  • 16.
    • Data Mining– focused on a better understanding characteristics and patterns among variables in large databases using a variety of statistical and analytical tools. • Simulation and Risk Analysis – relies on spreadsheet models and statistical analysis to examine the impact of uncertainty in the estimates and their potential interaction with one another on the output variable of interest. Perspective of Business Analytics
  • 17.
    • What-if Analysis–how specific combination of an inputs that reflect key assumptions will reflect model outputs. Also used to assess the sensitivity of optimization model to changes in data inputs and provide better insight for making good decisions. • Visualization – provide a way of easily communication data at all level of business and can reveal surprising patterns and relationships. Perspective of Business Analytics
  • 18.
    • Descriptive analytics –the use of data to understand past and current business performance and make informed decisions. – Commonly used and well understood type of analytics. – This technique categorize, characterize, consolidate, and classify data to convert it into useful information for the purposed of understanding and analyzing business performance. – How much did we sell in each region? – How many and what types of complaints did we resolve? – Which factory has the lowest productivity? Scope of Business Analytics
  • 19.
    • Predictive analytics –Predict the future by examining historical data, detecting patterns or relationships in these data, and then extrapolating these relationships forward in time. – E.g. a marketer might wish to predict the response of different customer segments to an advertising campaign . – Can predict risk and find relationships in data not readily apparent with traditional analyses. – Help to detect hidden patterns in large quantities of data to segment and group data into coherent sets to predict behavior and detect trends. – What will happen to our sale if demand fall by 10%? – What do we expect to pay for fuel over the next several months? – What is the risk of losing money in a new business venture? Scope of Business Analytics
  • 20.
    • Prescriptive analytics –Many business situation involve too many choices or alternatives for a human decision maker to effectively consider. – Uses optimization to identify the best alternatives to minimize or maximize some objective. – The mathematical and statistical techniques of predictive analytics can also be combined with optimization to make decision that take into account the uncertainty in the data. – How much should we produce to maximize profits? – What is the best way of shipping goods from our factories to minimize costs? Scope of Business Analytics
  • 21.
    �Most department storesclear seasonal inventory by reducing prices. �Key question: When to reduce the price and by how much to maximize revenue? �Potential applications of analytics: �Descriptive analytics: examine historical data for similar products (prices, units sold, advertising, …) �Predictive analytics: predict sales based on price �Prescriptive analytics: find the best sets of pricing and advertising to maximize sales revenue Example 1.1: Retail Markdown Decisions
  • 22.
    • IBM CognosExpress – An integrated business intelligence and planning solution designed to meet the needs of midsize companies, provides reporting, analysis, dashboard, scorecard, planning, budgeting and forecasting capabilities. • SAS Analytics – Predictive modeling and data mining, visualization, forecasting, optimization and model management, statistical analysis, text analytics, and more. • Tableau Software – Simple drag and drop tools for visualizing data from spreadsheets and other databases. Software Support
  • 23.
    �Data: numerical ortextual facts and figures that are collected through some type of measurement process. �Information: result of analyzing data; that is, extracting meaning from data to support evaluation and decision making. Data for Business Analytics
  • 24.
    �Annual reports �Accounting audits �Financialprofitability analysis �Economic trends �Marketing research �Operations management performance �Human resource measurements �Web behavior �page views, visitor’s country, time of view, length of time, origin and destination paths, products they searched for and viewed, products purchased, what reviews they read, and many others. Examples of Data Sources and Uses
  • 25.
    • Data set- a collection of data. – Examples: Marketing survey responses, a table of historical stock prices, and a collection of measurements of dimensions of a manufactured item. • Database - a collection of related files containing records on people, places, or things. – A database file is usually organized in a two- dimensional table, where the columns correspond to each individual element of data (called fields, or attributes), and the rows represent records of related data elements. Data Sets and Databases
  • 26.
    Example 1.2: ASales Transaction Database File Entities Records Fields or Attributes
  • 27.
    • Big datato refer to massive amounts of business data from a wide variety of sources, much of which is available in real time, and much of which is uncertain or unpredictable. IBM calls these characteristics volume, variety, velocity, and veracity. • “The effective use of big data has the potential to transform economies, delivering a new wave of productivity growth and consumer surplus. Using big data will become a key basis of competition for existing companies, and will create new competitors who are able to attract employees that have the critical skills for a big data world.” - McKinsey Global Institute, 2011 Big Data
  • 28.
    • Metric –unit of measurement that provides a way to objectively quantify performance. • Measurement – the act of obtaining data associated with a metric. • Measures – numerical values associated with a metric. • Discrete metric – derived from counting something e.g. number of order, number of errors etc. • Continuous metrics – based on a continuous scale of measurement. Metrics and Data Classification
  • 29.
    • Categorical (nominal)data – Sorted into categories according to specified characteristics. – E.g. customer by geographical region, employees designation etc. – No quantitative relationship to one another, but we usually assign arbitrary number to each category to ease the process of managing the data and computing statistics. – Usually counted as proportions or percentages. • Ordinal data – Data that can be ordered or ranked according to some relationships to one another. – More meaningful because data can be compared to one another. – E.g. rating a service as poor, average, good, very good or excellent – natural order – Have no fixed unit of measurement, so we cannot make meaningful numerical statement about different between categories. Type of Measurement Scale
  • 30.
    • Interval data –Ordinal data that have constant differences between observation and have arbitrary zero points. – Each point is placed at equal distance from one another. – E.g. time and temperature. – E.g. both Farenheit and Celcius scales represent a specified measure of distance – degrees – but have an arbitrary zero points. Thus we cannot take meaningful ratios. – E.g. we cannot say that 50 degrees is twice as hot as 25 degrees. • Ratio data – Continuous and have a natural zero. – Most business and economic data such as dollars and time. Type of Measurement Scale
  • 31.
    • Reliability – Dataare accurate and consistent. • Validity – Data correctly measure what they are supposed to measure. Data Reliability and Validity
  • 32.
    • Model -an abstraction or representation of a real system, idea, or object. – Captures the most important features of a problem and present them in a form that is easy to interpret. – Can be a written or verbal description of some phenomenon, a visual representation such as graph or a flowchart, a mathematical formula, or a spreadsheet representation. – Can be descriptive, predictive, or prescriptive. Models in Business Analytics
  • 33.
    • Decision Models –A logical or mathematical representation of a problem or business situation that can be used to understand, analyze, or facilitate making a decision. – Three types of inputs: • Data • Uncontrollable variable • Decision variable Models in Business Analytics Data, Uncontrollable Variables, and Decision Variables Decision Model Measures of Performance or Behaviour Input Output
  • 34.
    • Model Assumptions –Based on assumption that reflect the modeler’s view of the “real world”. – Some assumption are made to simplify the model and make it more traceable – able to be easily analyzed or solved. – Also made to better characyerized historical data or past observation. – The task of the modeler is to select or build an appropriate model that best represent the behavior of the real situation. – E.g. A demand prediction model. Models in Business Analytics
  • 35.
    • Uncertainty andRisk – The future is always uncertain. – Thus many predictive models incorporate uncertainty and help decision makers analyze the risks associated with their decisions. – Uncertainty – imperfect knowledge of what will happen. – Risk – associated with consequences and likelihood of what might happen. Models in Business Analytics
  • 36.
    • Prescriptive DecisionModels – Help decision makers to identify the best solution to a decision problem. – Optimization – a process of finding a set of values for decision variables that minimize or maximize some quantity of interest – profit, revenue, cost, time and so on – called the objective function. – Any set of decision variables that optimizes the objective function is called an optimal solution. Models in Business Analytics
  • 37.
    • Problem solvingconsists of six phases: 1) Recognizing a problem 2) Defining the problem 3) Structuring the problem 4) Analyzing the problem 5) Interpreting result and making decision 6) Implementing the solution Problem Solving with Analytics
  • 38.
    1) Recognizing aproblem – Managers faces different types of problems. • Allocating financial resources • Building or expanding facilities • Determining product mix • Strategically sourcing production • Develop distribution plans • Production and inventory schedules • Staffing plans • Analyze risks • Determine investment strategies • Making pricing decisions – Identifying the gap between what is happening and what we think should be happening. – E.g A consumer product manager feels that the distribution cost are too high Problem Solving with Analytics
  • 39.
    2) Defining theproblem – Finding the real problem and distinguishing it from symptoms that are observed is a critical steps. – E.g. High Distribution Cost – Why? Inefficiencies in routing trucks, poor location of distribution center, increasing fuel costs. Problem Solving with Analytics
  • 40.
    2) Defining theproblem – The complexity of a problem increases when the following occur: • The number of potential courses of action is large • The problems belongs to a group rather than to an individual • The problem solver has several competing objectives • External groups or individuals are affected by the problem • The problem solver and the true owner of the problem are not the same • Time limitations are important. Problem Solving with Analytics
  • 41.
    3) Structuring theproblem – Involves: • stating goals and objectives • characterizing the possible decisions • Identifying any constraints or restrictions – E.g redesign a distribution system – How? What? Which one? How much? Problem Solving with Analytics
  • 42.
    4) Analyzing theproblem – Involves some sort of experimentation or solution process such as: • Evaluating different scenarios • Analyzing risk associated with various decision alternatives • Finding a solution that meets certain goals • Determining an optimal solution Problem Solving with Analytics
  • 43.
    5) Interpreting resultsand making decision – Interpreting results from the analysis phase is crucial in making good decision. – Models cannot capture every details of the real problem, and managers must understand the limitation of models and their underlying assumptions and often incorporate judgment into making a decision. – Involves some sort of experimentation or solution process such as: • Evaluating different scenarios • Analyzing risk associated with various decision alternatives • Finding a solution that meets certain goals • Determining an optimal solution Problem Solving with Analytics
  • 44.
    6) Implementing thesolution – Making it works in the organization, or translating the results of a model back to the real world. – This generally requires: • Providing adequate resources • Motivating employees • Eliminating resistance to change • Modifying organizational policies • Developing trust. – Problems and their solutions affect people: customers, suppliers and employees. – Good communication skills is vital. Problem Solving with Analytics
  • 45.