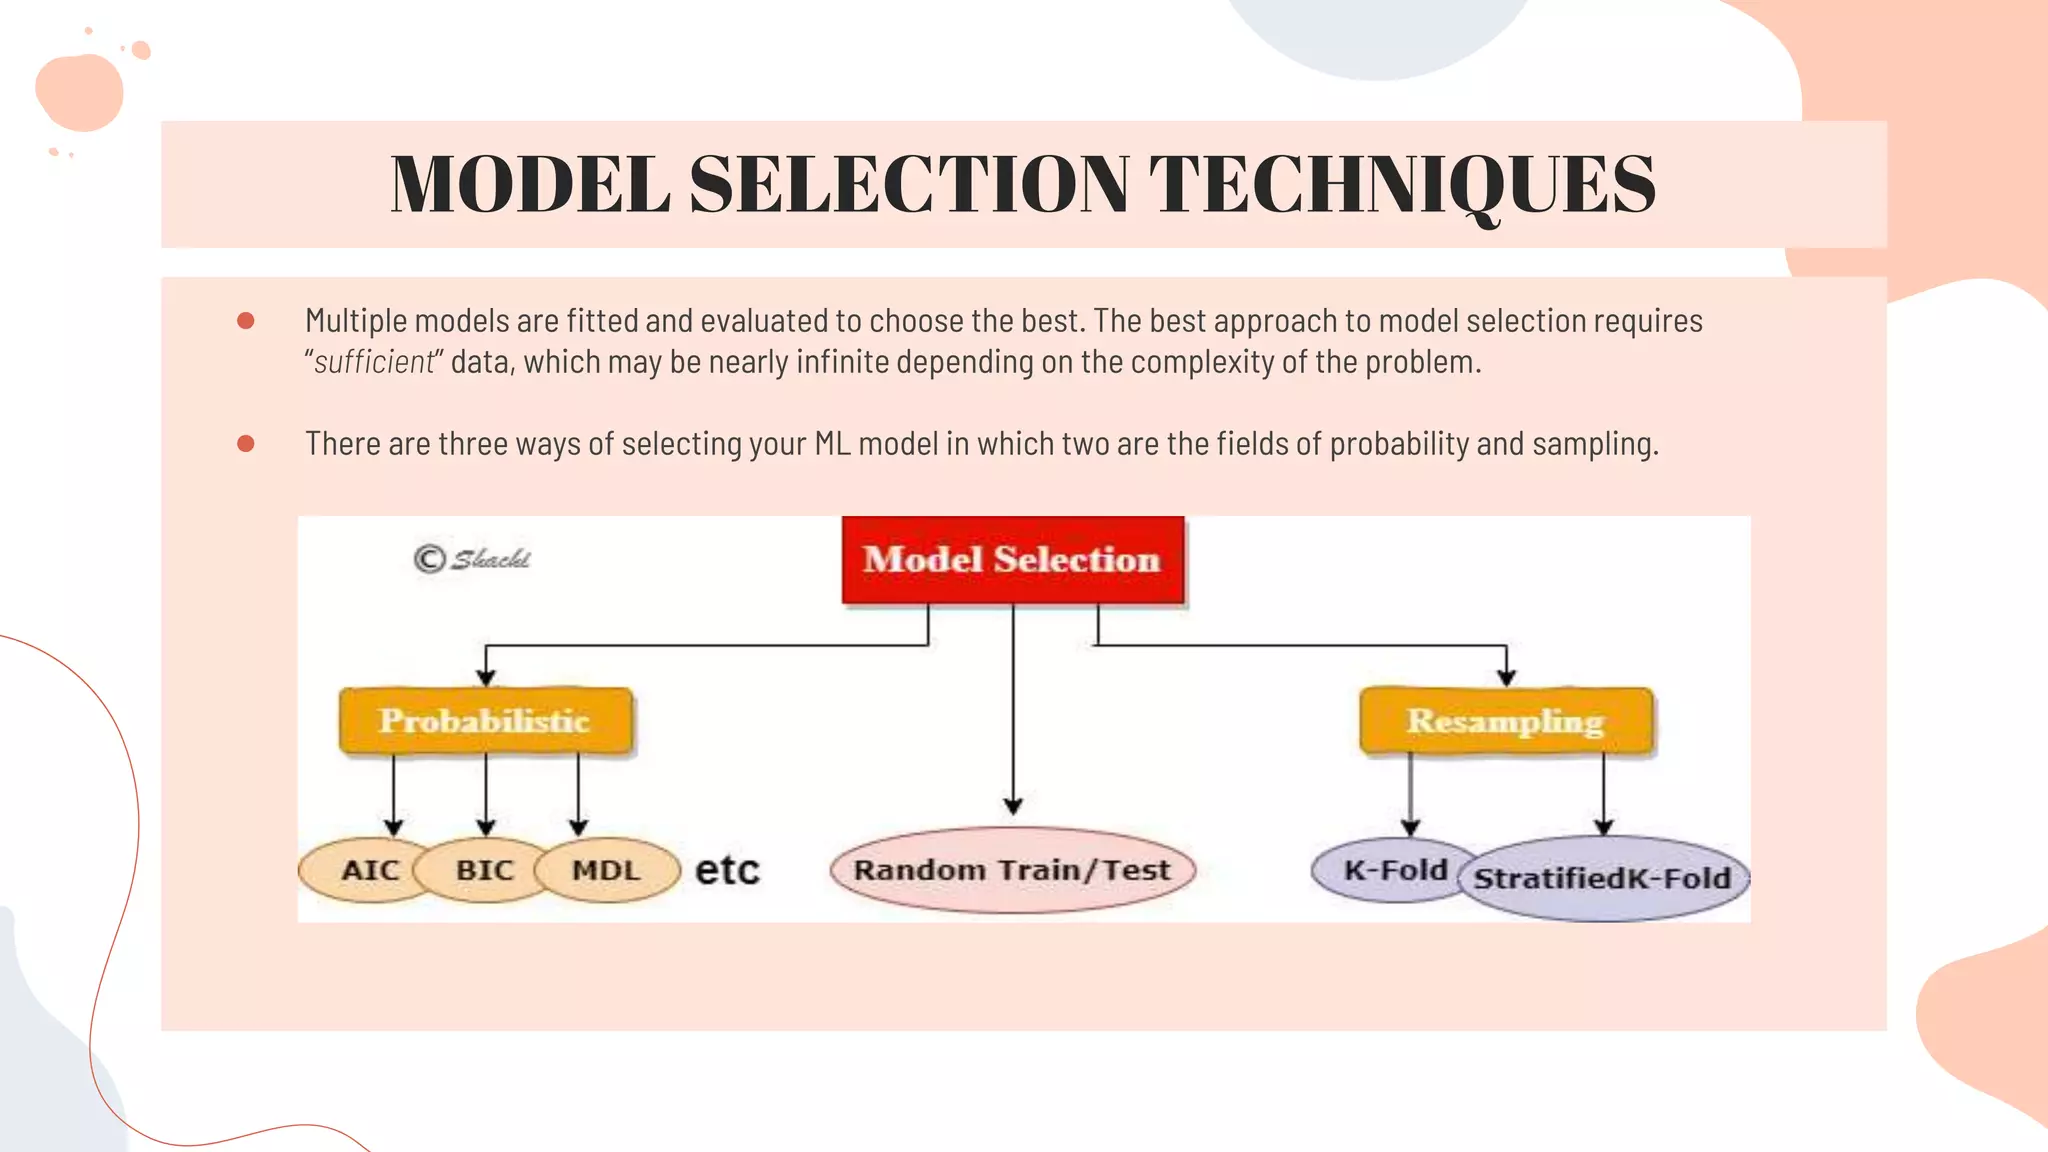
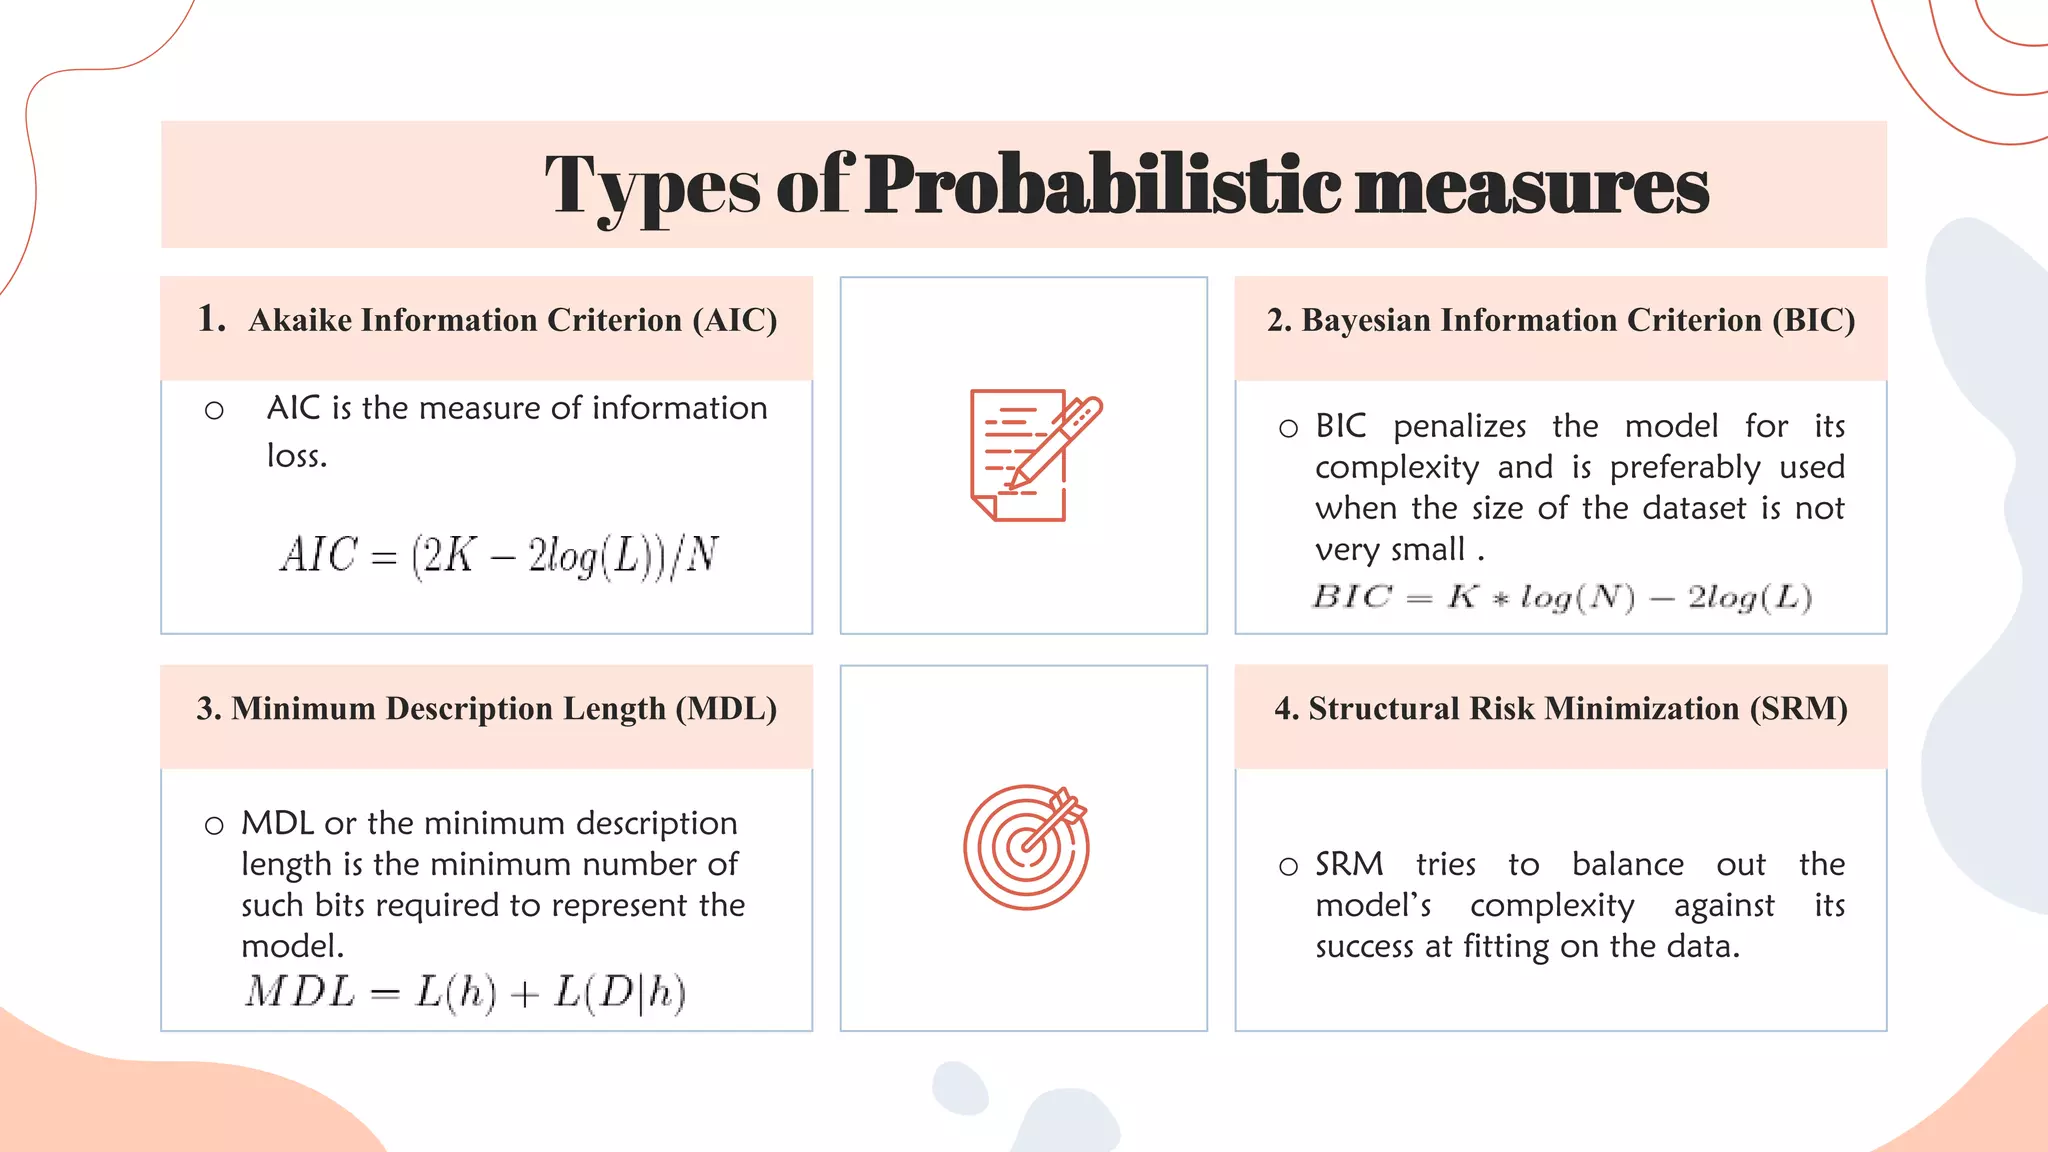
How to validate a model?
What is a best model ?
Types of data
Types of errors
The problem of over fitting
The problem of under fitting
Bias Variance Tradeoff
Cross validation
K-Fold Cross validation
Boot strap Cross validation
How to validate a model?
What is a best model ?
Types of data
Types of errors
The problem of over fitting
The problem of under fitting
Bias Variance Tradeoff
Cross validation
K-Fold Cross validation
Boot strap Cross validation
K-Folds cross-validation is one method that attempts to maximize the use of the available data for training and then testing a model. It is particularly useful for assessing model performance, as it provides a range of accuracy scores across (somewhat) different data sets.
Missing data handling is typically done in an ad-hoc way. Without understanding the repurcussions of a missing data handling technique, approaches that only let you get to the "next step" in your analytics pipeline leads to terrible outputs, conclusions that aren't robust and biased estimates. Handling missing data in data sets requires a structured approach. In this workshop, we will cover the key tenets of handling missing data in a structured way
Using Classification and Clustering with Azure Machine Learning Models shows how to use classification and clustering algorithms with Azure Machine Learning.
k-Means is a rather simple but well known algorithms for grouping objects, clustering. Again all objects need to be represented as a set of numerical features. In addition the user has to specify the number of groups (referred to as k) he wishes to identify. Each object can be thought of as being represented by some feature vector in an n dimensional space, n being the number of all features used to describe the objects to cluster. The algorithm then randomly chooses k points in that vector space, these point serve as the initial centers of the clusters. Afterwards all objects are each assigned to center they are closest to. Usually the distance measure is chosen by the user and determined by the learning task. After that, for each cluster a new center is computed by averaging the feature vectors of all objects assigned to it. The process of assigning objects and recomputing centers is repeated until the process converges. The algorithm can be proven to converge after a finite number of iterations. Several tweaks concerning distance measure, initial center choice and computation of new average centers have been explored, as well as the estimation of the number of clusters k. Yet the main principle always remains the same. In this project we will discuss about K-means clustering algorithm, implementation and its application to the problem of unsupervised learning
ENACTMENT RANKING OF SUPERVISED ALGORITHMS DEPENDENCE OF DATA SPLITTING ALGOR...ijnlc
We conducted comparative analysis of different supervised dimension reduction techniques by integrating a set of different data splitting algorithms and demonstrate the relative efficacy of learning algorithms dependence of sample complexity. The issue of sample complexity discussed in the dependence of data splitting algorithms. In line with the expectations, every supervised learning classifier demonstrated different capability for different data splitting algorithms and no way to calculate overall ranking of techniques was directly available. We specifically focused the classifier ranking dependence of data splitting algorithms and devised a model built on weighted average rank Weighted Mean Rank Risk Adjusted Model (WMRRAM) for consent ranking of learning classifier algorithms.
Identifying and classifying unknown Network Disruptionjagan477830
Since the evolution of modern technology and with the drastic increase in the scale of network communication more and more network disruptions in traffic and private protocols have been taking place. Identifying and classifying the unknown network disruptions can provide support and even help to maintain the backup systems.
Data Partitioning for Ensemble Model Buildingneirew J
In distributed ensemble model-building algorithms, the performance and statistical validity of models are
dependent on sizes of the input data partitions as well as the distribution of records among the partitions.
Failure to correctly select and pre-process the data often results in the models which are not stable and do
not perform well. This article introduces an optimized approach to building the ensemble models for very
large data sets in distributed map-reduce environments using Pass-Stream-Merge (PSM) algorithm. To
ensure the model correctness the input data is randomly distributed using the facilities built into mapreduce
frameworks.
DATA PARTITIONING FOR ENSEMBLE MODEL BUILDINGijccsa
In distributed ensemble model-building algorithms, the performance and statistical validity of models are
dependent on sizes of the input data partitions as well as the distribution of records among the partitions.
Failure to correctly select and pre-process the data often results in the models which are not stable and do
not perform well. This article introduces an optimized approach to building the ensemble models for very
large data sets in distributed map-reduce environments using Pass-Stream-Merge (PSM) algorithm. To
ensure the model correctness the input data is randomly distributed using the facilities built into mapreduce
frameworks.
Bank - Loan Purchase Modeling
This case is about a bank which has a growing customer base. Majority of these customers are liability customers (depositors) with varying size of deposits. The number of customers who are also borrowers (asset customers) is quite small, and the bank is interested in expanding this base rapidly to bring in more loan business and in the process, earn more through the interest on loans. In particular, the management wants to explore ways of converting its liability customers to personal loan customers (while retaining them as depositors). A campaign that the bank ran last year for liability customers showed a healthy conversion rate of over 9% success. This has encouraged the retail marketing department to devise campaigns with better target marketing to increase the success ratio with a minimal budget. The department wants to build a model that will help them identify the potential customers who have a higher probability of purchasing the loan. This will increase the success ratio while at the same time reduce the cost of the campaign. The dataset has data on 5000 customers. The data include customer demographic information (age, income, etc.), the customer's relationship with the bank (mortgage, securities account, etc.), and the customer response to the last personal loan campaign (Personal Loan). Among these 5000 customers, only 480 (= 9.6%) accepted the personal loan that was offered to them in the earlier campaign.
Our job is to build the best model which can classify the right customers who have a higher probability of purchasing the loan. We are expected to do the following:
EDA of the data available. Showcase the results using appropriate graphs
Apply appropriate clustering on the data and interpret the output .
Build appropriate models on both the test and train data (CART & Random Forest). Interpret all the model outputs and do the necessary modifications wherever eligible (such as pruning).
Check the performance of all the models that you have built (test and train). Use all the model performance measures you have learned so far. Share your remarks on which model performs the best.
Overview of the fundamental roles in Hydropower generation and the components involved in wider Electrical Engineering.
This paper presents the design and construction of hydroelectric dams from the hydrologist’s survey of the valley before construction, all aspects and involved disciplines, fluid dynamics, structural engineering, generation and mains frequency regulation to the very transmission of power through the network in the United Kingdom.
Author: Robbie Edward Sayers
Collaborators and co editors: Charlie Sims and Connor Healey.
(C) 2024 Robbie E. Sayers
CFD Simulation of By-pass Flow in a HRSG module by R&R Consult.pptxR&R Consult
CFD analysis is incredibly effective at solving mysteries and improving the performance of complex systems!
Here's a great example: At a large natural gas-fired power plant, where they use waste heat to generate steam and energy, they were puzzled that their boiler wasn't producing as much steam as expected.
R&R and Tetra Engineering Group Inc. were asked to solve the issue with reduced steam production.
An inspection had shown that a significant amount of hot flue gas was bypassing the boiler tubes, where the heat was supposed to be transferred.
R&R Consult conducted a CFD analysis, which revealed that 6.3% of the flue gas was bypassing the boiler tubes without transferring heat. The analysis also showed that the flue gas was instead being directed along the sides of the boiler and between the modules that were supposed to capture the heat. This was the cause of the reduced performance.
Based on our results, Tetra Engineering installed covering plates to reduce the bypass flow. This improved the boiler's performance and increased electricity production.
It is always satisfying when we can help solve complex challenges like this. Do your systems also need a check-up or optimization? Give us a call!
Work done in cooperation with James Malloy and David Moelling from Tetra Engineering.
More examples of our work https://www.r-r-consult.dk/en/cases-en/
Event Management System Vb Net Project Report.pdfKamal Acharya
In present era, the scopes of information technology growing with a very fast .We do not see any are untouched from this industry. The scope of information technology has become wider includes: Business and industry. Household Business, Communication, Education, Entertainment, Science, Medicine, Engineering, Distance Learning, Weather Forecasting. Carrier Searching and so on.
My project named “Event Management System” is software that store and maintained all events coordinated in college. It also helpful to print related reports. My project will help to record the events coordinated by faculties with their Name, Event subject, date & details in an efficient & effective ways.
In my system we have to make a system by which a user can record all events coordinated by a particular faculty. In our proposed system some more featured are added which differs it from the existing system such as security.
Immunizing Image Classifiers Against Localized Adversary Attacksgerogepatton
This paper addresses the vulnerability of deep learning models, particularly convolutional neural networks
(CNN)s, to adversarial attacks and presents a proactive training technique designed to counter them. We
introduce a novel volumization algorithm, which transforms 2D images into 3D volumetric representations.
When combined with 3D convolution and deep curriculum learning optimization (CLO), itsignificantly improves
the immunity of models against localized universal attacks by up to 40%. We evaluate our proposed approach
using contemporary CNN architectures and the modified Canadian Institute for Advanced Research (CIFAR-10
and CIFAR-100) and ImageNet Large Scale Visual Recognition Challenge (ILSVRC12) datasets, showcasing
accuracy improvements over previous techniques. The results indicate that the combination of the volumetric
input and curriculum learning holds significant promise for mitigating adversarial attacks without necessitating
adversary training.
COLLEGE BUS MANAGEMENT SYSTEM PROJECT REPORT.pdfKamal Acharya
The College Bus Management system is completely developed by Visual Basic .NET Version. The application is connect with most secured database language MS SQL Server. The application is develop by using best combination of front-end and back-end languages. The application is totally design like flat user interface. This flat user interface is more attractive user interface in 2017. The application is gives more important to the system functionality. The application is to manage the student’s details, driver’s details, bus details, bus route details, bus fees details and more. The application has only one unit for admin. The admin can manage the entire application. The admin can login into the application by using username and password of the admin. The application is develop for big and small colleges. It is more user friendly for non-computer person. Even they can easily learn how to manage the application within hours. The application is more secure by the admin. The system will give an effective output for the VB.Net and SQL Server given as input to the system. The compiled java program given as input to the system, after scanning the program will generate different reports. The application generates the report for users. The admin can view and download the report of the data. The application deliver the excel format reports. Because, excel formatted reports is very easy to understand the income and expense of the college bus. This application is mainly develop for windows operating system users. In 2017, 73% of people enterprises are using windows operating system. So the application will easily install for all the windows operating system users. The application-developed size is very low. The application consumes very low space in disk. Therefore, the user can allocate very minimum local disk space for this application.
Welcome to WIPAC Monthly the magazine brought to you by the LinkedIn Group Water Industry Process Automation & Control.
In this month's edition, along with this month's industry news to celebrate the 13 years since the group was created we have articles including
A case study of the used of Advanced Process Control at the Wastewater Treatment works at Lleida in Spain
A look back on an article on smart wastewater networks in order to see how the industry has measured up in the interim around the adoption of Digital Transformation in the Water Industry.
Saudi Arabia stands as a titan in the global energy landscape, renowned for its abundant oil and gas resources. It's the largest exporter of petroleum and holds some of the world's most significant reserves. Let's delve into the top 10 oil and gas projects shaping Saudi Arabia's energy future in 2024.
Cosmetic shop management system project report.pdfKamal Acharya
Buying new cosmetic products is difficult. It can even be scary for those who have sensitive skin and are prone to skin trouble. The information needed to alleviate this problem is on the back of each product, but it's thought to interpret those ingredient lists unless you have a background in chemistry.
Instead of buying and hoping for the best, we can use data science to help us predict which products may be good fits for us. It includes various function programs to do the above mentioned tasks.
Data file handling has been effectively used in the program.
The automated cosmetic shop management system should deal with the automation of general workflow and administration process of the shop. The main processes of the system focus on customer's request where the system is able to search the most appropriate products and deliver it to the customers. It should help the employees to quickly identify the list of cosmetic product that have reached the minimum quantity and also keep a track of expired date for each cosmetic product. It should help the employees to find the rack number in which the product is placed.It is also Faster and more efficient way.
About
Indigenized remote control interface card suitable for MAFI system CCR equipment. Compatible for IDM8000 CCR. Backplane mounted serial and TCP/Ethernet communication module for CCR remote access. IDM 8000 CCR remote control on serial and TCP protocol.
• Remote control: Parallel or serial interface.
• Compatible with MAFI CCR system.
• Compatible with IDM8000 CCR.
• Compatible with Backplane mount serial communication.
• Compatible with commercial and Defence aviation CCR system.
• Remote control system for accessing CCR and allied system over serial or TCP.
• Indigenized local Support/presence in India.
• Easy in configuration using DIP switches.
Technical Specifications
Indigenized remote control interface card suitable for MAFI system CCR equipment. Compatible for IDM8000 CCR. Backplane mounted serial and TCP/Ethernet communication module for CCR remote access. IDM 8000 CCR remote control on serial and TCP protocol.
Key Features
Indigenized remote control interface card suitable for MAFI system CCR equipment. Compatible for IDM8000 CCR. Backplane mounted serial and TCP/Ethernet communication module for CCR remote access. IDM 8000 CCR remote control on serial and TCP protocol.
• Remote control: Parallel or serial interface
• Compatible with MAFI CCR system
• Copatiable with IDM8000 CCR
• Compatible with Backplane mount serial communication.
• Compatible with commercial and Defence aviation CCR system.
• Remote control system for accessing CCR and allied system over serial or TCP.
• Indigenized local Support/presence in India.
Application
• Remote control: Parallel or serial interface.
• Compatible with MAFI CCR system.
• Compatible with IDM8000 CCR.
• Compatible with Backplane mount serial communication.
• Compatible with commercial and Defence aviation CCR system.
• Remote control system for accessing CCR and allied system over serial or TCP.
• Indigenized local Support/presence in India.
• Easy in configuration using DIP switches.
Explore the innovative world of trenchless pipe repair with our comprehensive guide, "The Benefits and Techniques of Trenchless Pipe Repair." This document delves into the modern methods of repairing underground pipes without the need for extensive excavation, highlighting the numerous advantages and the latest techniques used in the industry.
Learn about the cost savings, reduced environmental impact, and minimal disruption associated with trenchless technology. Discover detailed explanations of popular techniques such as pipe bursting, cured-in-place pipe (CIPP) lining, and directional drilling. Understand how these methods can be applied to various types of infrastructure, from residential plumbing to large-scale municipal systems.
Ideal for homeowners, contractors, engineers, and anyone interested in modern plumbing solutions, this guide provides valuable insights into why trenchless pipe repair is becoming the preferred choice for pipe rehabilitation. Stay informed about the latest advancements and best practices in the field.
3. MODEL SELECTION TECHNIQUES
● Multiple models are fitted and evaluated to choose the best. The best approach to model selection requires
“sufficient” data, which may be nearly infinite depending on the complexity of the problem.
● There are three ways of selecting your ML model in which two are the fields of probability and sampling.
4. 1. Random Train/Test Split
Random Splits are used to randomly sample a percentage of data
into training, testing, and preferably validation sets.
Data to be passed in model is divided into train and test, ratio wise.
This can be achieved using train_test_split function of scikit-learn
python library.
On re-running of train_test_split data code, results come out to be
different on each run of code. So, you aren’t sure how exactly your
model will perform on unseen data.
The advantage of this method is that there is a good chance that the
original population is well represented in all the three sets. In more
formal terms, random splitting will prevent a biased sampling of data.
5. 2. Resampling
In resampling technique of model selection, for a set of
iterations, data is resampled into train/test followed by
training on train and evaluation on test set.
Model chosen from this technique is assessed based on
performance, not the model complexity.
Performance is computed on out-of-sample data.
Resampling techniques estimate the error by evaluating
out-of-sample data aka unseen data.
- Strategies of resampling are such as K-Fold,
StratifiedK-Fold etc.
7. Time – Based Split
There are some types of data where random splits are
not possible.
For example, if we have to train a model for weather
forecasting, we cannot randomly divide the data into
training and testing sets. This will jumble up the seasonal
pattern! Such data is often referred to by the term – Time
Series.
In such cases, a time-wise split is used. The training set
can have data for the last three years and 10 months of
the present year. The last two months can be reserved
for the testing or validation set.
However, the drawback of time-series data is that the
events or data points are not mutually independent.
One event might affect every data input that follows
after.
8. K-Fold Cross-Validation
The cross-validation technique works by randomly shuffling the
dataset and then splitting it into k groups. Thereafter, on iterating
over each group, the group needs to be considered as a test set
while all other groups are clubbed together into the training set.
The model is tested on the test group and the process continues for
k groups.
Thus, by the end of the process, one has k different results on k
different test groups. The best model can then be selected easily by
choosing the one with the highest score.
9. Stratified K-Fold
The process for stratified K-Fold is similar to that of K-
Fold cross-validation with one single point of difference –
unlike in k-fold cross-validation, the values of the
target variable is taken into consideration in
stratified k-fold.
If for instance, the target variable is a categorical variable
with 2 classes, then stratified k-fold ensures that each
test fold gets an equal ratio of the two classes when
compared to the training set.
This makes the model evaluation more accurate and the
model training less biased.
10. Bootstrap
Bootstrap is one of the most powerful ways to obtain a stabilized model.
The first step is to select a sample size (which is usually equal to the size of
the original dataset). Thereafter, a sample data point must be randomly
selected from the original dataset and added to the bootstrap sample. After
the addition, the sample needs to be put back into the original sample. This
process needs to be repeated for N times, where N is the sample size.
Therefore, it is a resampling technique that creates the bootstrap sample
by sampling data points from the original dataset with replacement.
The model is trained on the bootstrap sample and then evaluated on all
those data points that did not make it to the bootstrapped sample. These
are called the out-of-bag samples.
11. 3. Probabilistic measures
Probabilistic Measures do not just take into account the model
performance but also the model complexity.
Model complexity is the measure of the model’s ability to capture
the variance in the data.
For example, a highly biased model like the linear regression
algorithm is less complex and on the other hand, a neural network is
very high on complexity.
A fair bit of disadvantage however lies in the fact that probabilistic
measures do not consider the uncertainty of the models and has a
chance of selecting simpler models over complex models.
e
12. o SRM tries to balance out the
model’s complexity against its
success at fitting on the data.
o MDL or the minimum description
length is the minimum number of
such bits required to represent the
model.
o BIC penalizes the model for its
complexity and is preferably used
when the size of the dataset is not
very small .
o AIC is the measure of information
loss.
2. Bayesian Information Criterion (BIC)
1. Akaike Information Criterion (AIC)
4. Structural Risk Minimization (SRM)
3. Minimum Description Length (MDL)
Types of Probabilistic measures
13. Thank You !!
For more Information visit on :
(https://neptune.ai/blog/the-ultimate-guide-to-evaluation-and-selection-of-
models-in-machine-learning)