Downloaded 11 times
![16
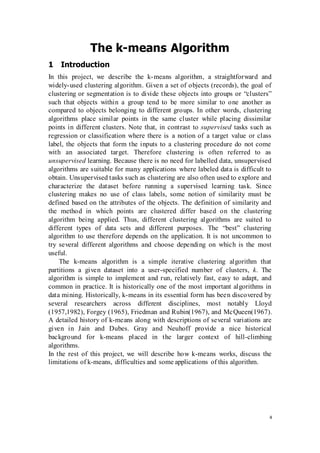
their closest cluster, the jth cluster will have zero points assigned to it. That is,
cluster j is now an empty cluster. The standard algorithm does not guard
against empty clusters, but simple extensions (such as reinitializing the cluster
representative of the empty cluster or “stealing” some points from the largest
cluster) are possible.
7 Available software
Because of the k-means algorithm’s simplicity, effectiveness, and historical
importance, software to run the k-means algorithm is readily available in
several forms. It is a standard feature in many popular data mining software
packages. For example, it can be found in Weka or in SAS under the
FASTCLUS procedure. It is also commonly included as add-ons to existing
software. For example, several implementations of k-means are available as
parts of various toolboxes in Matlab. k-means is also available in Microsoft
Excel after adding XL Miner. Finally, several stand-alone versions of
k-means exist and can be easily found on the Internet. The algorithm is also
straightforward to code, and the reader is encouraged to create their own
implementation of k-means as an exercise.
8 Applications of the k-Means Clustering Algorithm
Briefly, optical character recognition, speech recognition, and
encoding/decoding as example applications of k-means. However, a survey
of the literature on the subject offers a more in depth treatment of some other
practical applications, such as "data detection … for burst-mode optical
receiver[s]", and recognition of musical genres. Researchers describe
"burst-mode data-transmission systems," a "significant feature of burst-mode
data transmissions is that due to unequal distances between" sender and
receivers, "signal attenuation is not the same" for all receivers. Because of
this, "conventional receivers are not suitable for burst-mode data
transmissions." The importance, they note, is that many "high-speed optical
multi-access network applications, [such as] optical bus networks [and]
WDMA optical star networks" can use burst-mode receivers.
In their paper, they provide a "new, efficient burst-mode signal detection
scheme" that utilizes "a two-step data clustering method based on a K-means
algorithm." They go on to explain that "the burst-mode signal detection](https://image.slidesharecdn.com/neuralnwk-means-160423180202/85/Neural-nw-k-means-16-320.jpg)
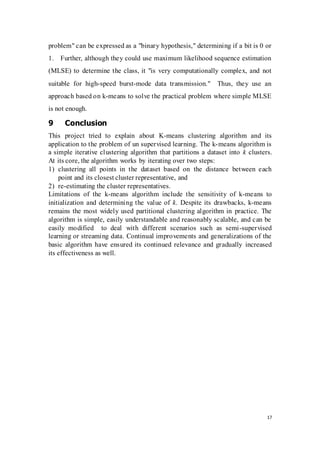

![19
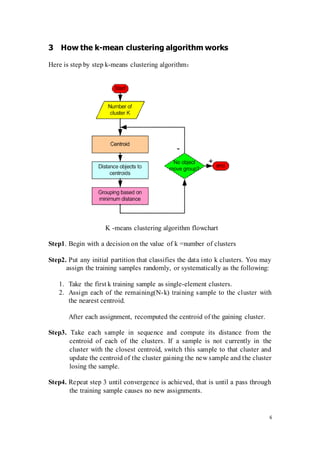
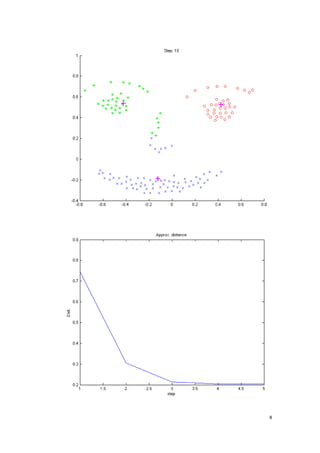
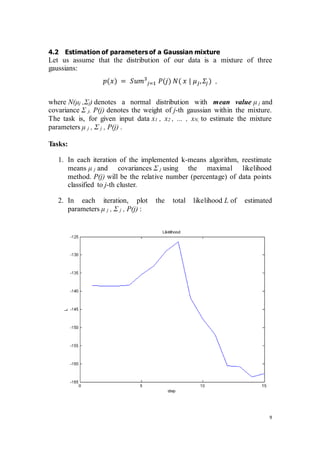
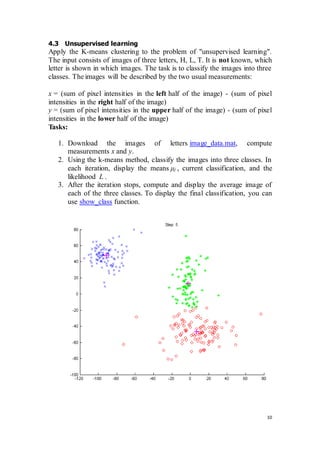
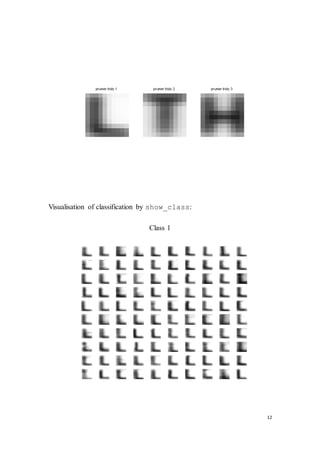
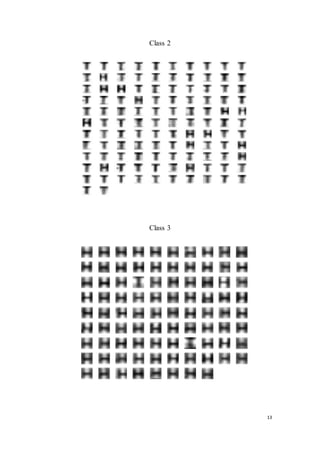
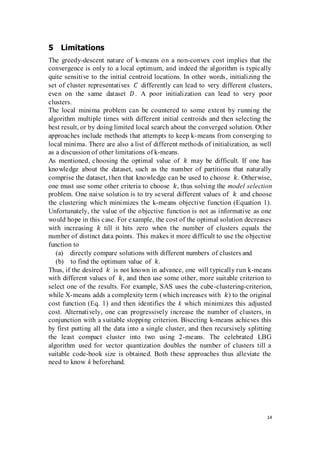
Matlab codes for unsupervised learning task
clear;close all;
load('data.mat'); % X = 2x140
%% cast 1
model = kminovec(X, 4, 10, 1);
%% cast 2
% clear
Gmodel.Mean = [-2,1;1,1;0,-1]';
Gmodel.Cov (:, :, 1) = [ 0.1 0; 0 0.1];
Gmodel.Cov (:, :, 2) = [ 0.3 0; 0 0.3];
Gmodel.Cov (:, :, 3) = [ 0.01 0; 0 0.5];
Gmodel.Prior = [0.4;0.4;0.2];
gmm = gmmsamp(Gmodel, 100);
figure(gcf);clf;
ppatterns(gmm.X, gmm.y);
axis([-3 3 -3 3]);
model = kminovec(gmm.X, 3, 10, 1, gmm);
figure(gcf);plot(model.L);
%% cast 3
data = load('image_data.mat');
for i = 1:size(data.images, 3)
% soucet sum leva - prava cast obrazku
pX(i) = sum(sum(data.images(:, 1:floor(end/2) , i))) ...
- sum(sum(data.images(:, (floor(end/2)+1):end , i)));
% soucet sum horni - dolni
pY(i) = sum(sum(data.images(1:floor(end/2),: , i))) ...
- sum(sum(data.images((floor(end/2)+1):end , :, i)));
end
model = kminovec([pX;pY], 3, 10, 1);
show_class(data.images, model.class');
%% d
model = struct('Mean',[-2 3; 5 8],'Cov',[1 0.5],'Prior',[0.4 0.6;0]);
figure; hold on;
plot([-4:0.1:5], pdfgmm([-4:0.1:5],model),'r');
sample = gmmsamp(model,500);
[Y,X] = hist(sample.X,10);
bar(X,Y/500);](https://image.slidesharecdn.com/neuralnwk-means-160423180202/85/Neural-nw-k-means-19-320.jpg)

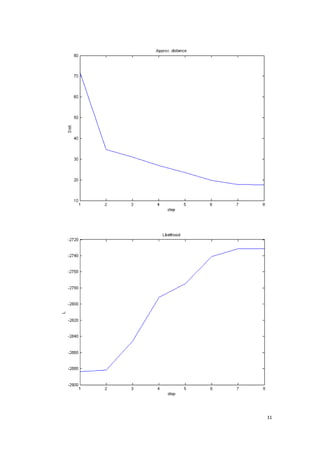
The document provides an overview of the k-means algorithm, a widely-used method for clustering data into user-specified groups, or 'clusters'. It details the algorithm's functionality, limitations, and its application in unsupervised learning, including step-by-step instructions for its implementation. The document also addresses difficulties encountered with k-means, such as sensitivity to initializations and the challenge of selecting the number of clusters.