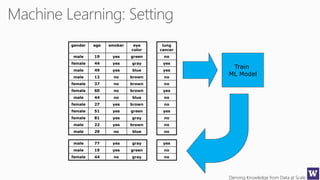
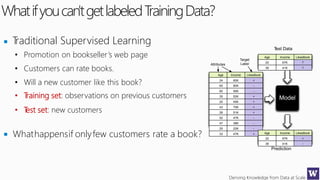
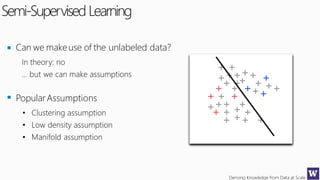
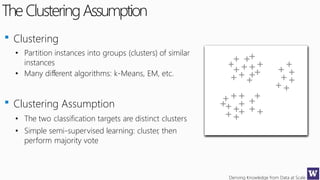
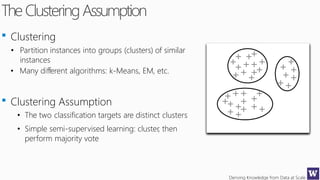
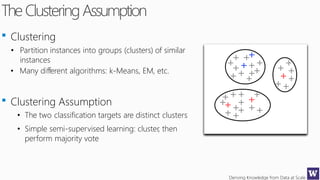
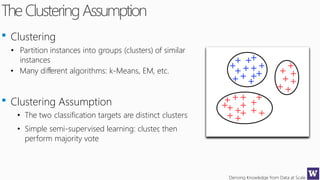
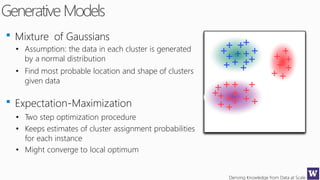
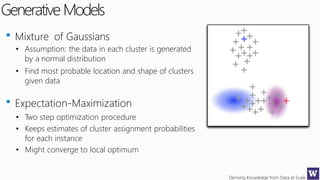
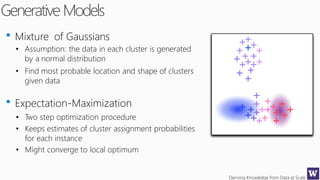
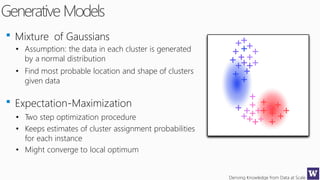
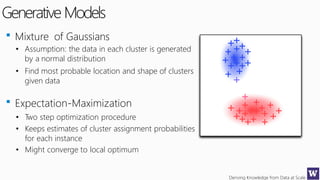
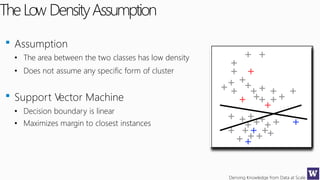
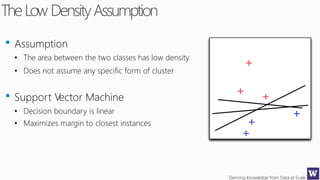
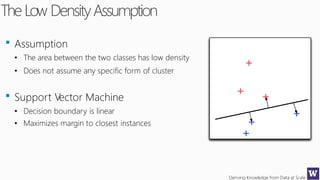
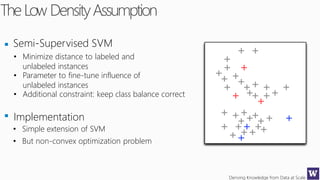
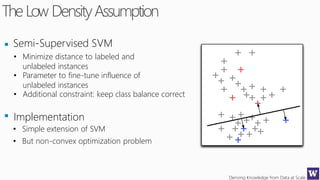
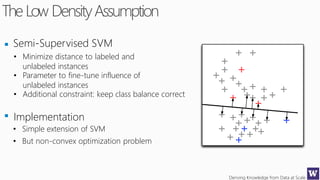
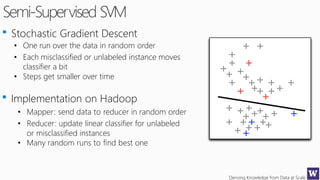
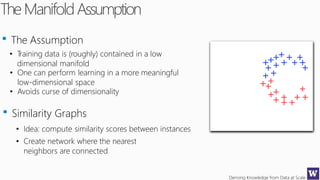
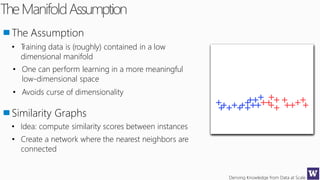
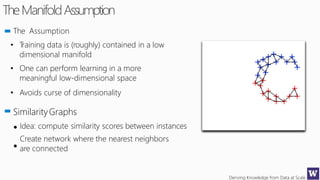
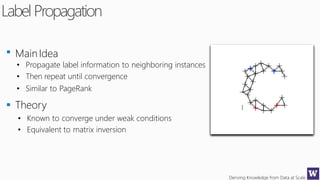
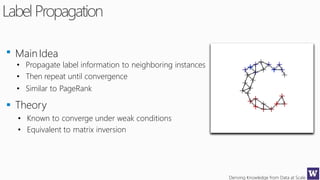
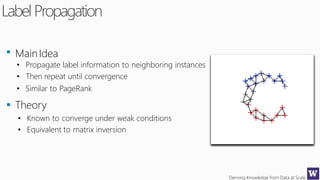
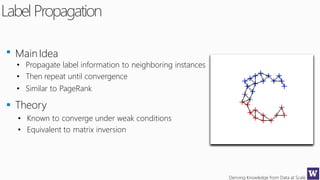
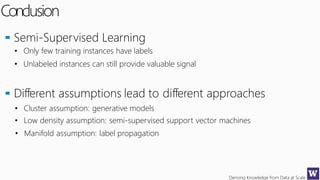
This document discusses various techniques for machine learning when labeled training data is limited, including semi-supervised learning approaches that make use of unlabeled data. It describes assumptions like the clustering assumption, low density assumption, and manifold assumption that allow algorithms to learn from unlabeled data. Specific techniques covered include clustering algorithms, mixture models, self-training, and semi-supervised support vector machines.
Machine Learning has become a must to improve insight, quality and time to market. But it's also been called the 'high interest credit card of technical debt' with challenges in managing both how it's applied and how its results are consumed.
If you are curious what is ML all about, this is a gentle introduction to Machine Learning and Deep Learning. This includes questions such as why ML/Data Analytics/Deep Learning ? Intuitive Understanding o how they work and some models in detail. At last I share some useful resources to get started.
H2O World - Top 10 Data Science Pitfalls - Mark LandrySri Ambati
H2O World 2015 - Mark Landry
Powered by the open source machine learning software H2O.ai. Contributors welcome at: https://github.com/h2oai
To view videos on H2O open source machine learning software, go to: https://www.youtube.com/user/0xdata
Machine Learning and Real-World ApplicationsMachinePulse
This presentation was created by Ajay, Machine Learning Scientist at MachinePulse, to present at a Meetup on Jan. 30, 2015. These slides provide an overview of widely used machine learning algorithms. The slides conclude with examples of real world applications.
Ajay Ramaseshan, is a Machine Learning Scientist at MachinePulse. He holds a Bachelors degree in Computer Science from NITK, Suratkhal and a Master in Machine Learning and Data Mining from Aalto University School of Science, Finland. He has extensive experience in the machine learning domain and has dealt with various real world problems.
Fairly Measuring Fairness In Machine LearningHJ van Veen
We look at a case and two research papers on measuring discrimination in machine learning models for extending credit. Presentation given as part of the Sao Paulo Machine Learning Meetup, theme "Ethics in Data Science".
Top 10 Data Science Practitioner PitfallsSri Ambati
Top 10 Data Science Practitioner Pitfalls Meetup with Erin LeDell and Mark Landry on 09.09.15
- Powered by the open source machine learning software H2O.ai. Contributors welcome at: https://github.com/h2oai
- To view videos on H2O open source machine learning software, go to: https://www.youtube.com/user/0xdata
Heuristic design of experiments w meta gradient searchGreg Makowski
Once you have started learning about predictive algorithms, and the basic knowledge discovery in databases process, what is the next level of detail to learn for a consulting project?
* Give examples of the many model training parameters
* Track results in a "model notebook"
* Use a model metric that combines both accuracy and generalization to rank models
* How to strategically search over the model training parameters - use a gradient descent approach
* One way to describe an arbitrarily complex predictive system is by using sensitivity analysis
H2O World - Top 10 Deep Learning Tips & Tricks - Arno CandelSri Ambati
H2O World 2015 - Arno Candel
- Powered by the open source machine learning software H2O.ai. Contributors welcome at: https://github.com/h2oai
- To view videos on H2O open source machine learning software, go to: https://www.youtube.com/user/0xdata
Provides a brief overview of what machine learning is, how it works (theory), how to prepare data for a machine learning problem, an example case study, and additional resources.
Delta Analytics is a 501(c)3 non-profit in the Bay Area. We believe that data is powerful, and that anybody should be able to harness it for change. Our teaching fellows partner with schools and organizations worldwide to work with students excited about the power of data to do good.
Welcome to the course! These modules will teach you the fundamental building blocks and the theory necessary to be a responsible machine learning practitioner in your own community. Each module focuses on accessible examples designed to teach you about good practices and the powerful (yet surprisingly simple) algorithms we use to model data.
To learn more about our mission or provide feedback, take a look at www.deltanalytics.org.
This Edureka Machine Learning Algorithms tutorial will help you understand all the basics of machine learning and different kind of algorithms along with examples. This tutorial is ideal for both beginners as well as professionals who want to learn or brush up their Data Science concepts. Below are the topics covered in this tutorial:
1. What is an Algorithm?
2. What is Machine Learning?
3. How is a problem solved using Machine Learning?
4. Types of Machine Learning
5. Machine Learning Algorithms
Data Science, Machine Learning and Neural NetworksBICA Labs
Lecture briefly overviewing state of the art of Data Science, Machine Learning and Neural Networks. Covers main Artificial Intelligence technologies, Data Science algorithms, Neural network architectures and cloud computing facilities enabling the whole stack.
Types of Machine Learning- Tanvir Siddike MoinTanvir Moin
Machine learning can be broadly categorized into four main types based on how they learn from data:
Supervised Learning: Imagine a teacher showing you labeled examples (like classifying pictures of cats and dogs). Supervised learning algorithms learn from labeled data, where each data point has a corresponding answer or label. The algorithm analyzes the data and learns to map the inputs to the desired outputs. This is commonly used for tasks like spam filtering, image recognition, and weather prediction.
Unsupervised Learning: Unlike supervised learning, unsupervised learning deals with unlabeled data. It's like being given a pile of toys and asked to organize them however you see fit. The algorithm finds hidden patterns or structures within the data. This is useful for tasks like customer segmentation, anomaly detection, and recommendation systems.
Reinforcement Learning: This is inspired by how humans learn through trial and error. The algorithm interacts with its environment and receives rewards for good decisions and penalties for bad ones. Over time, it learns to take actions that maximize the rewards. This is used in applications like training self-driving cars and playing games like chess.
Semi-Supervised Learning: This combines aspects of supervised and unsupervised learning. It leverages a small amount of labeled data along with a larger amount of unlabeled data to improve the learning process. This is beneficial when labeled data is scarce or expensive to obtain.
In this presentation I review various data science techniques and discuss their usefulness to pricing actuaries working in general insurance.
This presentation was originally given at the TIGI webinar in 2020.
https://www.actuaries.org.uk/learn-develop/attend-event/tigi-2020-technical-issues-general-insurance
BA is used to gain insights that inform business decisions and can be used to automate and optimize business processes. Data-driven companies treat their data as a corporate asset and leverage it for a competitive advantage. Successful business analytics depends on data quality, skilled analysts who understand the technologies and the business, and an organizational commitment to data-driven decision-making.
Business analytics examples
Business analytics techniques break down into two main areas. The first is basic business intelligence. This involves examining historical data to get a sense of how a business department, team or staff member performed over a particular time. This is a mature practice that most enterprises are fairly accomplished at using.
Identifying and classifying unknown Network Disruptionjagan477830
Since the evolution of modern technology and with the drastic increase in the scale of network communication more and more network disruptions in traffic and private protocols have been taking place. Identifying and classifying the unknown network disruptions can provide support and even help to maintain the backup systems.
Week 4 advanced labeling, augmentation and data preprocessingAjay Taneja
This is the Machine Learning Engineering in Production Course notes. This is the Week 4 of Machine Learning Data Life Cycle in Production (Course 2) course. This is the course 2 of MLOps specialization on coursera
Top 10 Data Science Practitioner PitfallsSri Ambati
Over-fitting, misread data, NAs, collinear column elimination and other common issues play havoc in the day of practicing data scientist. In this talk, Mark Landry, one of the world’s leading Kagglers, will review the top 10 common pitfalls and steps to avoid them.
- Powered by the open source machine learning software H2O.ai. Contributors welcome at: https://github.com/h2oai
- To view videos on H2O open source machine learning software, go to: https://www.youtube.com/user/0xdata
Python software development provides ease of programming to the developers and gives quick results for any kind of projects. Suma Soft is an expert company providing complete Python software development services for small, mid and big level companies. It holds an expertise for 19 years and is backed up by a strong patronage. To know more- https://www.sumasoft.com/python-software-development
Talk presented at Strata'18 on unsupervised machine learning algorithms that operate on streams of data, continuously evolving as data streams through the system.
Show drafts
volume_up
Empowering the Data Analytics Ecosystem: A Laser Focus on Value
The data analytics ecosystem thrives when every component functions at its peak, unlocking the true potential of data. Here's a laser focus on key areas for an empowered ecosystem:
1. Democratize Access, Not Data:
Granular Access Controls: Provide users with self-service tools tailored to their specific needs, preventing data overload and misuse.
Data Catalogs: Implement robust data catalogs for easy discovery and understanding of available data sources.
2. Foster Collaboration with Clear Roles:
Data Mesh Architecture: Break down data silos by creating a distributed data ownership model with clear ownership and responsibilities.
Collaborative Workspaces: Utilize interactive platforms where data scientists, analysts, and domain experts can work seamlessly together.
3. Leverage Advanced Analytics Strategically:
AI-powered Automation: Automate repetitive tasks like data cleaning and feature engineering, freeing up data talent for higher-level analysis.
Right-Tool Selection: Strategically choose the most effective advanced analytics techniques (e.g., AI, ML) based on specific business problems.
4. Prioritize Data Quality with Automation:
Automated Data Validation: Implement automated data quality checks to identify and rectify errors at the source, minimizing downstream issues.
Data Lineage Tracking: Track the flow of data throughout the ecosystem, ensuring transparency and facilitating root cause analysis for errors.
5. Cultivate a Data-Driven Mindset:
Metrics-Driven Performance Management: Align KPIs and performance metrics with data-driven insights to ensure actionable decision making.
Data Storytelling Workshops: Equip stakeholders with the skills to translate complex data findings into compelling narratives that drive action.
Benefits of a Precise Ecosystem:
Sharpened Focus: Precise access and clear roles ensure everyone works with the most relevant data, maximizing efficiency.
Actionable Insights: Strategic analytics and automated quality checks lead to more reliable and actionable data insights.
Continuous Improvement: Data-driven performance management fosters a culture of learning and continuous improvement.
Sustainable Growth: Empowered by data, organizations can make informed decisions to drive sustainable growth and innovation.
By focusing on these precise actions, organizations can create an empowered data analytics ecosystem that delivers real value by driving data-driven decisions and maximizing the return on their data investment.
Chatty Kathy - UNC Bootcamp Final Project Presentation - Final Version - 5.23...John Andrews
SlideShare Description for "Chatty Kathy - UNC Bootcamp Final Project Presentation"
Title: Chatty Kathy: Enhancing Physical Activity Among Older Adults
Description:
Discover how Chatty Kathy, an innovative project developed at the UNC Bootcamp, aims to tackle the challenge of low physical activity among older adults. Our AI-driven solution uses peer interaction to boost and sustain exercise levels, significantly improving health outcomes. This presentation covers our problem statement, the rationale behind Chatty Kathy, synthetic data and persona creation, model performance metrics, a visual demonstration of the project, and potential future developments. Join us for an insightful Q&A session to explore the potential of this groundbreaking project.
Project Team: Jay Requarth, Jana Avery, John Andrews, Dr. Dick Davis II, Nee Buntoum, Nam Yeongjin & Mat Nicholas
4. Deriving Knowledge from Data at Scale
Controlled Experiments in One Slide
Concept is Trivial
• Must run statistical tests to confirm differences are not due to chance
• Best scientific way to prove causality, i.e., the changes in metrics are
caused by changes introduced in the treatment(s)
9. Deriving Knowledge from Data at Scale
Imbalanced Class Distribution & Error Costs
WEKA cost sensitive learning
weighting method
false negatives, FN
try to avoid
false negatives
10. Deriving Knowledge from Data at Scale
Imbalanced Class Distribution
WEKA cost sensitive learning
Preprocess Classify
meta.CostSensitiveClassifier
set the FN to 10.0 FP to 1.0
tries to optimize accuracy or error can be cost-sensitive
decision trees rule learner
11. Deriving Knowledge from Data at Scale
Imbalanced Class Distribution
WEKA cost sensitive learning
13. Deriving Knowledge from Data at Scale
curated
completely specify a problem measure progress
paired with a metric target SLAs score
board
14. Deriving Knowledge from Data at Scale
This isn’t easy…
• Building high quality gold sets is a challenge.
• It is time consuming.
• It requires making difficult and long lasting
choices, and the rewards are delayed…
15. Deriving Knowledge from Data at Scale
enforce a few principles
1. Distribution parity
2. Testing blindness
3. Production parity
4. Single metric
5. Reproducibility
6. Experimentation velocity
7. Data is gold
16. Deriving Knowledge from Data at Scale
• Test set blindness
• Reproducibility and Data is gold
• Experimentation velocity
17. Deriving Knowledge from Data at Scale
Building Gold sets is hard work. Many common and avoidable mistakes are
made. This suggests having a checklist. Some questions will be trivial to
answer or not applicable, some will require work…
1. Metrics: For each gold set, chose one (1) metric. Having two metrics on the same
gold set is a problem (you can’t optimize both at once).
2. Weighting/Slicing: Not all errors are equal. This should be reflected in the metric, not
through sampling manipulation. Having the weighting in the metric has two
advantages: 1) it is explicitly documented and reproducible in the form of a metric
algorithm, and 2) production, train, and test sets results remain directly comparable
(automatic testing).
3. Yardstick(s): Define algorithms and configuration parameters for public yardstick(s).
There could be more than one yardstick. A simple yardstick is useful for ramping up.
Once one can reproduce/understand the simple yardstick’s result, it becomes easier
to improve on the latest “production” yardstick. Ideally yardsticks come with
downloadable code. The yardsticks provide a set of errors that suggests where
innovation should happen.
18. Deriving Knowledge from Data at Scale
4. Sizes and access: What are the set sizes? Each size corresponds to an innovation
velocity and a level of representativeness. A good rule of thumb is 5X size ratios
between gold sets drawn from the same distribution. Where should the data live? If
on a server, some services are needed for access and simple manipulations. There
should always be a size that is downloadable (< 1GB) to a desktop for high velocity
innovation.
5. Documentation and format: Create a format/API for the data. Is the data
compressed? Provide sample code to load the data. Document the format. Assign
someone to be the curator of the gold set.
19. Deriving Knowledge from Data at Scale
6. Features: What (gold) features go in the gold sets? Features must be pickled for result
to be reproducible. Ideally, we would have 2, and possibly 3 types of gold sets.
a. One set should have the deployed features (computed from the raw data). This provides the
production yardstick.
b. One set should be Raw (e.g. contains all information, possibly through tables). This allows
contributors to create features from the raw data to investigate its potential compared to existing
features. This set has more information per pattern and a smaller number of patterns.
c. One set should have an extended number of features. The additional features may be “building
blocks”, features that are scheduled to be deployed next, or high potential features. Moving some
features to a gold set is convenient if multiple people are working on the next generation. Not all
features are worth being in a gold set.
7. Feature optimization sets: Does the data require feature optimization? For instance,
an IP address, a query, or a listing id may be features. But only the most frequent 10M
instances are worth having specific trainable parameters. A pass over the data can
identify the top 10M instance. This is a form of feature optimization. Identifying these
features does not require labels. If a form of feature optimization is done, a separate
data set (disjoint from the training and test set) must be provided.
20. Deriving Knowledge from Data at Scale
8. Stale rate, optimization, monitoring: How long does the set stay current? In many
cases, we hide the fact that the problem is a time series even though the goal is to
predict the future and we know that the distribution is changing. We must quantify
how much a distribution changes over a fixed period of time. There are several ways
to mitigate the changing distribution problem:
a. Assume the distribution is I.I.D. Regularly re-compute training sets and Gold sets. Determine the
frequency of re-computation, or set in place a system to monitor distribution drifts (monitor KPI
changes while the algorithm is kept constant).
b. Decompose the model along “distribution (fast) tracking parameters” and slow tracking parameters.
The fast tracking model may be a simple calibration with very few parameters.
c. Recast the problem as a time series problem: patterns are (input data from t-T to t-1, prediction at
time t). In this space, the patterns are much larger, but the problem is closer to being I.I.D.
9. The gold sets should have information that reveal the stale rate and allows algorithms
to differentiate themselves based on how they degrade with time.
21. Deriving Knowledge from Data at Scale
10. Grouping: Should the patterns be grouped? For example in handwriting, examples are
grouped per writer. A set built by shuffling the words is misleading because training
and testing would have word examples for the same writer, which makes
generalization much easier. If the words are grouped per writers, then a writer is
unlikely to appear in both training and test set, which requires the system to generalize
to never seen before handwriting (as opposed to never seen before words). Do we
have these type of constraints? Should we group per advertisers, campaign, users to
generalize across new instances of these entities (as opposed to generalizing to new
queries)? ML requires training and testing to be drawn from the same distribution.
Drawing duplicates is not a problem. Problems arise when one partially draw
examples from the same entity on both training and testing on a small set of entities.
This breaks the IID assumption and makes the generalization on the test set much
easier than it actually is.
11. Sampling production data: What strategy is used for sampling? Uniform? Are any of
the following filtered out: fraud, bad configurations, duplicates, non-billable, adult,
overwrites, etc? Guidance: use the production sameness principle.
22. Deriving Knowledge from Data at Scale
11. Unlabeled set: If the number of labeled examples is small, a large data set of
unlabeled data with the same distribution should be collected and be made a gold
set. This enables the discovery of new features using intermediate classifiers and
active labeling.
24. Deriving Knowledge from Data at Scale
gender age smoker eye
color
male 19 yes green
female 44 yes gray
male 49 yes blue
male 12 no brown
female 37 no brown
female 60 no brown
male 44 no blue
female 27 yes brown
female 51 yes green
female 81 yes gray
male 22 yes brown
male 29 no blue
lung
cancer
no
yes
yes
no
no
yes
no
no
yes
no
no
no
male 77 yes gray
male 19 yes green
female 44 no gray
yes
no
no
Train
ML Model
25. Deriving Knowledge from Data at Scale
The greatest challenge in Machine Learning?
Lack of Labelled Training Data…
What to Do?
• Controlled Experiments – get feedback from user to serve as labels;
• Mechanical Turk – pay people to label data to build training set;
• Ask Users to Label Data – report as spam, ‘hot or not?’, review a product,
observe their click behavior (ad retargeting, search results, etc).
27. Deriving Knowledge from Data at Scale
Semi-SupervisedLearning
Can we makeuse of the unlabeled data?
In theory: no
... but we can make assumptions
PopularAssumptions
• Clustering assumption
• Low density assumption
• Manifold assumption
28. Deriving Knowledge from Data at Scale
TheClusteringAssumption
Clustering
• Partition instances into groups (clusters) of similar
instances
• Many different algorithms: k-Means, EM, etc.
Clustering Assumption
• The two classification targets are distinct clusters
• Simple semi-supervised learning: cluster, then
perform majority vote
29. Deriving Knowledge from Data at Scale
TheClusteringAssumption
Clustering
• Partition instances into groups (clusters) of similar
instances
• Many different algorithms: k-Means, EM, etc.
Clustering Assumption
• The two classification targets are distinct clusters
• Simple semi-supervised learning: cluster, then
perform majority vote
30. Deriving Knowledge from Data at Scale
TheClusteringAssumption
Clustering
• Partition instances into groups (clusters) of similar
instances
• Many different algorithms: k-Means, EM, etc.
Clustering Assumption
• The two classification targets are distinct clusters
• Simple semi-supervised learning: cluster, then
perform majority vote
31. Deriving Knowledge from Data at Scale
TheClusteringAssumption
Clustering
• Partition instances into groups (clusters) of similar
instances
• Many different algorithms: k-Means, EM, etc.
Clustering Assumption
• The two classification targets are distinct clusters
• Simple semi-supervised learning: cluster, then
perform majority vote
32. Deriving Knowledge from Data at Scale
Generative Models
Mixture of Gaussians
• Assumption: the data in each cluster is generated
by a normal distribution
• Find most probable location and shape of clusters
given data
Expectation-Maximization
• Two step optimization procedure
• Keeps estimates of cluster assignment probabilities
for each instance
• Might converge to local optimum
33. Deriving Knowledge from Data at Scale
GenerativeModels
Mixture of Gaussians
• Assumption: the data in each cluster is generated
by a normal distribution
• Find most probable location and shape of clusters
given data
Expectation-Maximization
• Two step optimization procedure
• Keeps estimates of cluster assignment probabilities
for each instance
• Might converge to local optimum
34. Deriving Knowledge from Data at Scale
GenerativeModels
Mixture of Gaussians
• Assumption: the data in each cluster is generated
by a normal distribution
• Find most probable location and shape of clusters
given data
Expectation-Maximization
• Two step optimization procedure
• Keeps estimates of cluster assignment probabilities
for each instance
• Might converge to local optimum
35. Deriving Knowledge from Data at Scale
Generative Models
Mixture of Gaussians
• Assumption: the data in each cluster is generated
by a normal distribution
• Find most probable location and shape of clusters
given data
Expectation-Maximization
• Two step optimization procedure
• Keeps estimates of cluster assignment probabilities
for each instance
• Might converge to local optimum
36. Deriving Knowledge from Data at Scale
Generative Models
Mixture of Gaussians
• Assumption: the data in each cluster is generated
by a normal distribution
• Find most probable location and shape of clusters
given data
Expectation-Maximization
• Two step optimization procedure
• Keeps estimates of cluster assignment probabilities
for each instance
• Might converge to local optimum
37. Deriving Knowledge from Data at Scale
Generative Models
Mixture of Gaussians
• Assumption: the data in each cluster is generated
by a normal distribution
• Find most probable location and shape of clusters
given data
Expectation-Maximization
• Two step optimization procedure
• Keeps estimates of cluster assignment probabilities
for each instance
• Might converge to local optimum
38. Deriving Knowledge from Data at Scale
BeyondMixtures of Gaussians
Expectation-Maximization
• Can be adjusted to all kinds of mixture models
• E.g. use Naive Bayes as mixture model for text classification
Self-Training
• Learn model on labeled instances only
• Apply model to unlabeled instances
• Learn new model on all instances
• Repeat until convergence
39. Deriving Knowledge from Data at Scale
TheLow DensityAssumption
Assumption
• The area between the two classes has low density
• Does not assume any specific form of cluster
Support Vector Machine
• Decision boundary is linear
• Maximizes margin to closest instances
40. Deriving Knowledge from Data at Scale
TheLow DensityAssumption
Assumption
• The area between the two classes has low density
• Does not assume any specific form of cluster
Support Vector Machine
• Decision boundary is linear
• Maximizes margin to closest instances
41. Deriving Knowledge from Data at Scale
TheLow DensityAssumption
Assumption
• The area between the two classes has low density
• Does not assume any specific form of cluster
Support Vector Machine
• Decision boundary is linear
• Maximizes margin to closest instances
42. Deriving Knowledge from Data at Scale
TheLow DensityAssumption
Semi-Supervised SVM
• Minimize distance to labeled and
unlabeled instances
• Parameter to fine-tune influence of
unlabeled instances
• Additional constraint: keep class balance correct
Implementation
• Simple extension of SVM
• But non-convex optimization problem
43. Deriving Knowledge from Data at Scale
TheLow DensityAssumption
Semi-Supervised SVM
• Minimize distance to labeled and
unlabeled instances
• Parameter to fine-tune influence of
unlabeled instances
• Additional constraint: keep class balance correct
Implementation
• Simple extension of SVM
• But non-convex optimization problem
44. Deriving Knowledge from Data at Scale
TheLow DensityAssumption
Semi-Supervised SVM
• Minimize distance to labeled and
unlabeled instances
• Parameter to fine-tune influence of
unlabeled instances
• Additional constraint: keep class balance correct
Implementation
• Simple extension of SVM
• But non-convex optimization problem
45. Deriving Knowledge from Data at Scale
Semi-Supervised SVM
Stochastic Gradient Descent
• One run over the data in random order
• Each misclassified or unlabeled instance moves
classifier a bit
• Steps get smaller over time
Implementation on Hadoop
• Mapper: send data to reducer in random order
• Reducer: update linear classifier for unlabeled
or misclassified instances
• Many random runs to find best one
46. Deriving Knowledge from Data at Scale
Semi-Supervised SVM
Stochastic Gradient Descent
• One run over the data in random order
• Each misclassified or unlabeled instance moves
classifier a bit
• Steps get smaller over time
Implementation on Hadoop
• Mapper: send data to reducer in random order
• Reducer: update linear classifier for unlabeled
or misclassified instances
• Many random runs to find best one
47. Deriving Knowledge from Data at Scale
Semi-Supervised SVM
Stochastic Gradient Descent
• One run over the data in random order
• Each misclassified or unlabeled instance moves
classifier a bit
• Steps get smaller over time
Implementation on Hadoop
• Mapper: send data to reducer in random order
• Reducer: update linear classifier for unlabeled
or misclassified instances
• Many random runs to find best one
48. Deriving Knowledge from Data at Scale
Semi-Supervised SVM
Stochastic Gradient Descent
• One run over the data in random order
• Each misclassified or unlabeled instance moves
classifier a bit
• Steps get smaller over time
Implementation on Hadoop
• Mapper: send data to reducer in random order
• Reducer: update linear classifier for unlabeled
or misclassified instances
• Many random runs to find best one
49. Deriving Knowledge from Data at Scale
Semi-Supervised SVM
Stochastic Gradient Descent
• One run over the data in random order
• Each misclassified or unlabeled instance moves
classifier a bit
• Steps get smaller over time
Implementation on Hadoop
• Mapper: send data to reducer in random order
• Reducer: update linear classifier for unlabeled
or misclassified instances
• Many random runs to find best one
50. Deriving Knowledge from Data at Scale
TheManifoldAssumption
The Assumption
• Training data is (roughly) contained in a low
dimensional manifold
• One can perform learning in a more meaningful
low-dimensional space
• Avoids curse of dimensionality
Similarity Graphs
• Idea: compute similarity scores between instances
• Create network where the nearest
neighbors are connected
51. Deriving Knowledge from Data at Scale
TheManifoldAssumption
The Assumption
• Training data is (roughly) contained in a low
dimensional manifold
• One can perform learning in a more meaningful
low-dimensional space
• Avoids curse of dimensionality
Similarity Graphs
• Idea: compute similarity scores between instances
• Create a network where the nearest neighbors are
connected
52. Deriving Knowledge from Data at Scale
TheManifoldAssumption
The Assumption
• Training data is (roughly) contained in a low
dimensional manifold
• One can perform learning in a more
meaningful low-dimensional space
• Avoids curse of dimensionality
SimilarityGraphs
• Idea: compute similarity scores between instances
•
Create network where the nearest neighbors
are connected
53. Deriving Knowledge from Data at Scale
Label Propagation
MainIdea
• Propagate label information to neighboring instances
• Then repeat until convergence
• Similar to PageRank
Theory
• Known to converge under weak conditions
• Equivalent to matrix inversion
54. Deriving Knowledge from Data at Scale
Label Propagation
MainIdea
• Propagate label information to neighboring instances
• Then repeat until convergence
• Similar to PageRank
Theory
• Known to converge under weak conditions
• Equivalent to matrix inversion
55. Deriving Knowledge from Data at Scale
Label Propagation
MainIdea
• Propagate label information to neighboring instances
• Then repeat until convergence
• Similar to PageRank
Theory
• Known to converge under weak conditions
• Equivalent to matrix inversion
56. Deriving Knowledge from Data at Scale
Label Propagation
MainIdea
• Propagate label information to neighboring instances
• Then repeat until convergence
• Similar to PageRank
Theory
• Known to converge under weak conditions
• Equivalent to matrix inversion
57. Deriving Knowledge from Data at Scale
Conclusion
Semi-Supervised Learning
• Only few training instances have labels
• Unlabeled instances can still provide valuable signal
Different assumptions lead to different approaches
• Cluster assumption: generative models
• Low density assumption: semi-supervised support vector machines
• Manifold assumption: label propagation
68. Deriving Knowledge from Data at Scale
• HiPPO stop the project
From Greg Linden’s Blog: http://glinden.blogspot.com/2006/04/early-amazon-shopping-cart.html
70. Deriving Knowledge from Data at Scale
• Must run statistical tests to confirm differences are not due to chance
• Best scientific way to prove causality, i.e., the changes in metrics are
caused by changes introduced in the treatment(s)
72. Deriving Knowledge from Data at Scale
• Raise your right hand if you think A Wins
• Raise your left hand if you think B Wins
• Don’t raise your hand if you think they’re about the same
A B
74. Deriving Knowledge from Data at Scale
A
B
Differences: A has taller search box (overall size is the same), has magnifying glass icon,
“popular searches”
B has big search button
• Raise your right hand if you think A Wins
• Raise your left hand if you think B Wins
• Don’t raise your hand if they are the about the same
77. Deriving Knowledge from Data at Scale
A B
• Raise your right hand if you think A Wins
• Raise your left hand if you think B Wins
• Don’t raise your hand if they are the about the same
79. Deriving Knowledge from Data at Scale
Any statistic that appears interesting is almost certainly a mistake
If something is “amazing,” find the flaw!
Examples
If you have a mandatory birth date field and people think it’s
unnecessary, you’ll find lots of 11/11/11 or 01/01/01
If you have an optional drop down, do not default to the first
alphabetical entry, or you’ll have lots jobs = Astronaut
The previous Office example assumes click maps to revenue.
Seemed reasonable, but when the results look so extreme, find
the flaw (conversion rate is not the same; see why?)
83. Deriving Knowledge from Data at Scale
• Controlled Experiments in one slide
• Examples: you’re the decision maker
84. Deriving Knowledge from Data at Scale
It is difficult to get a man to understand something when his
salary depends upon his not understanding it.
-- Upton Sinclair
86. Deriving Knowledge from Data at Scale
Cultural Stage 2
Insight through Measurement and Control
• Semmelweis worked at Vienna’s General Hospital, an
important teaching/research hospital, in the 1830s-40s
• In 19th-century Europe, childbed fever killed more than a million
women
• Measurement: the mortality rate for women giving birth was
• 15% in his ward, staffed by doctors and students
• 2% in the ward at the hospital, attended by midwives
87. Deriving Knowledge from Data at Scale
Cultural Stage 2
Insight through Measurement and Control
• He tried to control all differences
• Birthing positions, ventilation, diet, even the way laundry was done
• He was away for 4 months and death rate fell significantly when
he was away. Could it be related to him?
• Insight:
• Doctors were performing autopsies each morning on cadavers
• Conjecture: particles (called germs today) were being transmitted to
healthy patients on the hands of the physicians
• He experiments with cleansing agents
• Chlorine and lime was effective: death rate fell from 18% to 1%
88. Deriving Knowledge from Data at Scale
Semmelweis Reflex
• Semmelweis Reflex
2005 study: inadequate hand washing is one of the
prime contributors to the 2 million health-care-associated infections and
90,000 related deaths annually in the United States
90. Deriving Knowledge from Data at Scale
Hubris
Measure and
Control
Accept Results
avoid
Semmelweis
Reflex
Fundamental
Understanding
91. Deriving Knowledge from Data at Scale
• Controlled Experiments in one slide
• Examples: you’re the decision maker
• Cultural evolution: hubris, insight through measurement,
Semmelweis reflex, fundamental understanding
93. Deriving Knowledge from Data at Scale
• Real Data for the city of Oldenburg,
Germany
• X-axis: stork population
• Y-axis: human population
What your mother told you about babies and
storks when you were three is still not right,
despite the strong correlational “evidence”
Ornitholigische Monatsberichte 1936;44(2)
94. Deriving Knowledge from Data at Scale
Women have smaller palms and live 6 years longer
on average
But…don’t try to bandage your hands
101. Deriving Knowledge from Data at Scale
• Hippos kill more humans than any other (non-human) mammal (really)
• OEC
Get the data
• Prepare to be humbled
The less data, the stronger the opinions…
102. Deriving Knowledge from Data at Scale
Out of Class Reading
Eight (8) page conference paper
40 page journal version…
111. Deriving Knowledge from Data at Scale
Experiment
Tools that you can use in your
experiment. For feature
selection, large set of machine
learning algorithms
113. Deriving Knowledge from Data at Scale
Using
classificatio
n
algorithms
Evaluating
the model
Splitting to
Training
and Testing
Datasets
Getting
Data
For the
Experiment
114. Deriving Knowledge from Data at Scale
http://gallery.azureml.net/browse/?tags=[%22Azure%20ML%20Book%22
118. Deriving Knowledge from Data at Scale
Define
Objective
Access and
Understand the
Data
Pre-processing
Feature and/or
Target
construction
1. Define the objective and quantify it with a metric – optionally with constraints,
if any. This typically requires domain knowledge.
2. Collect and understand the data, deal with the vagaries and biases in the data
acquisition (missing data, outliers due to errors in the data collection process,
more sophisticated biases due to the data collection procedure etc
3. Frame the problem in terms of a machine learning problem – classification,
regression, ranking, clustering, forecasting, outlier detection etc. – some
combination of domain knowledge and ML knowledge is useful.
4. Transform the raw data into a “modeling dataset”, with features, weights,
targets etc., which can be used for modeling. Feature construction can often
be improved with domain knowledge. Target must be identical (or a very
good proxy) of the quantitative metric identified step 1.
119. Deriving Knowledge from Data at Scale
Feature selection
Model training
Model scoring
Evaluation
Train/ Test split
5. Train, test and evaluate, taking care to control
bias/variance and ensure the metrics are
reported with the right confidence intervals
(cross-validation helps here), be vigilant
against target leaks (which typically leads to
unbelievably good test metrics) – this is the
ML heavy step.
120. Deriving Knowledge from Data at Scale
Define
Objective
Access and
Understand
the data
Pre-processing
Feature and/or
Target
construction
Feature selection
Model training
Model scoring
Evaluation
Train/ Test split
6. Iterate steps (2) – (5) until the test metrics are satisfactory
121. Deriving Knowledge from Data at Scale
Access Data
Pre-processing
Feature
construction
Model scoring