Downloaded 220 times
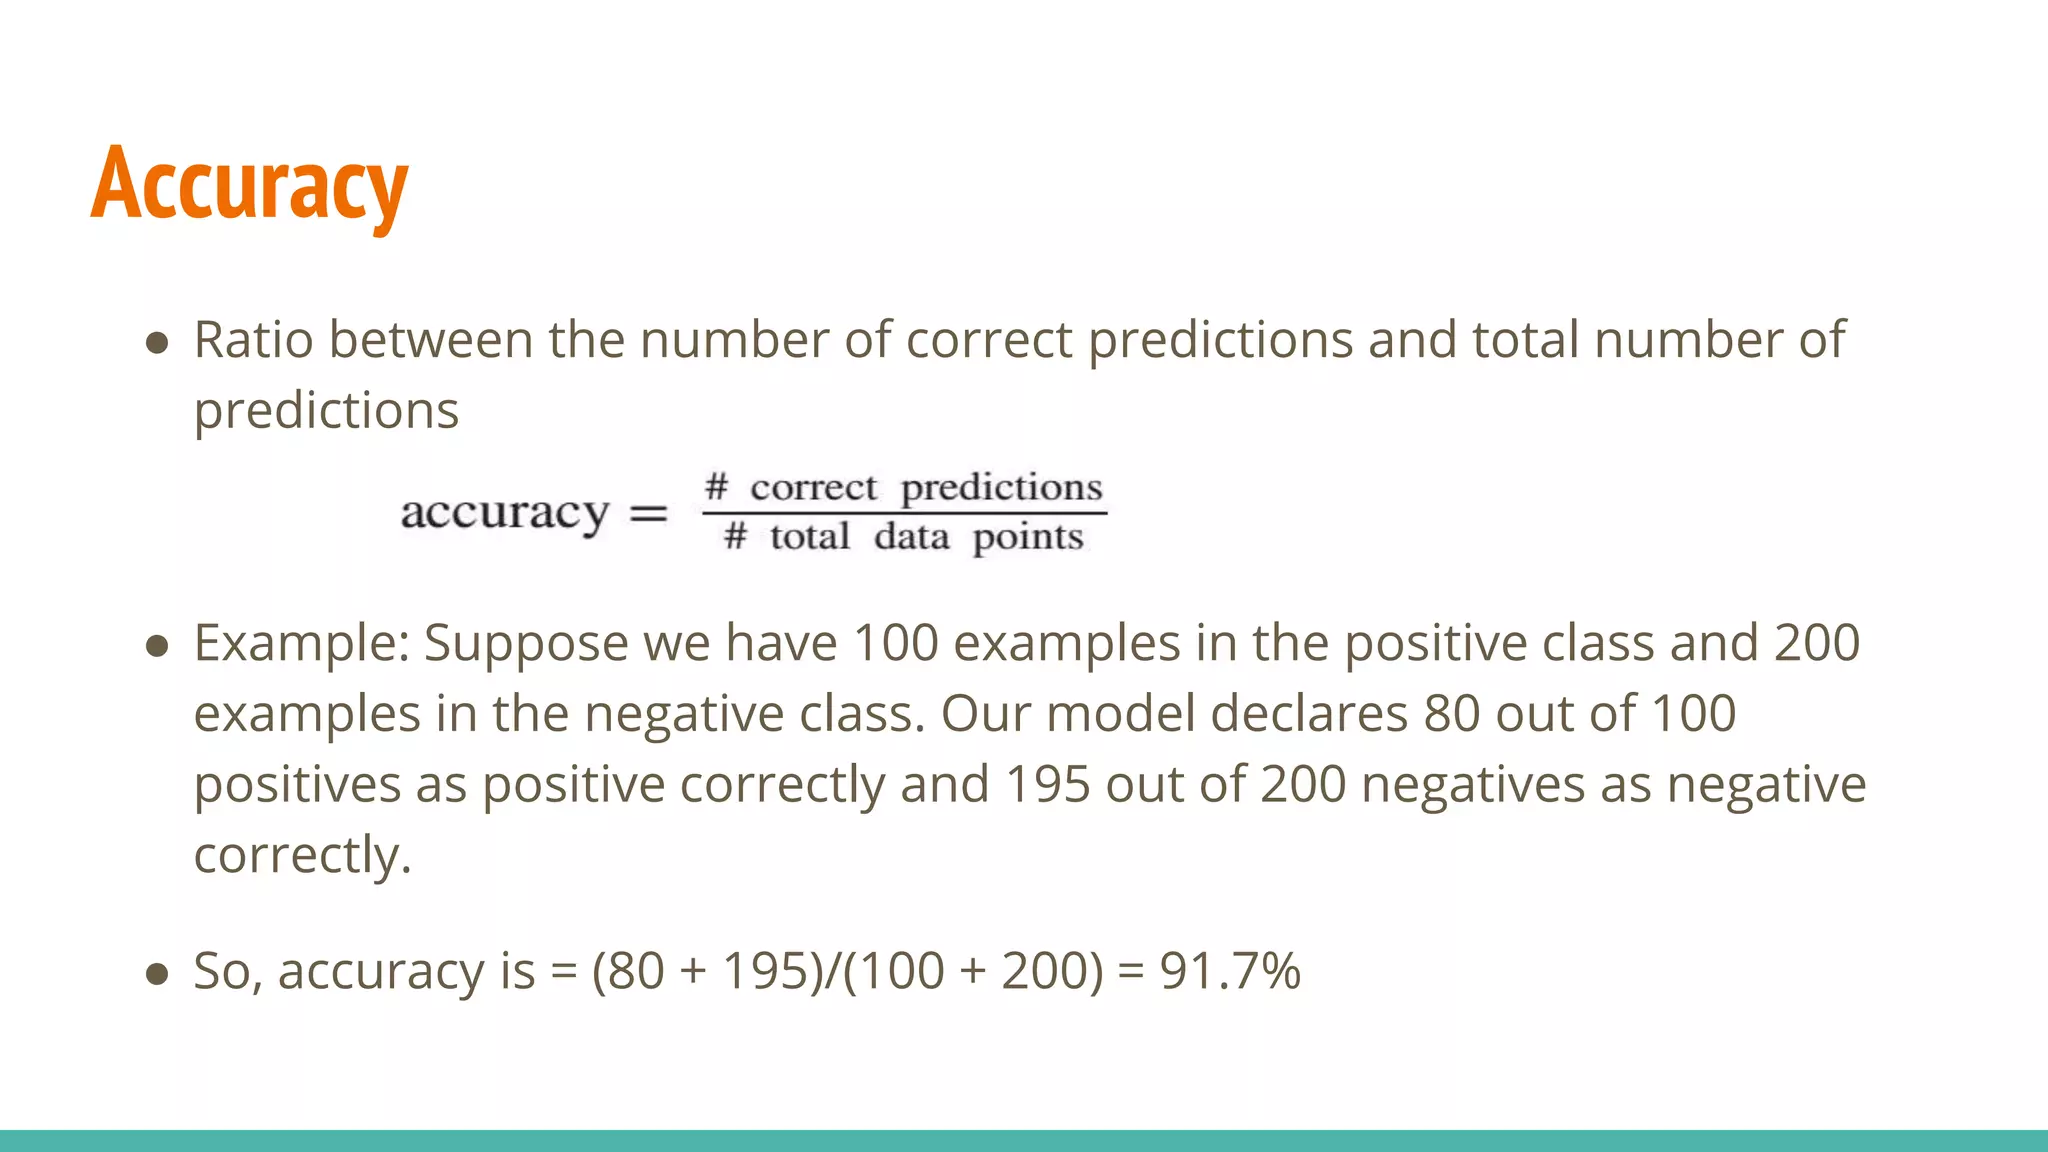
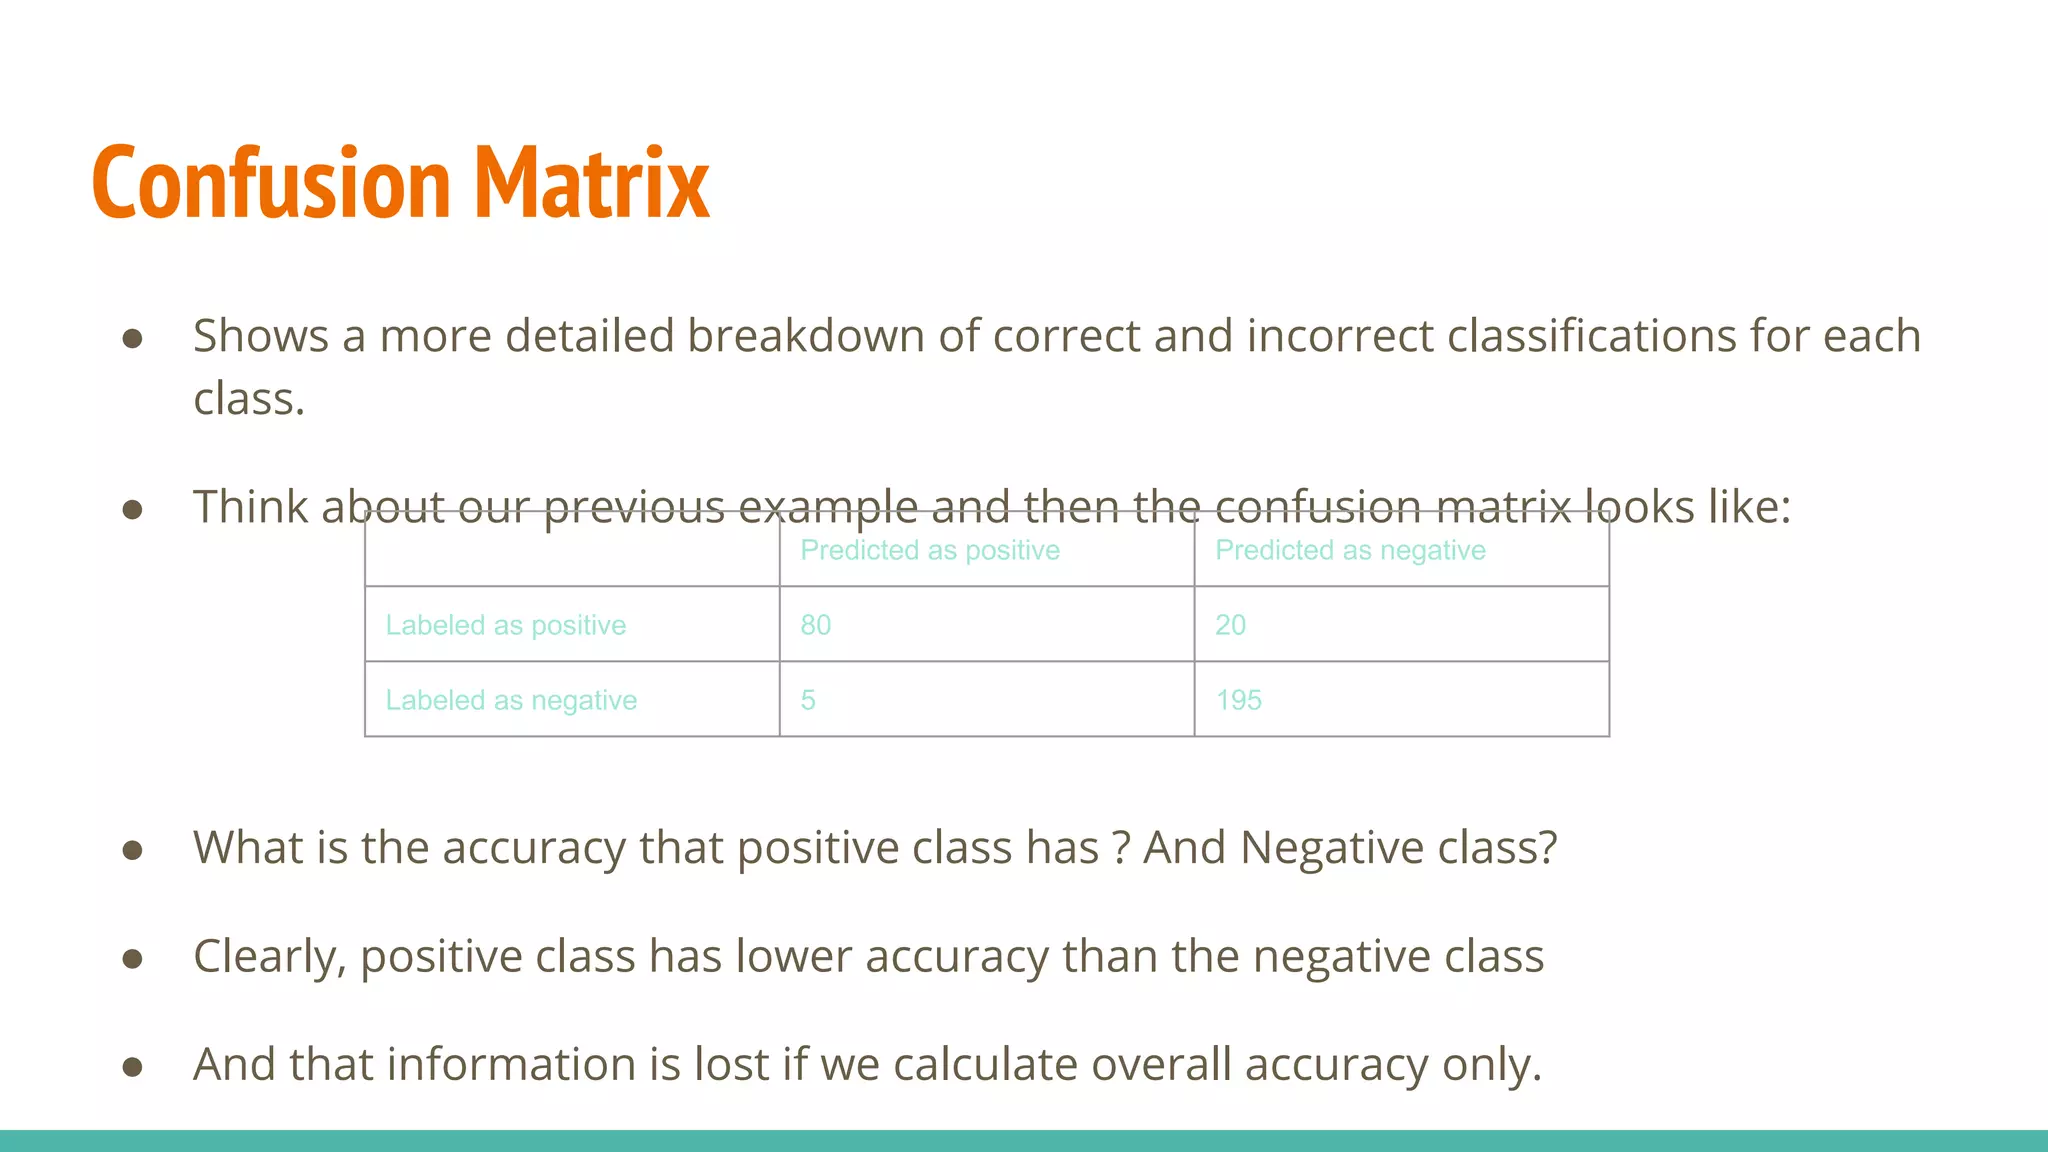
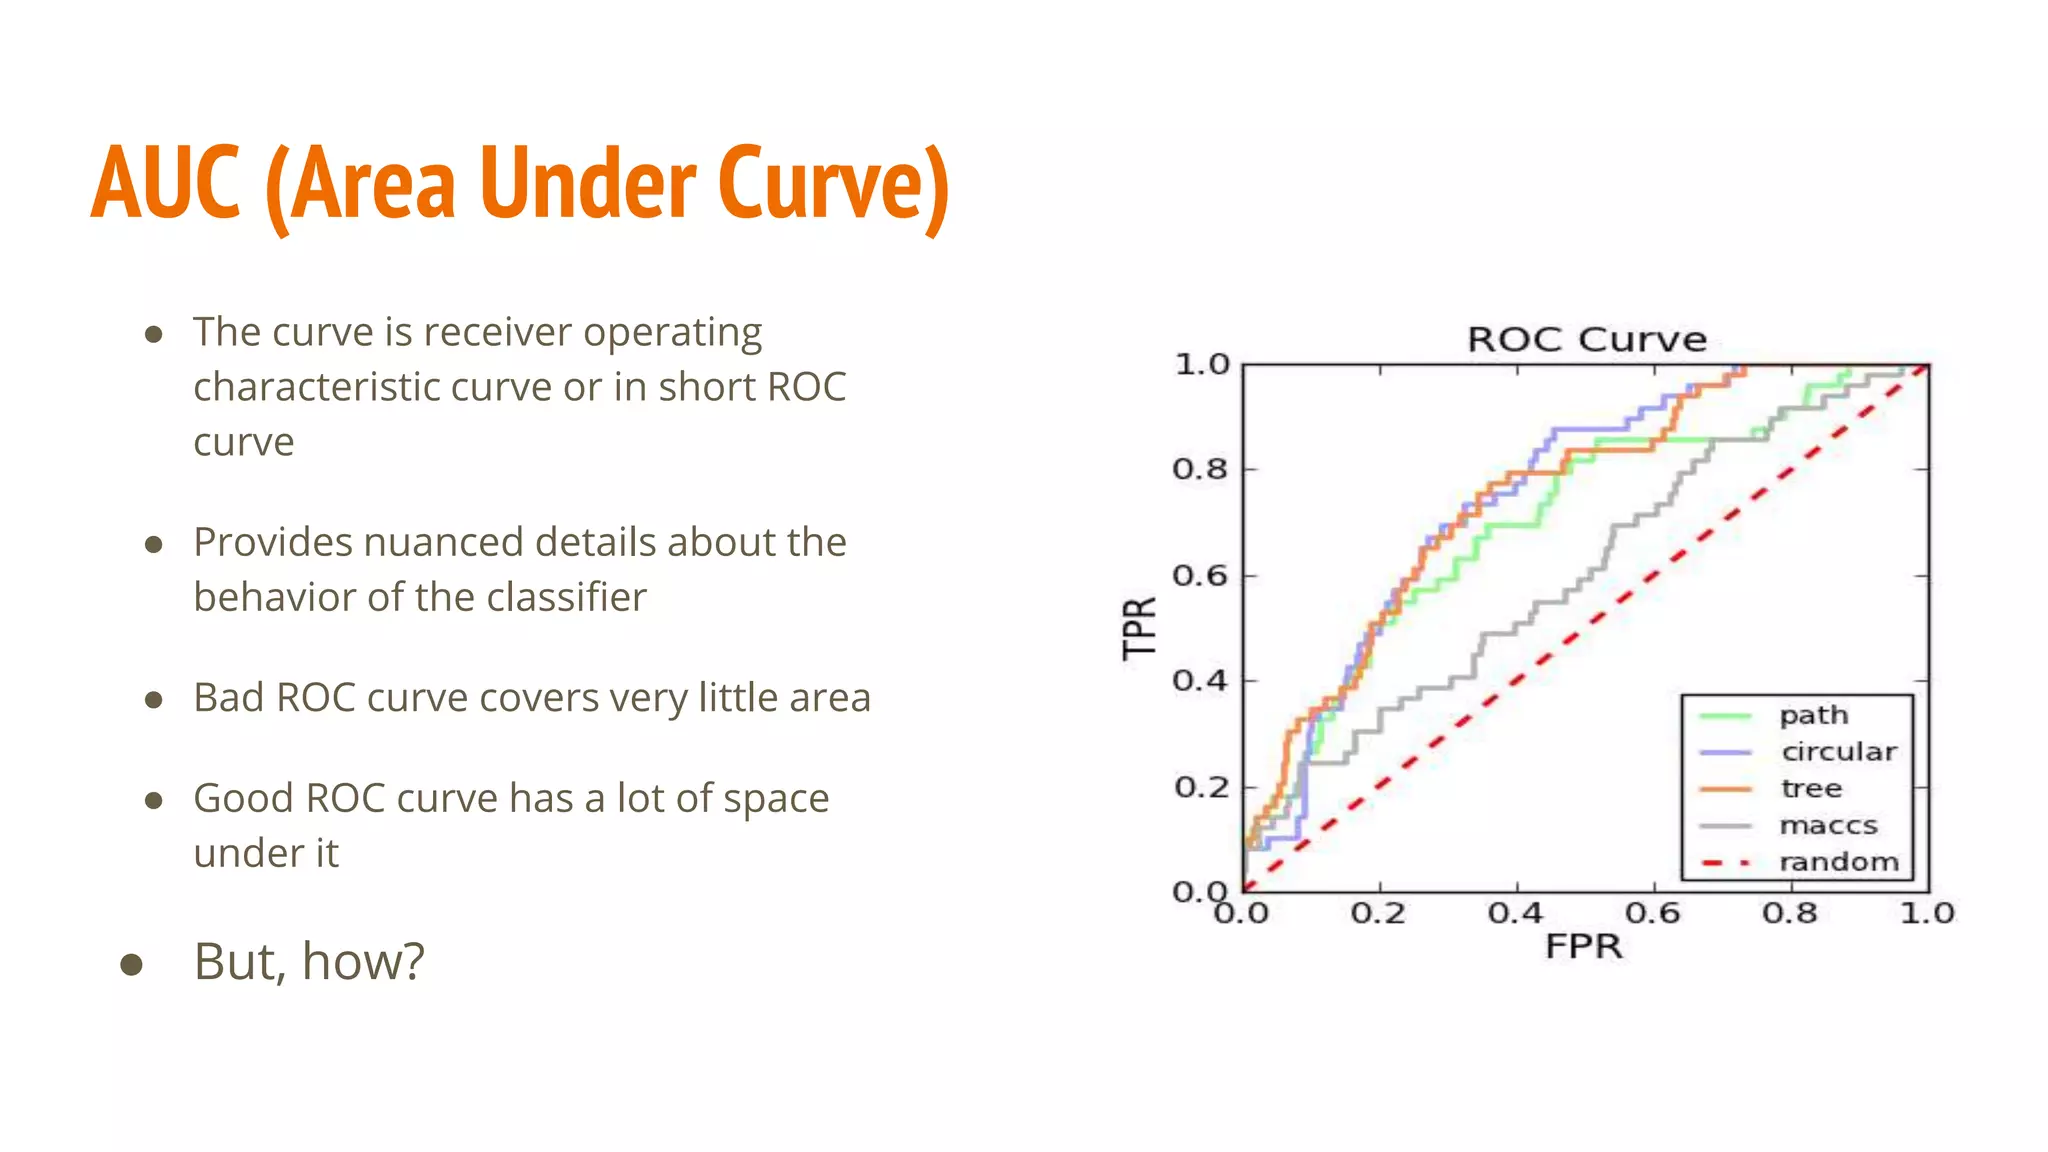
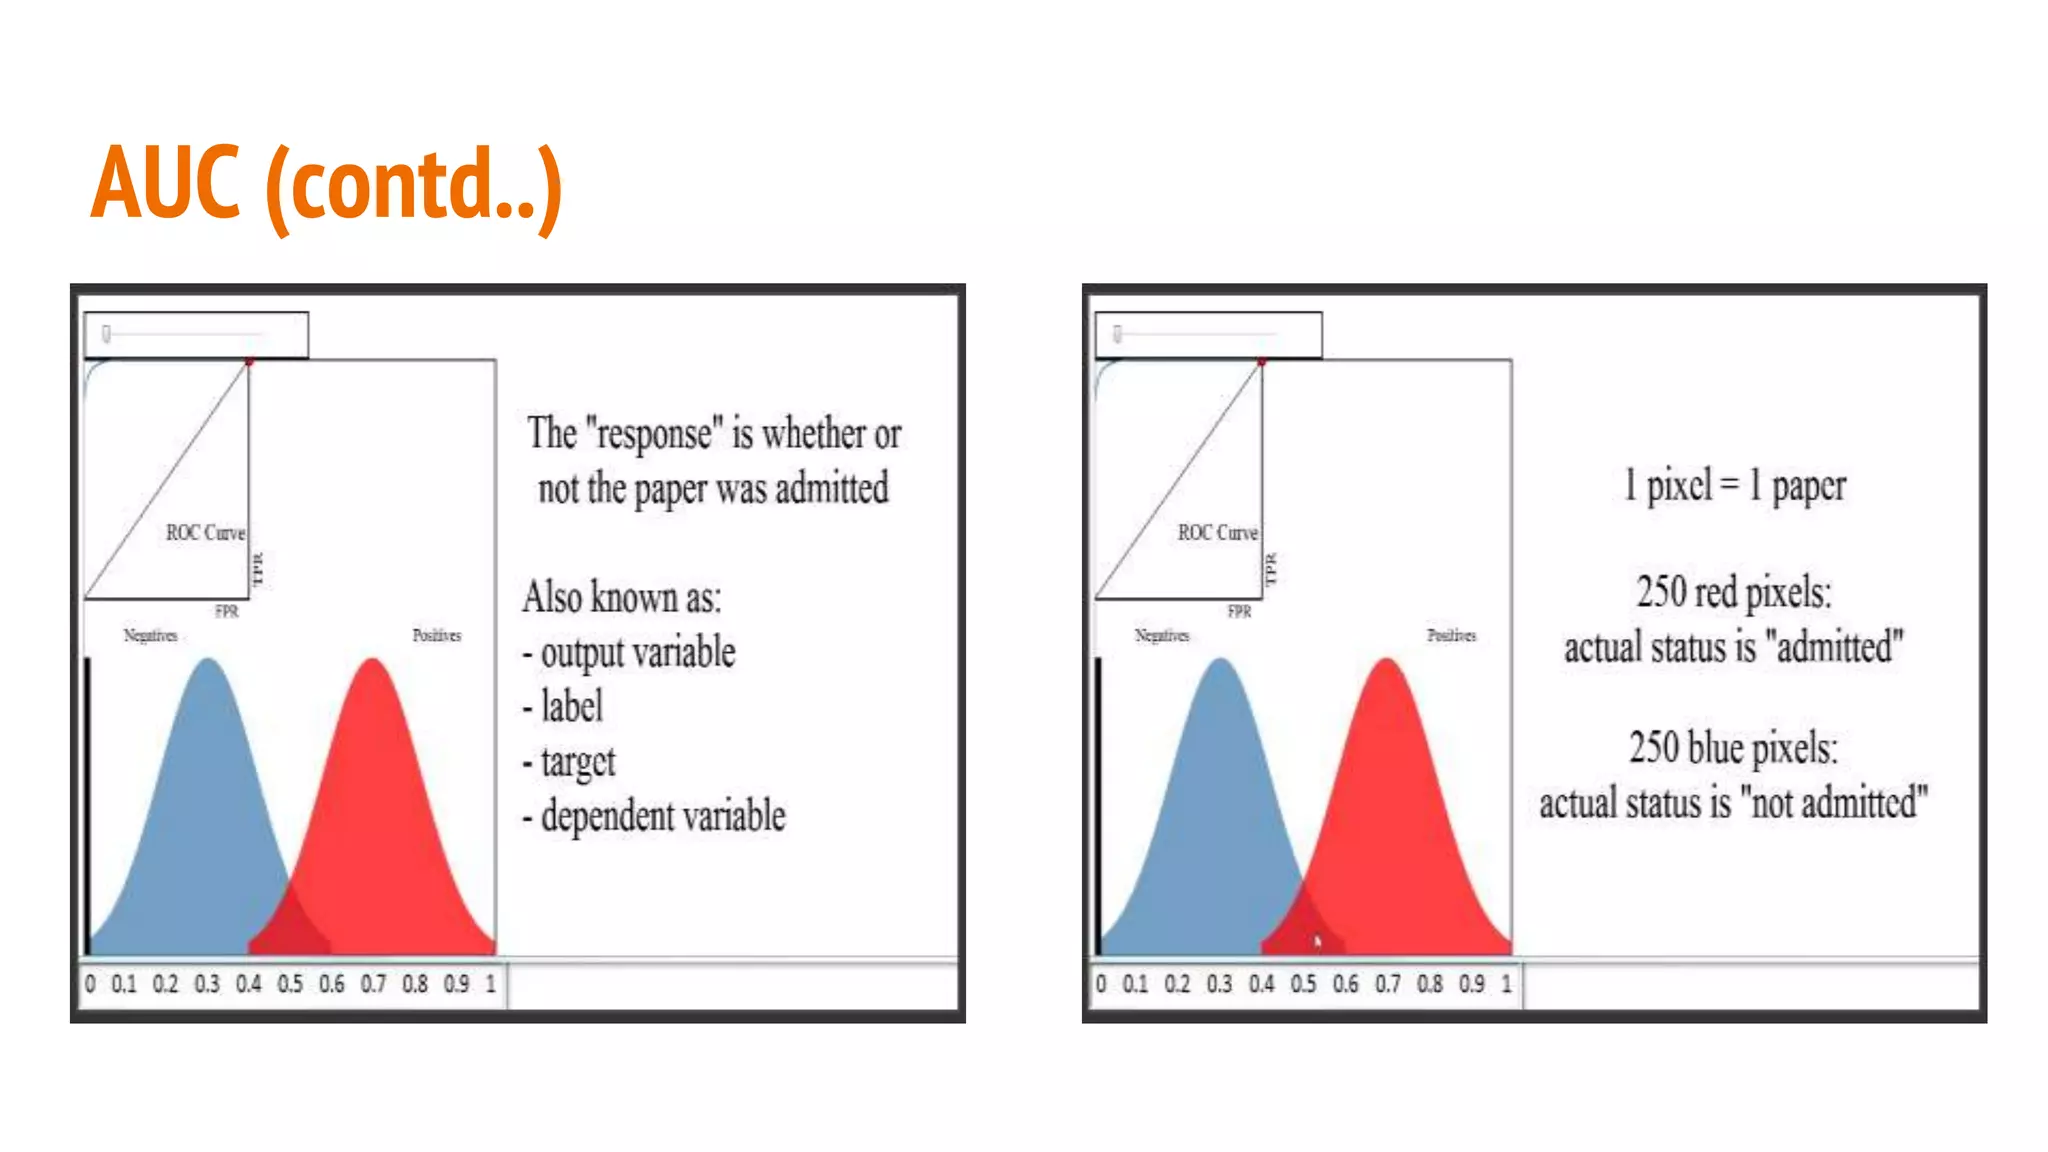
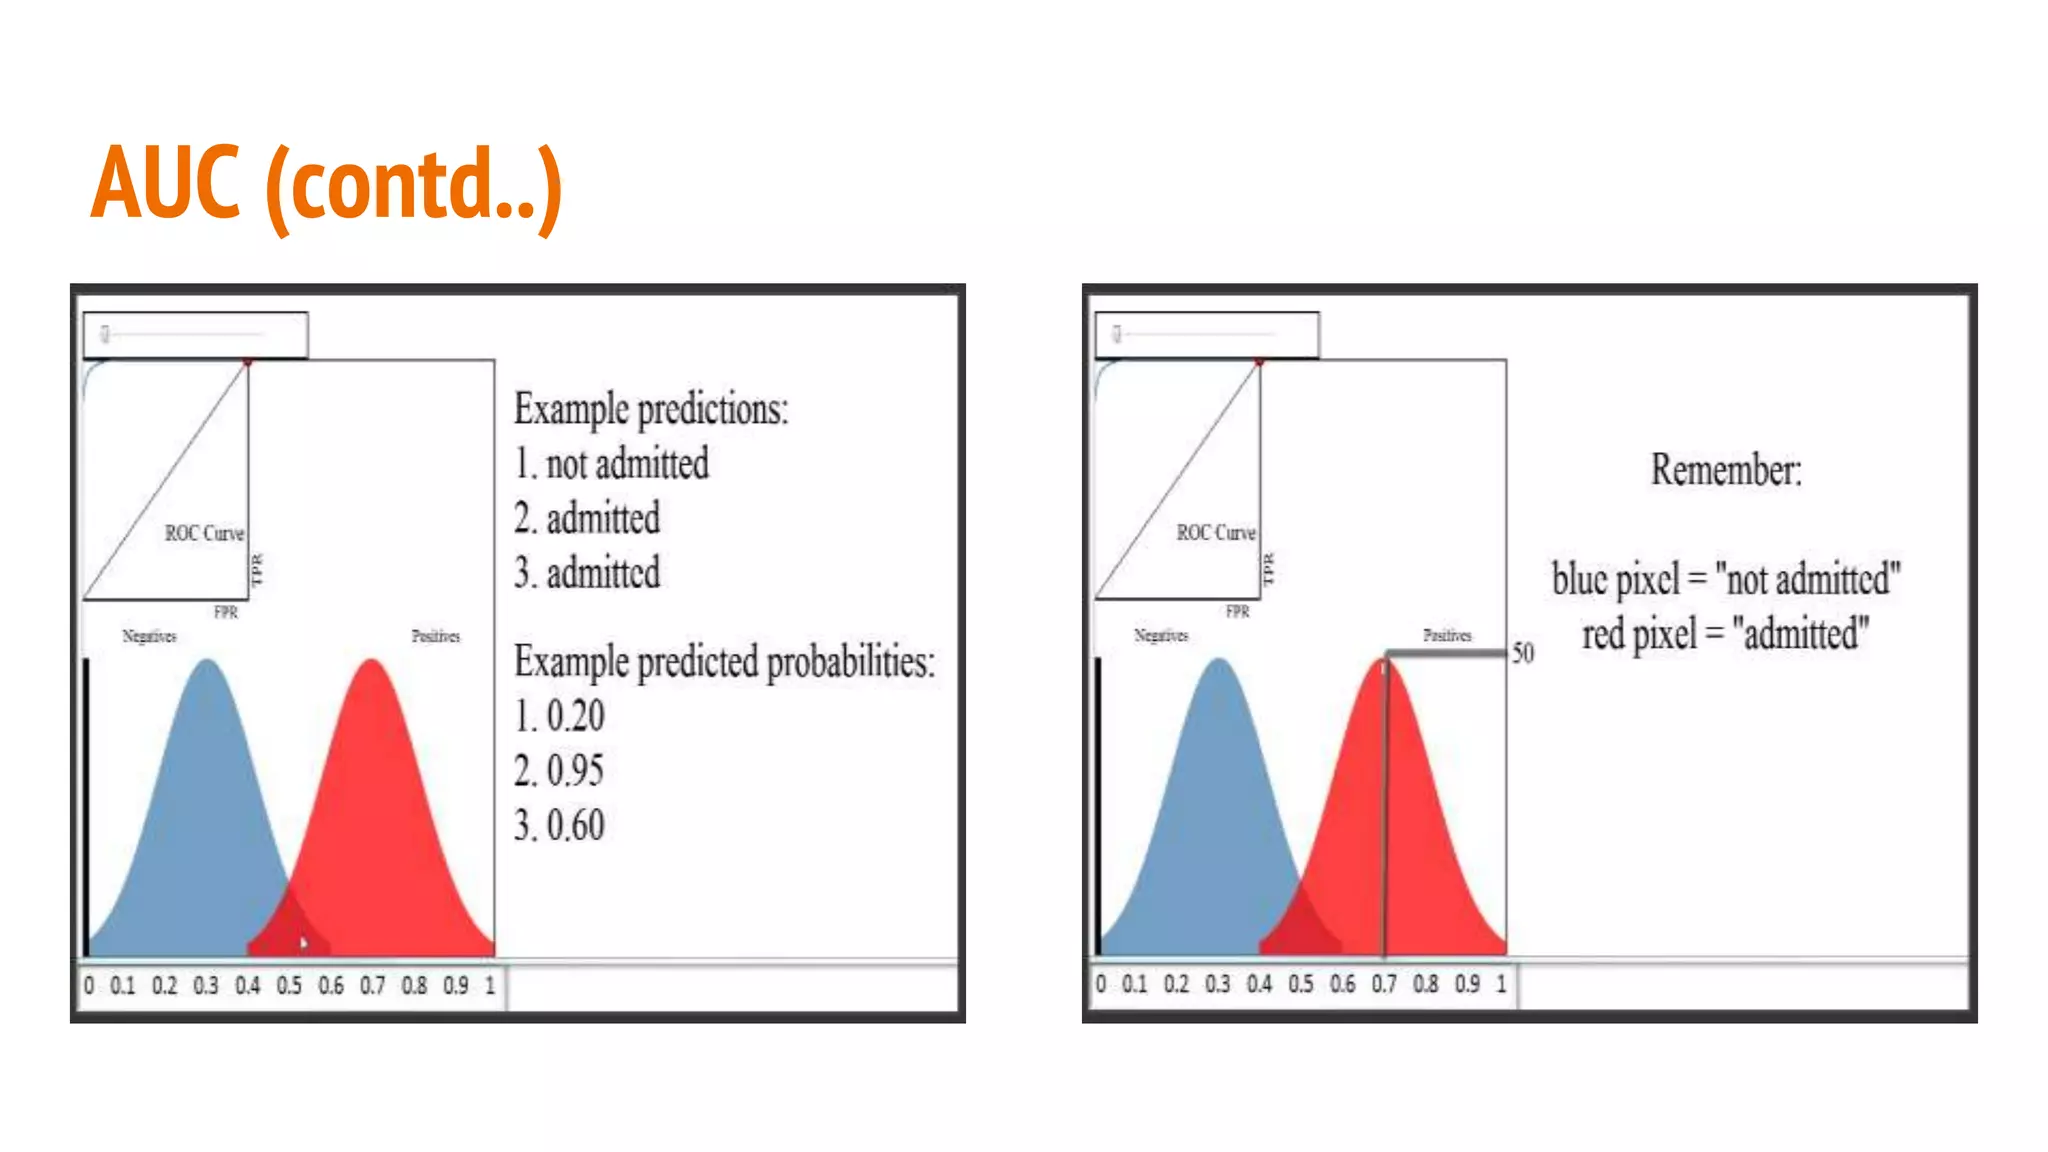
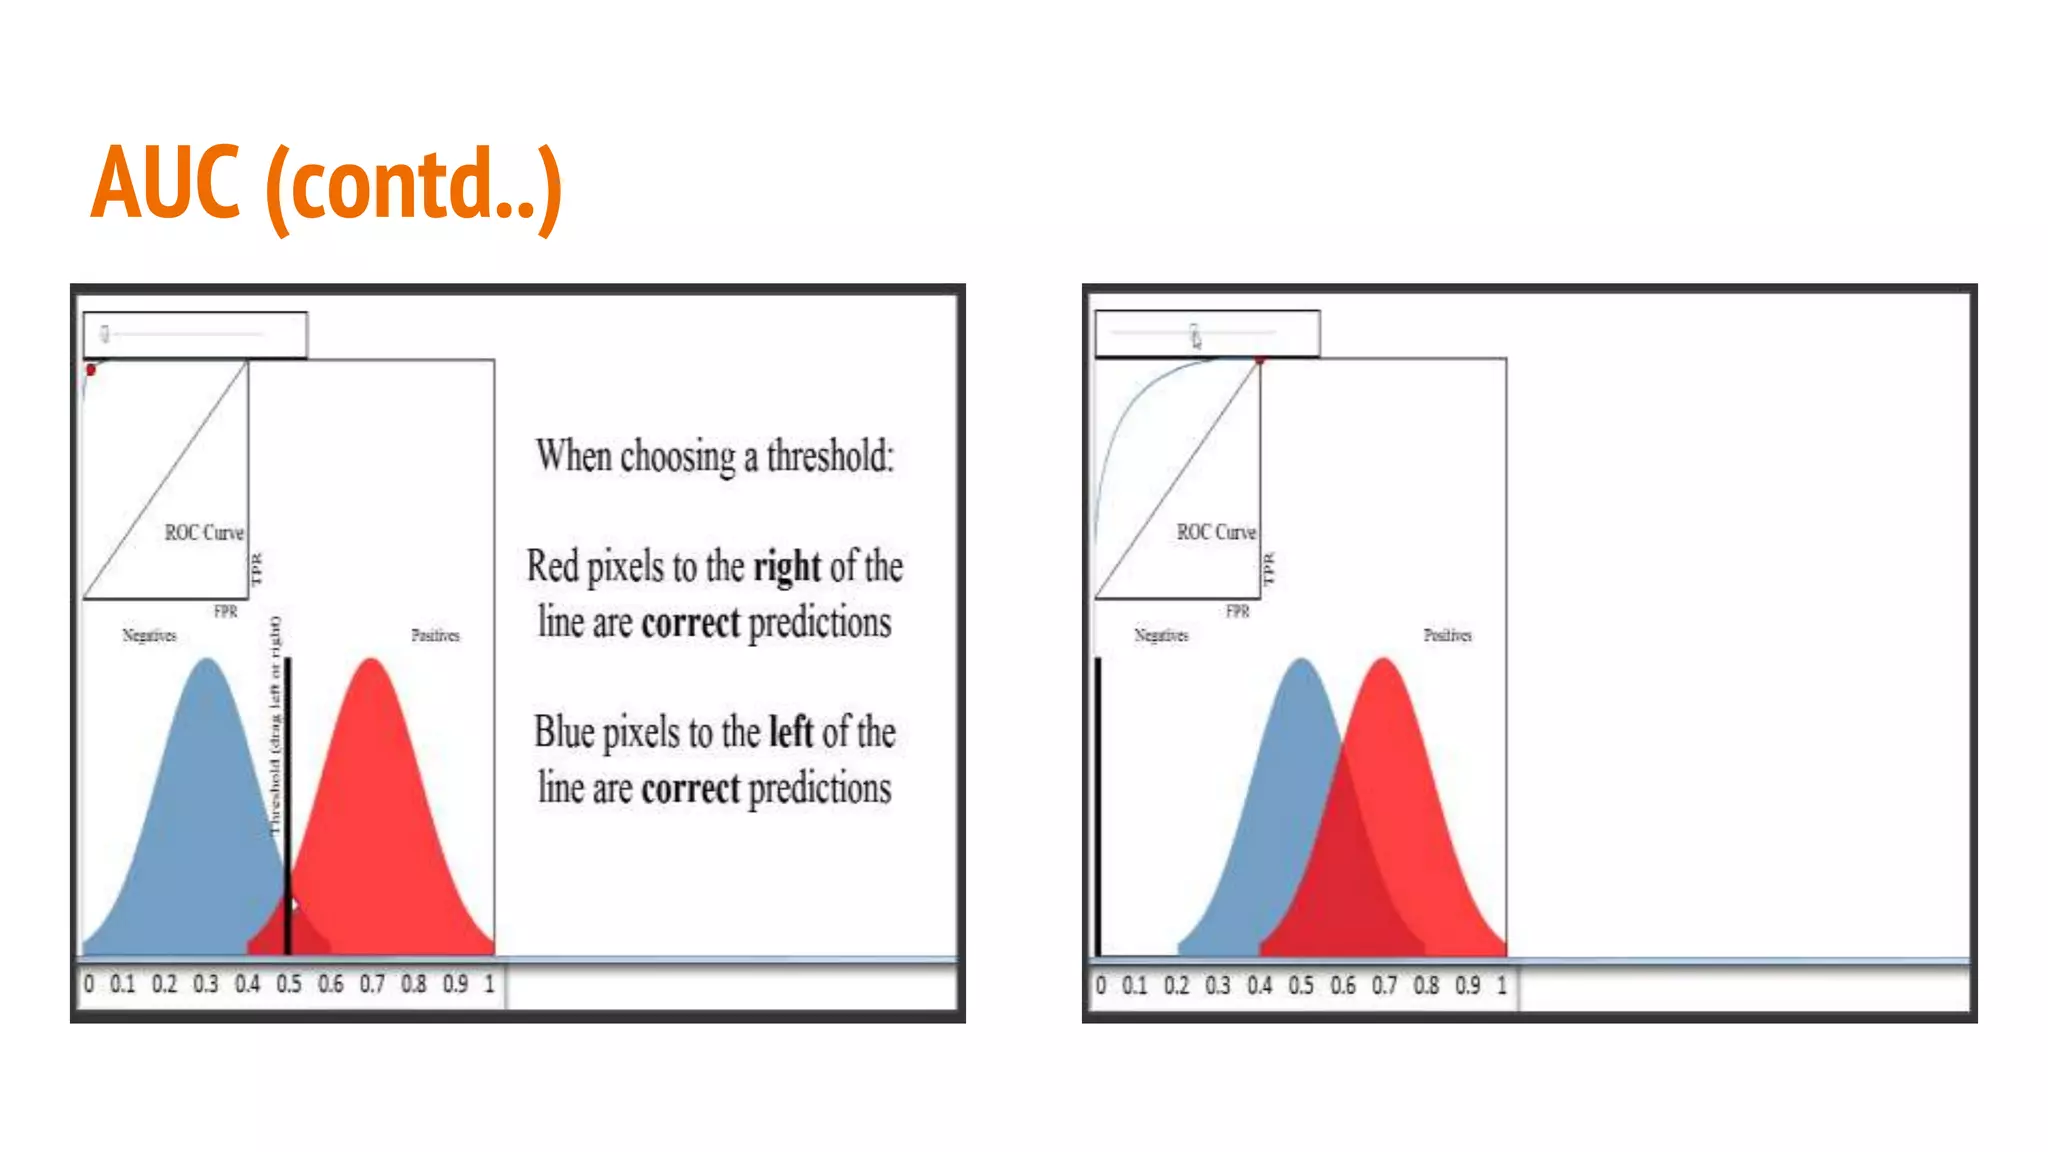
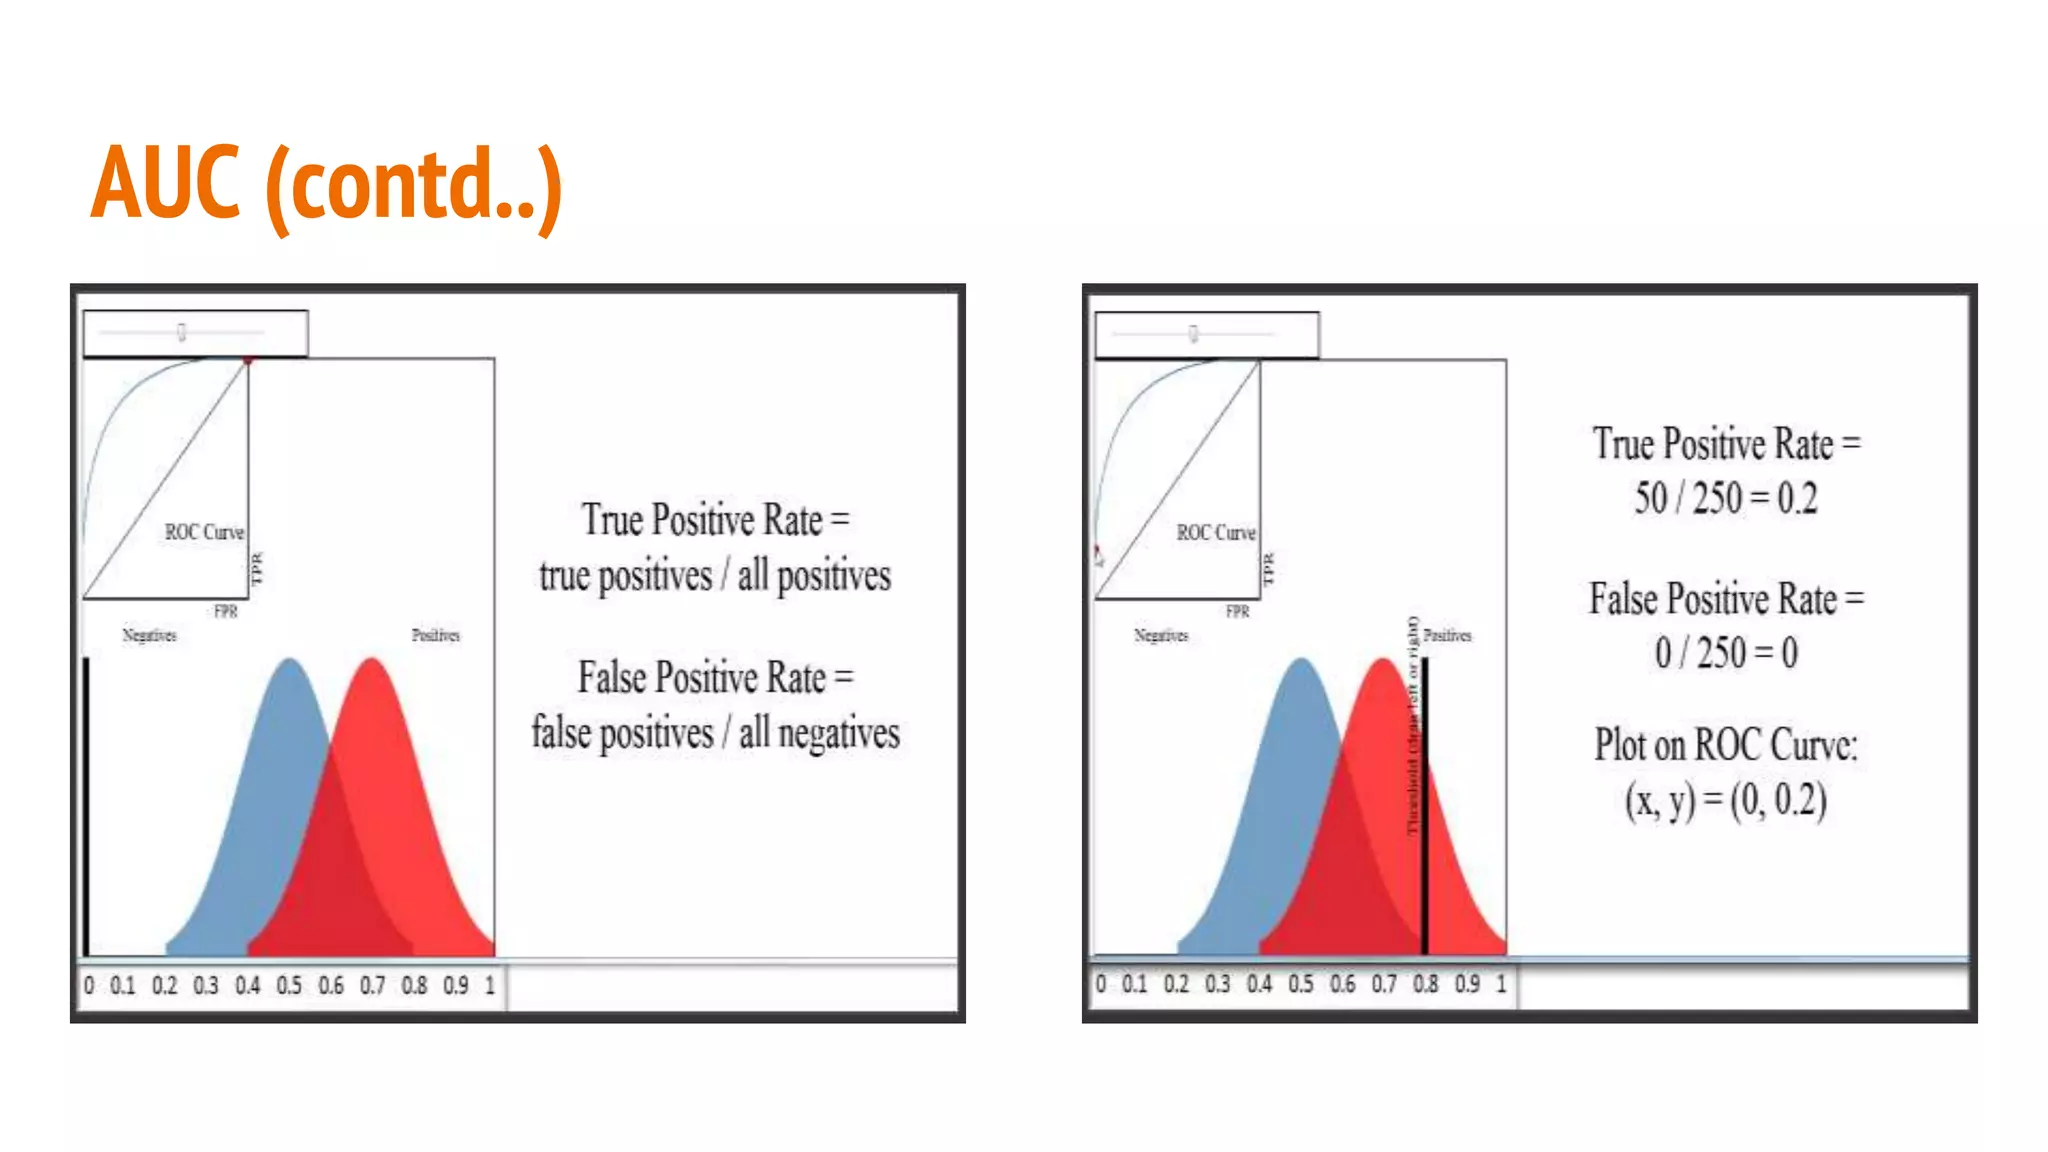
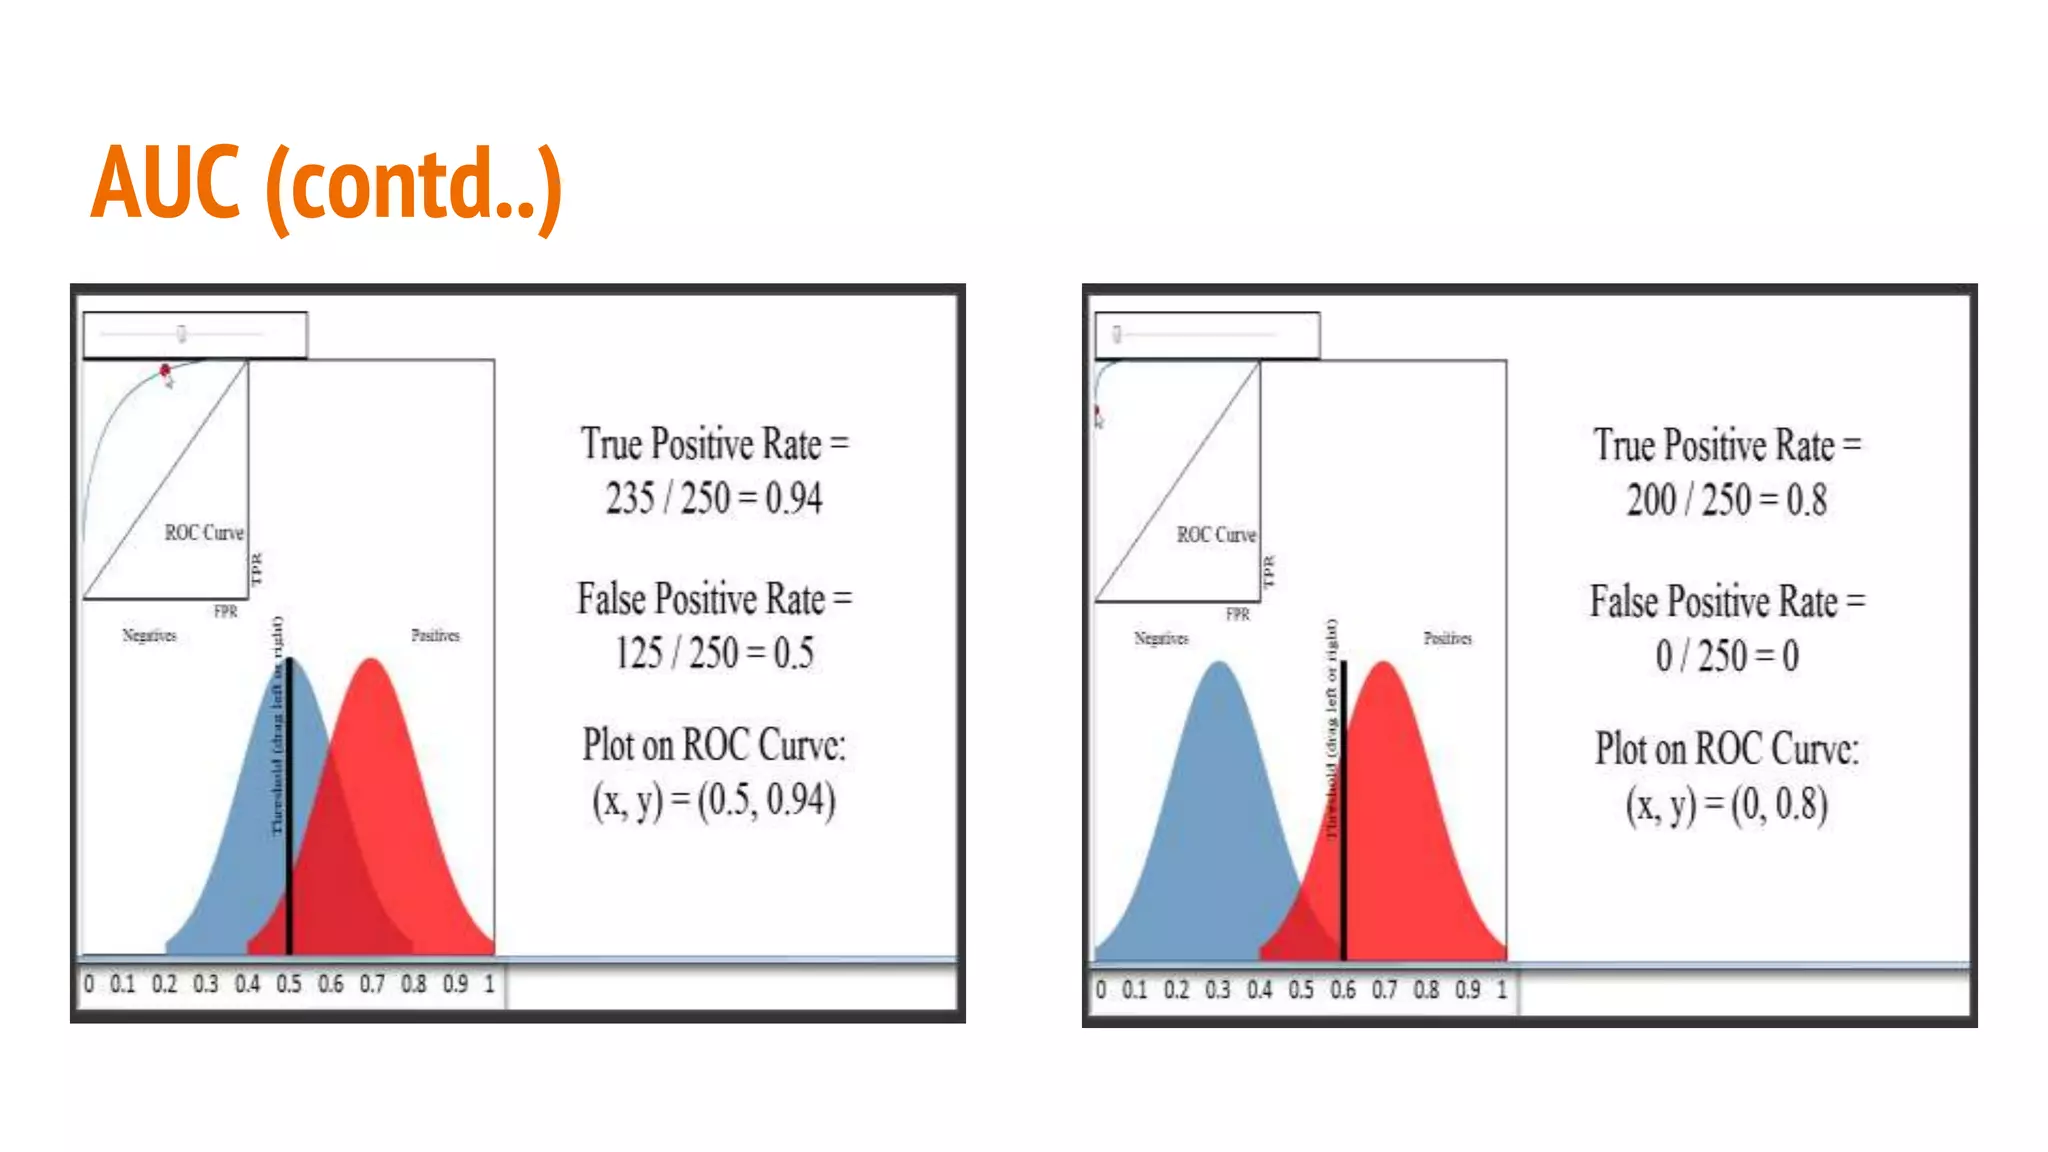
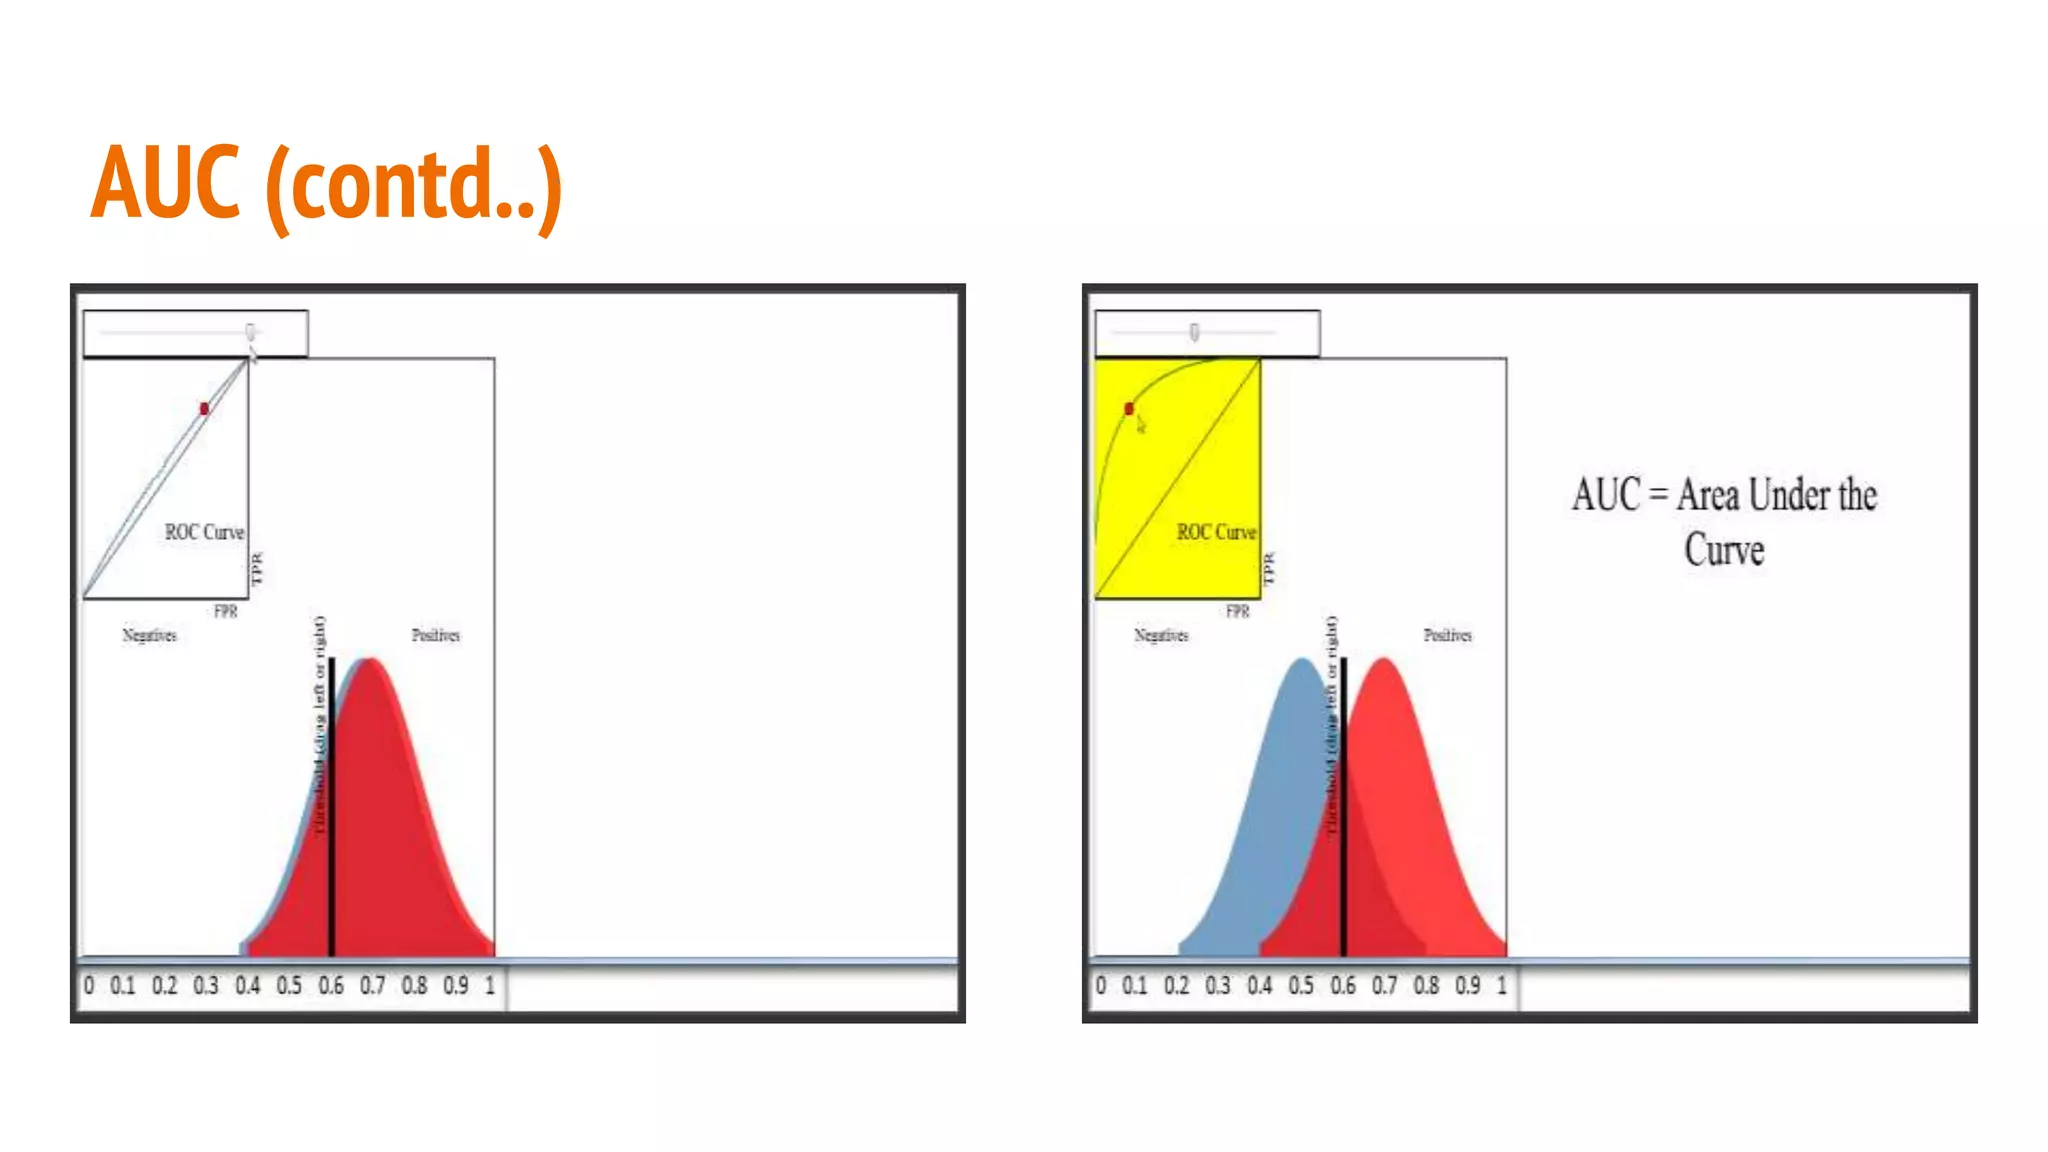
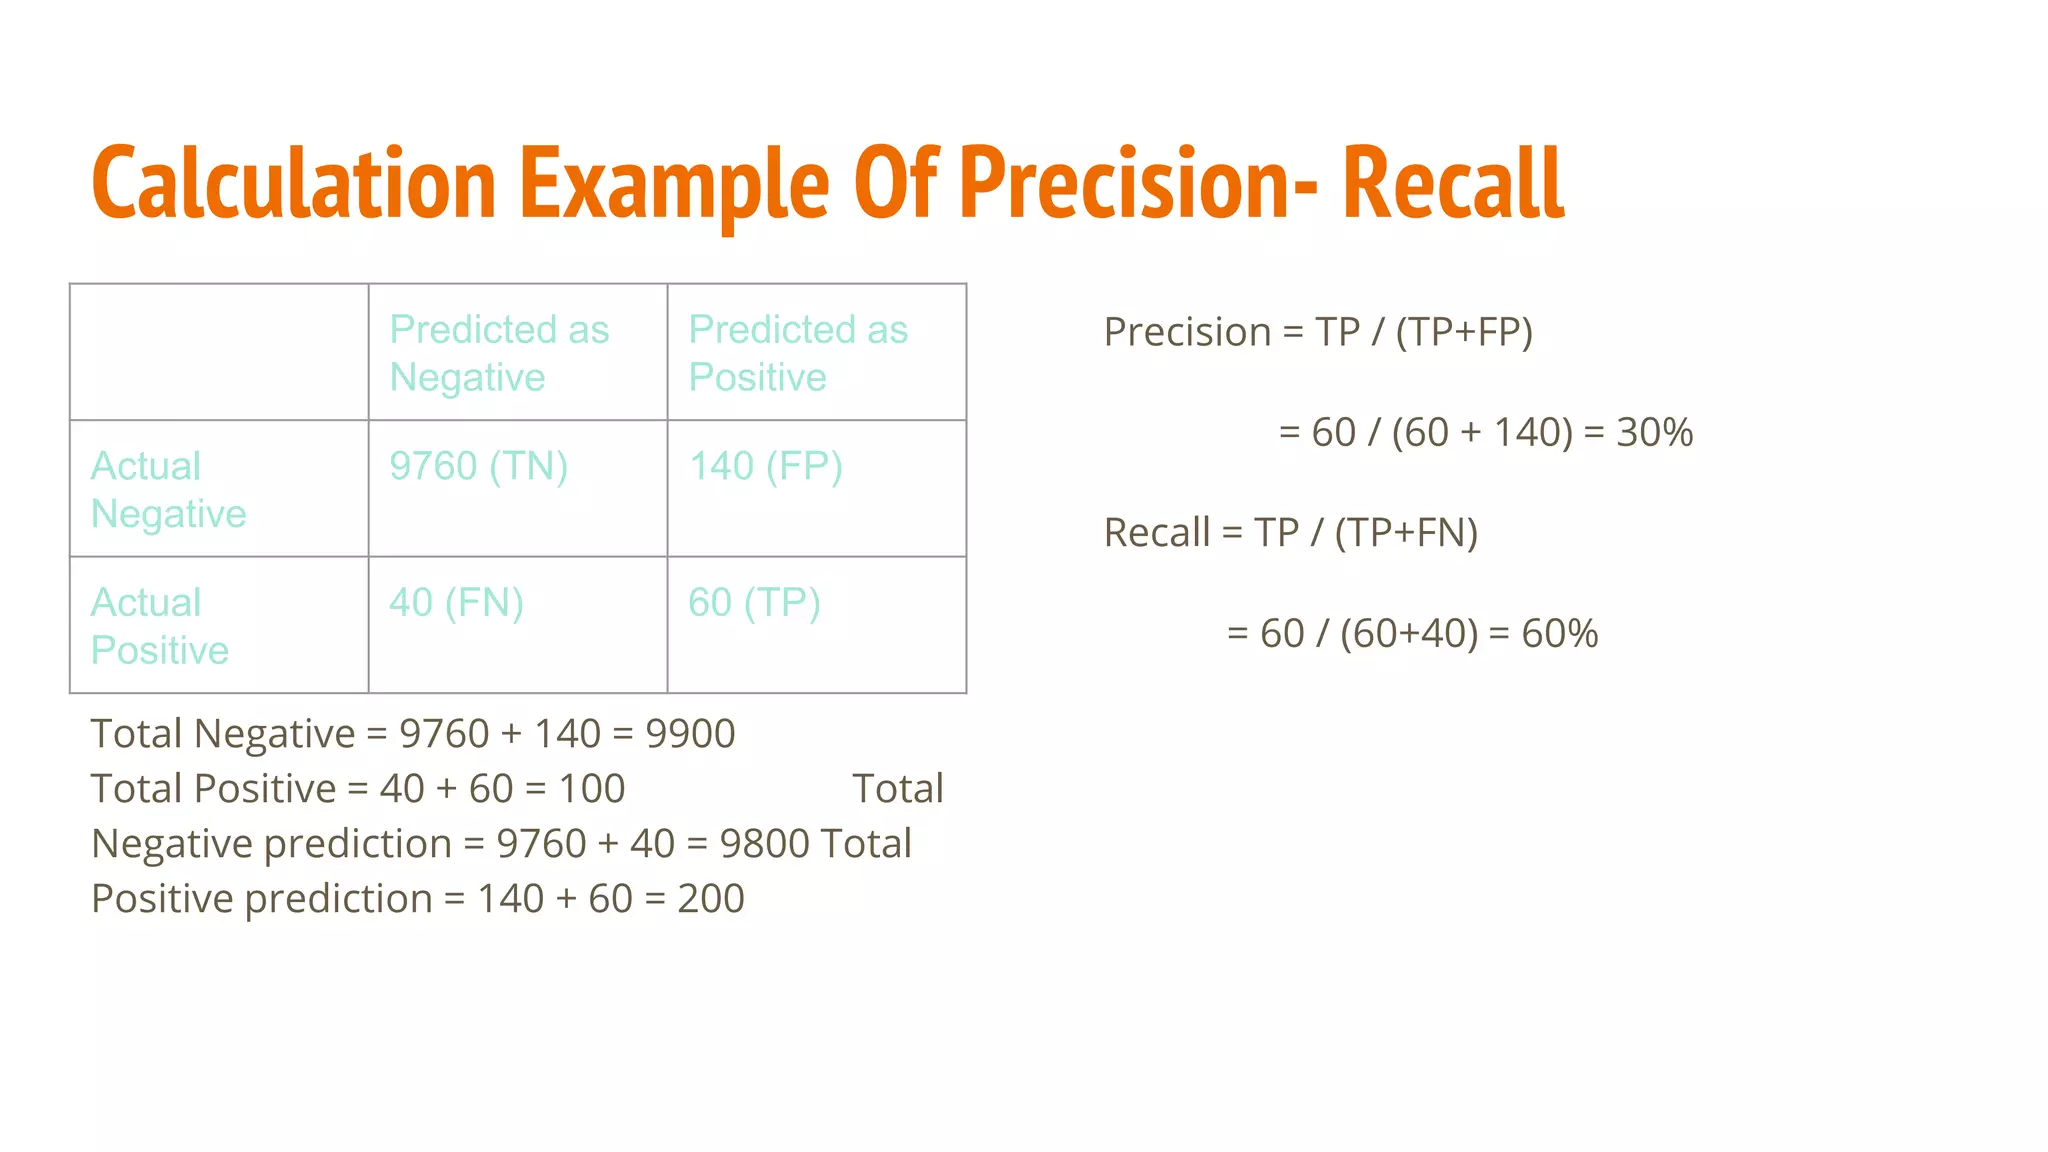
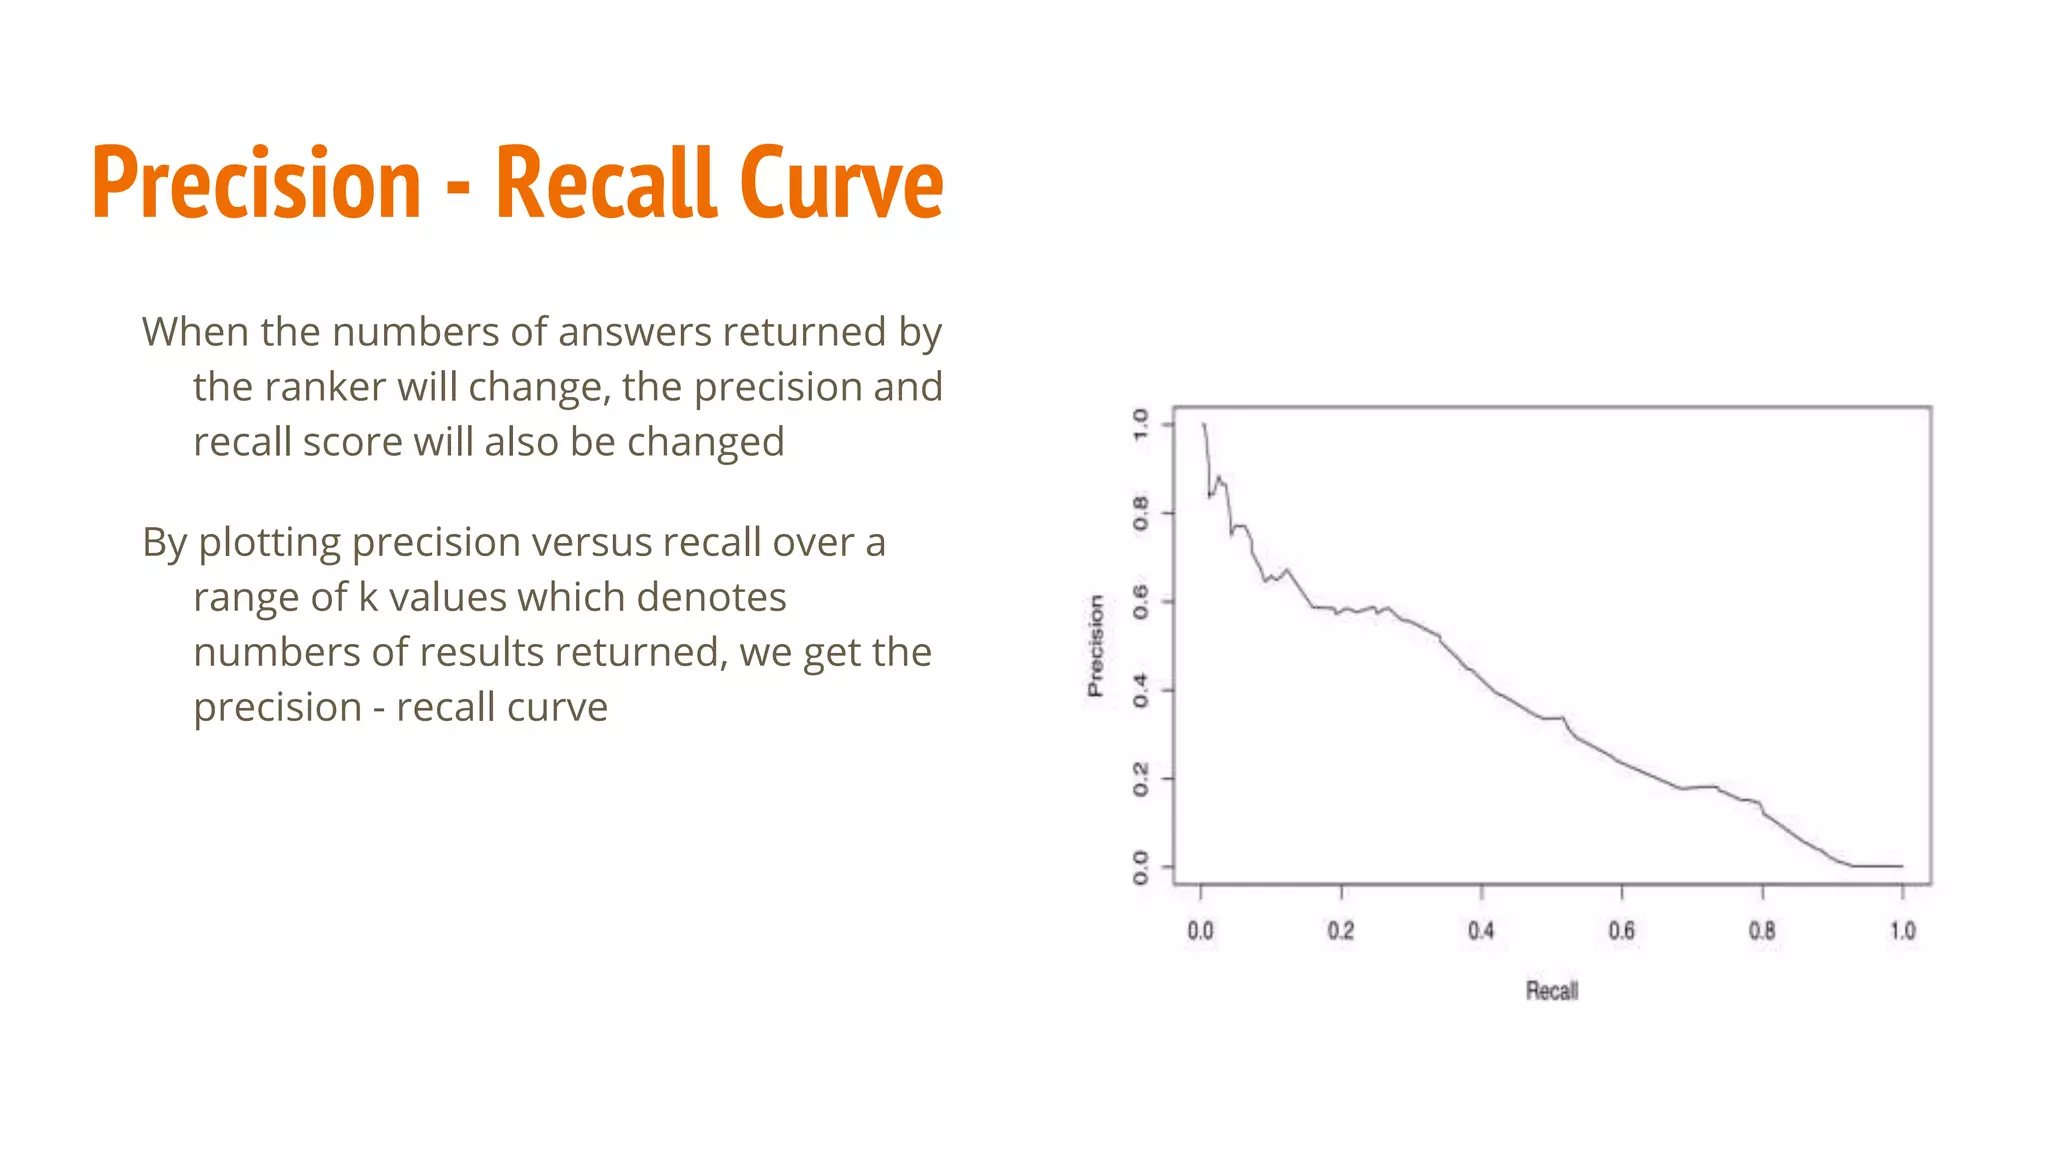
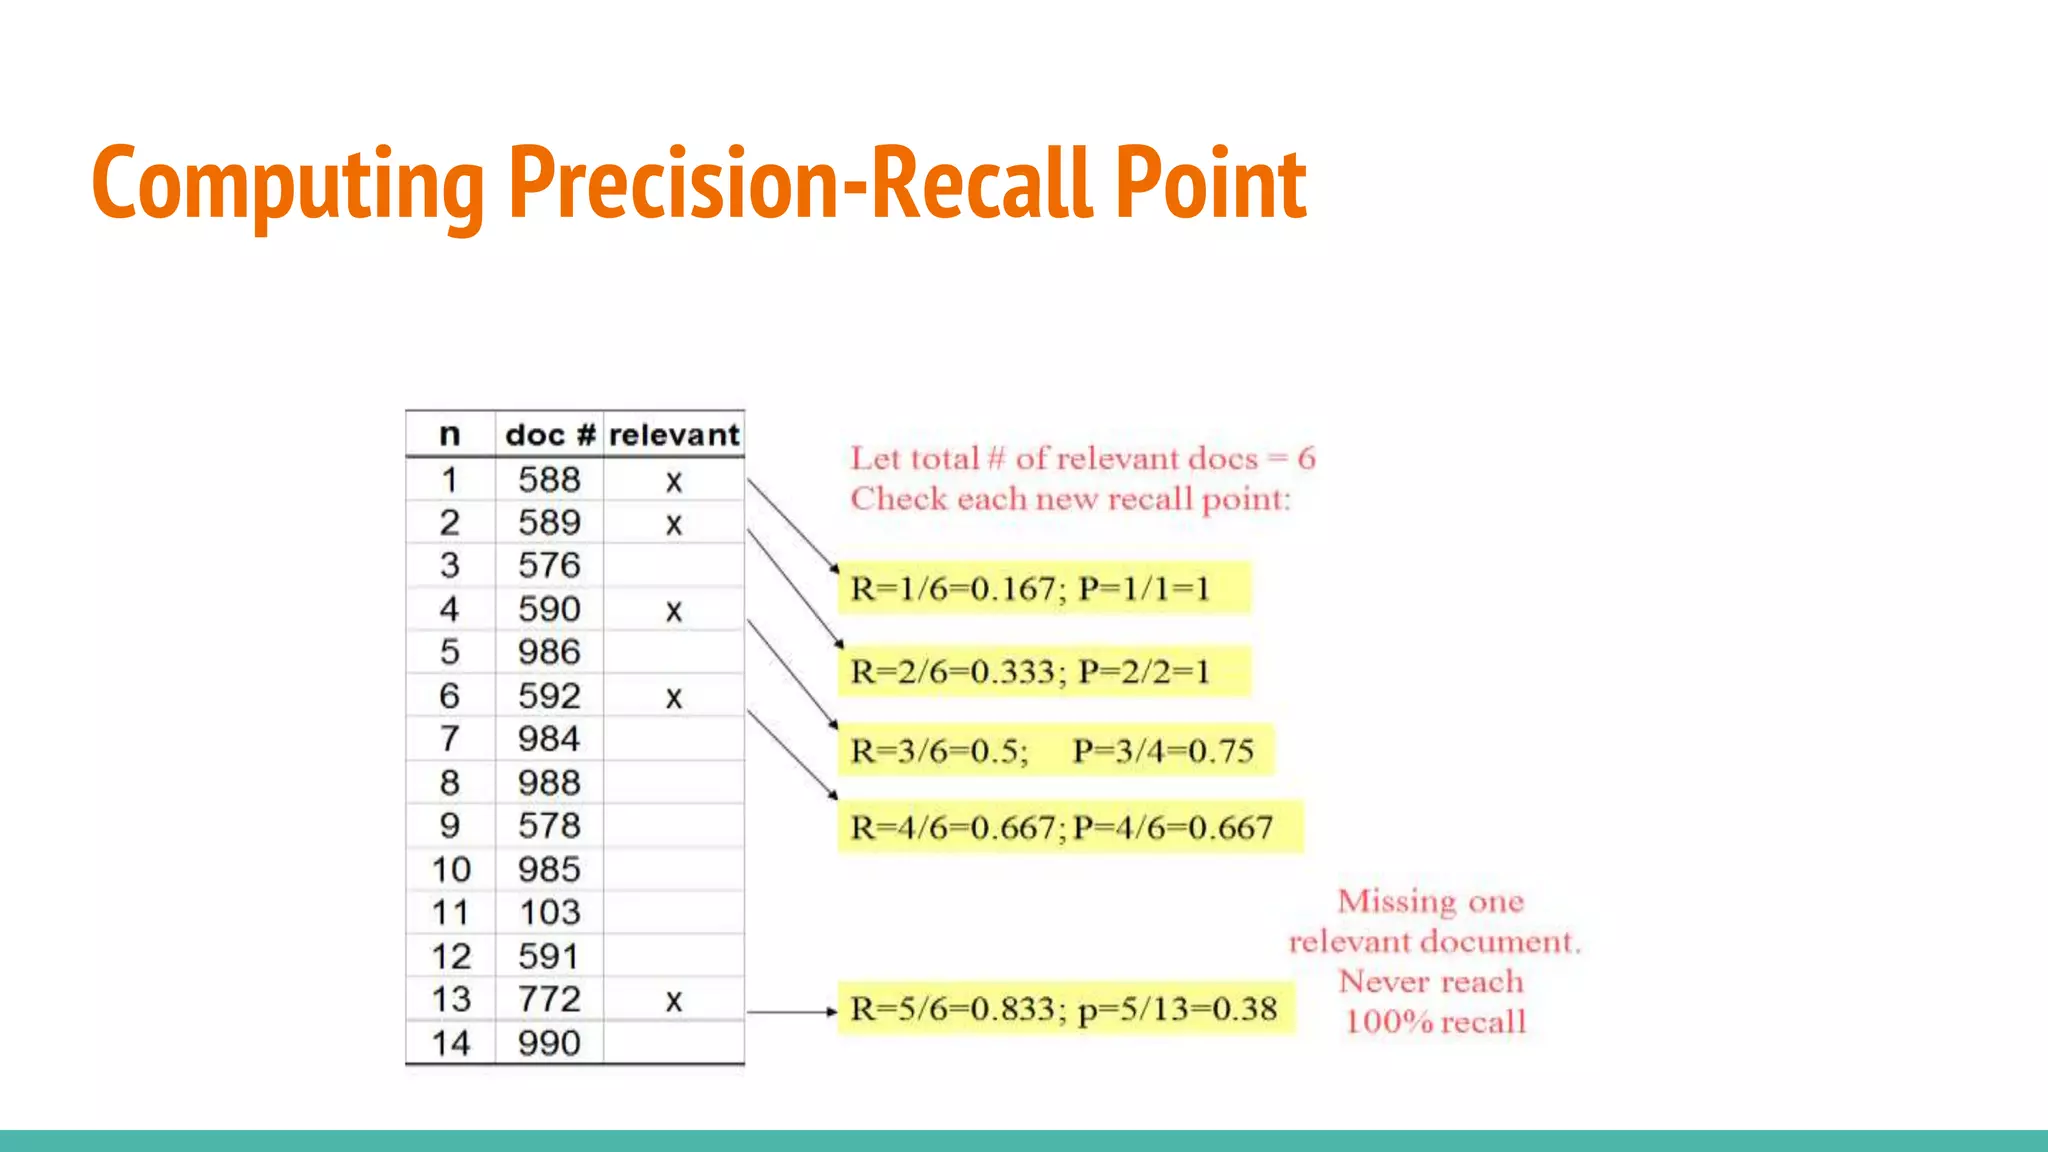
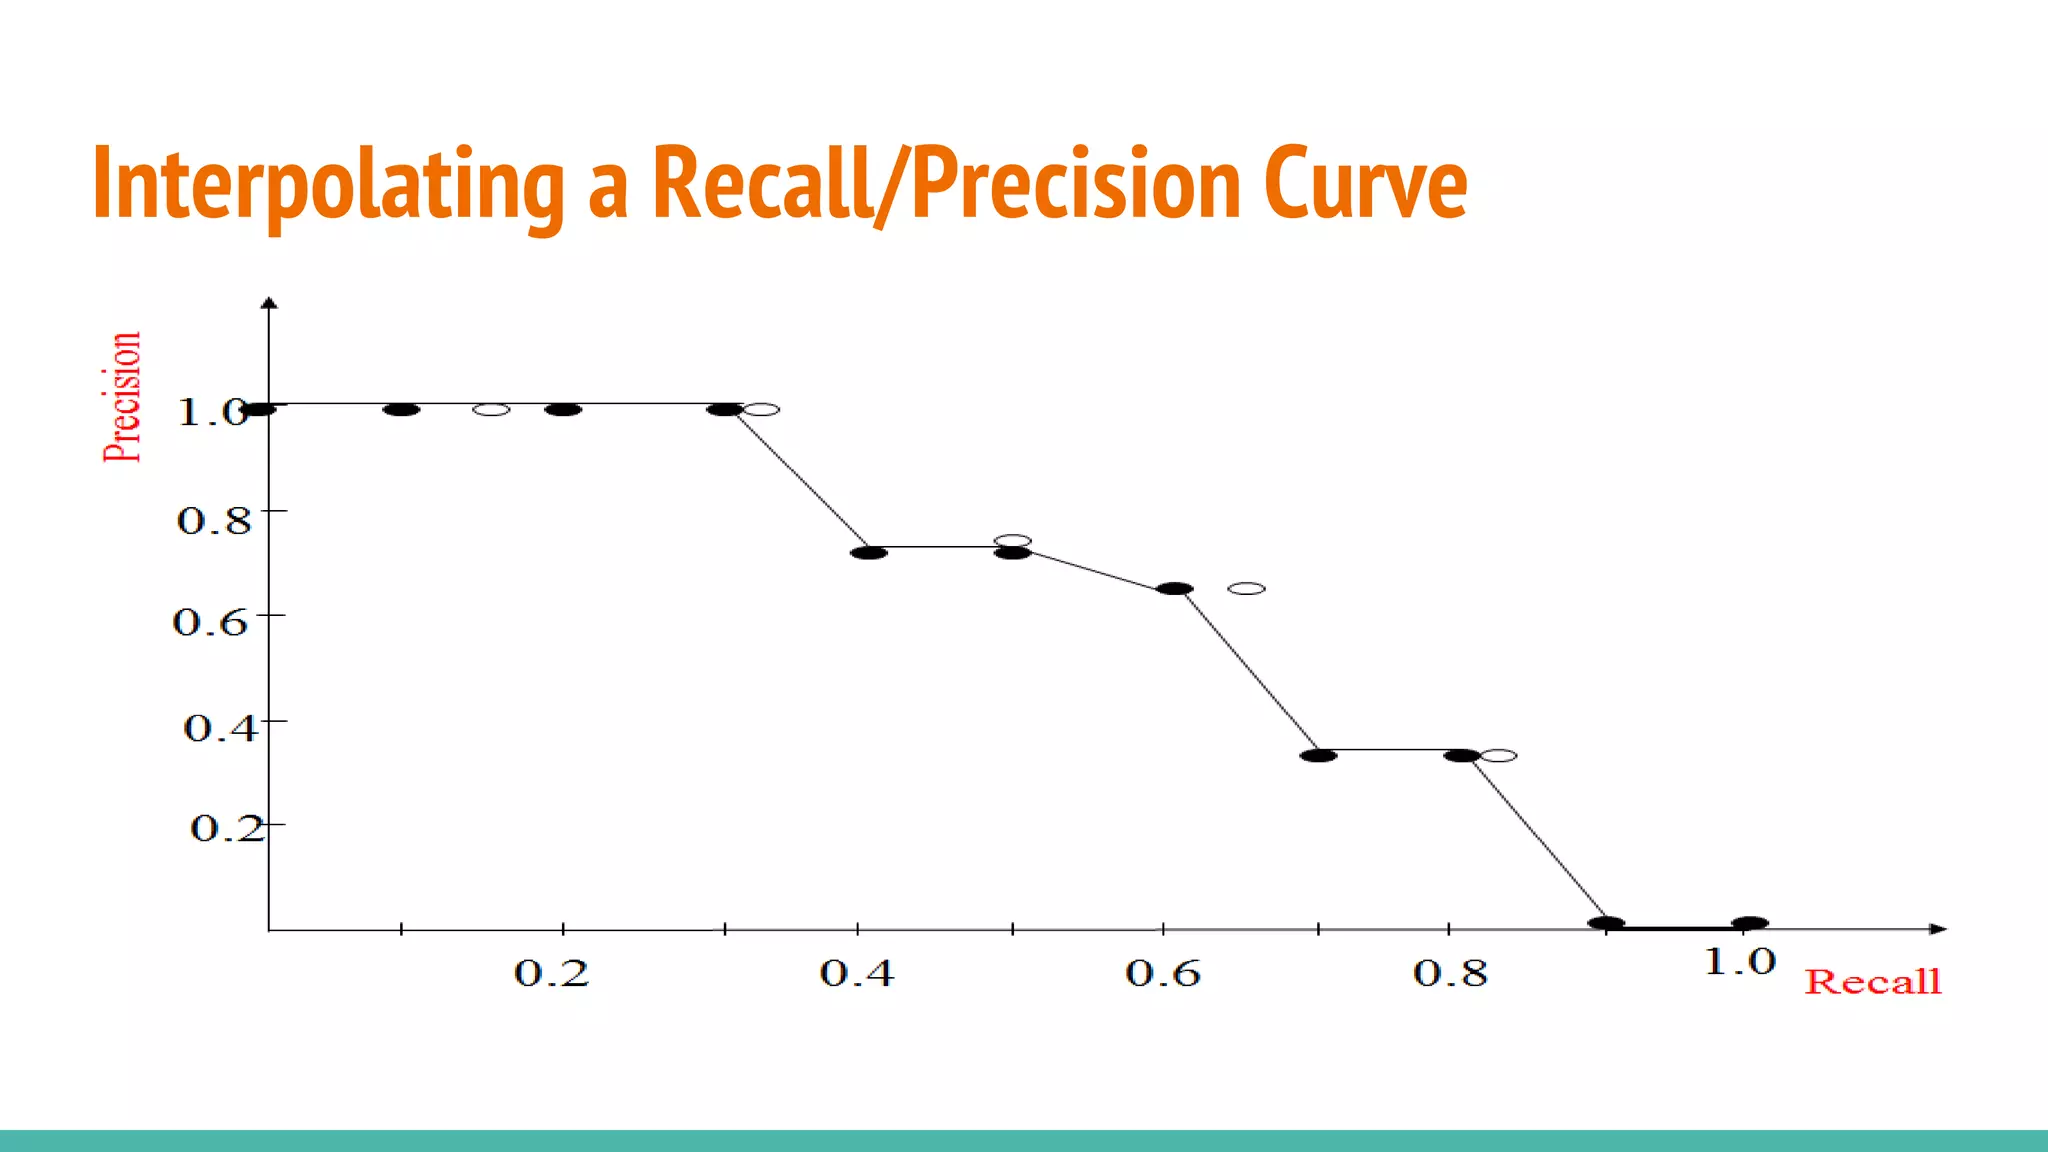
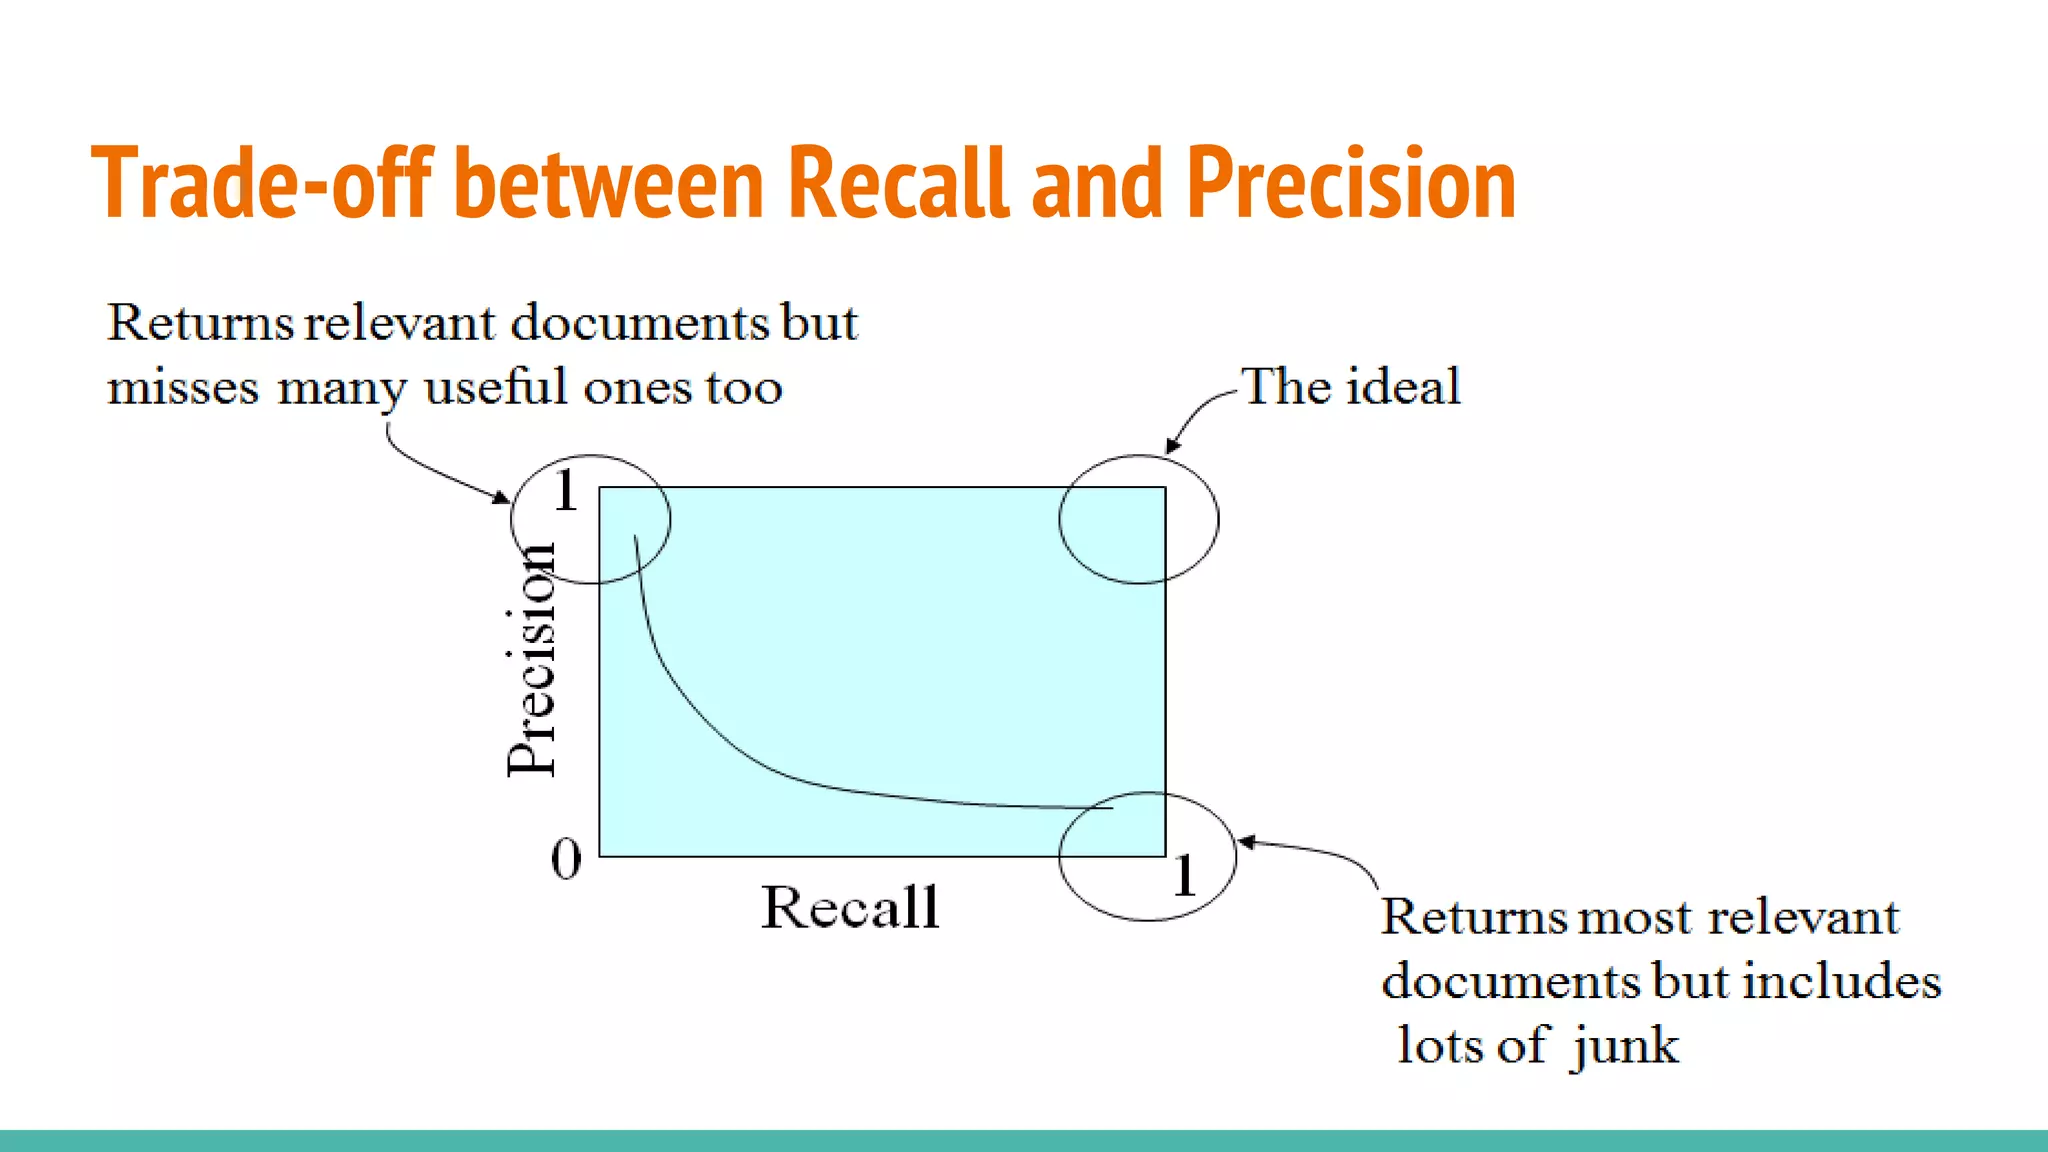
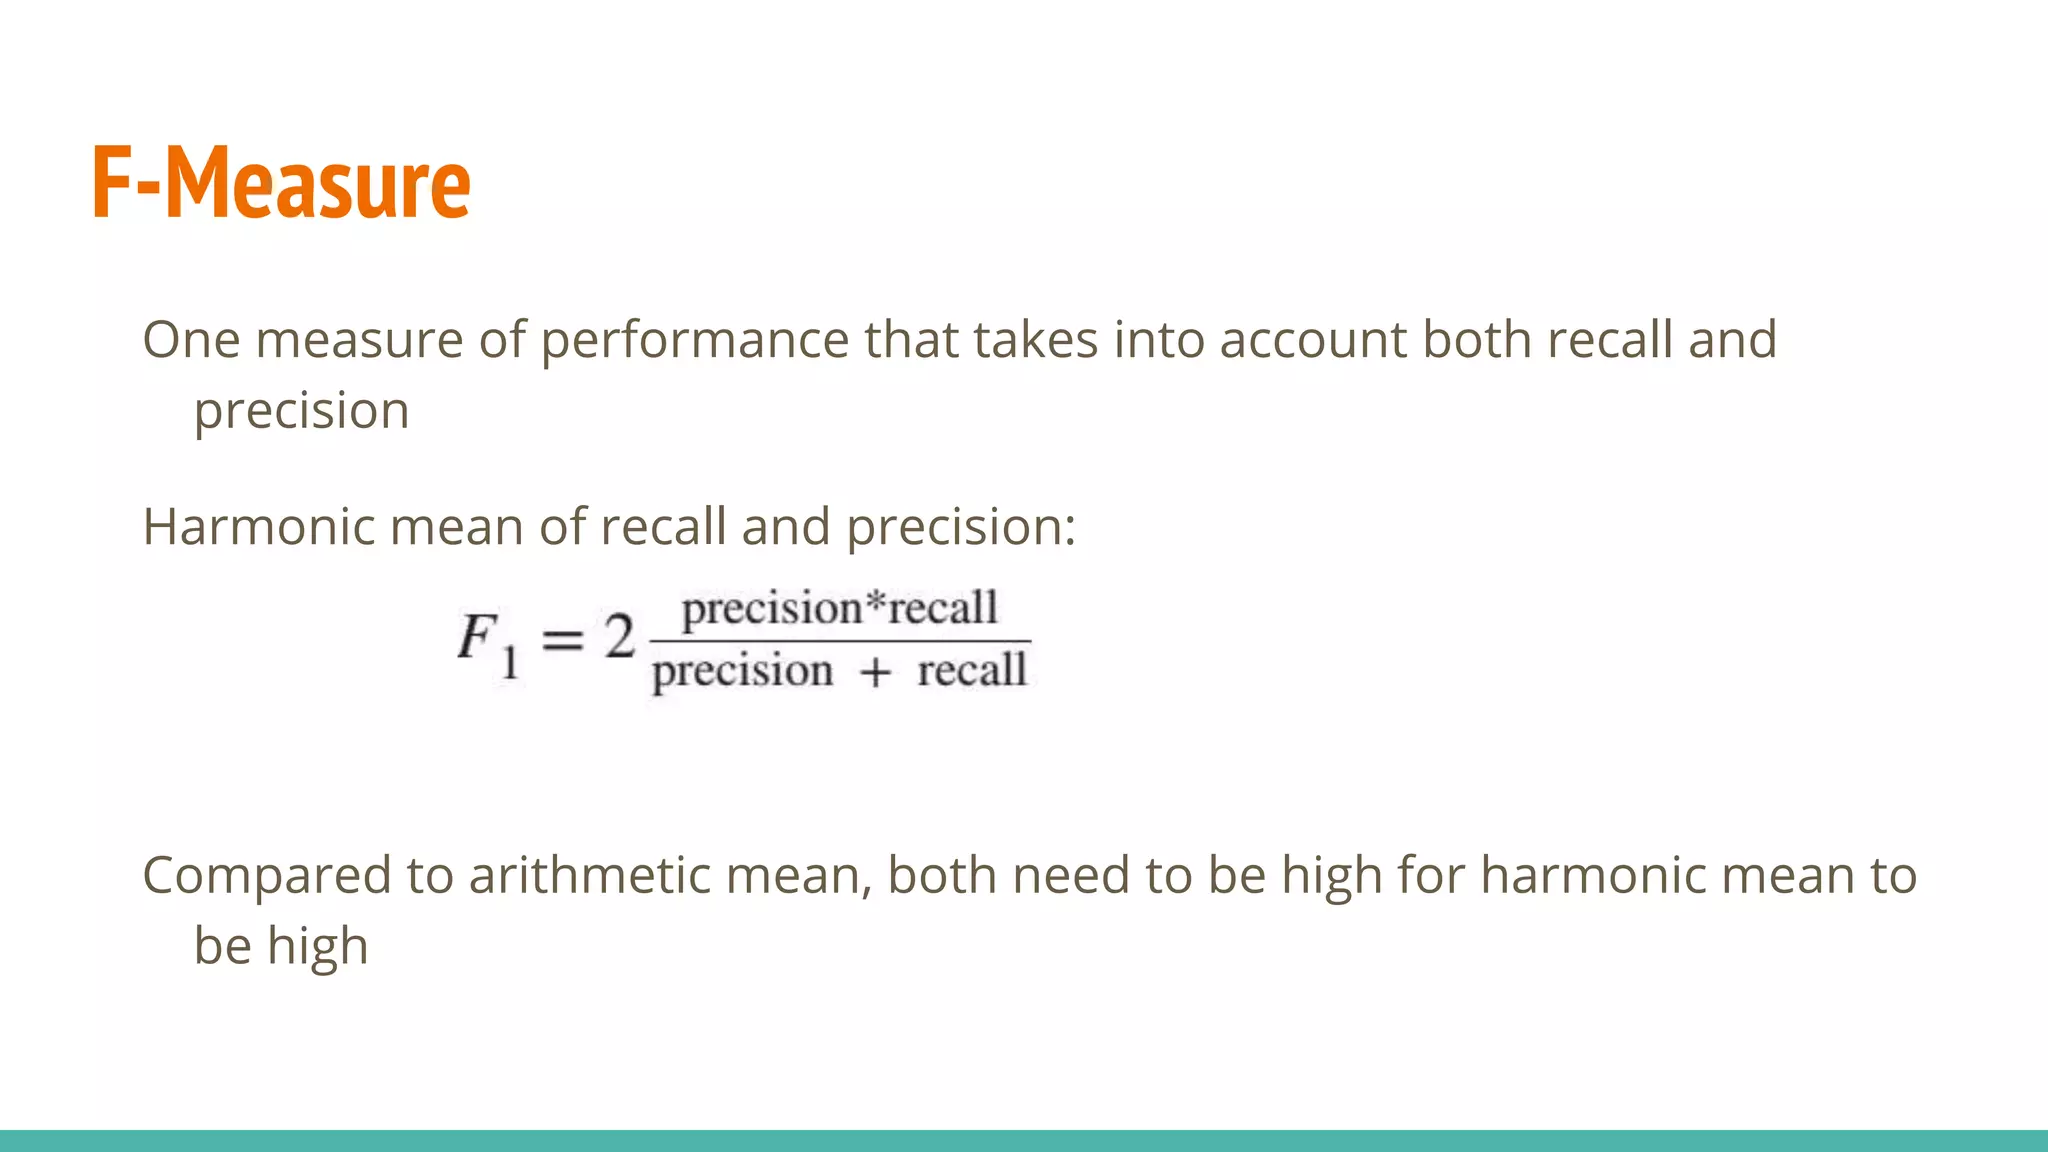
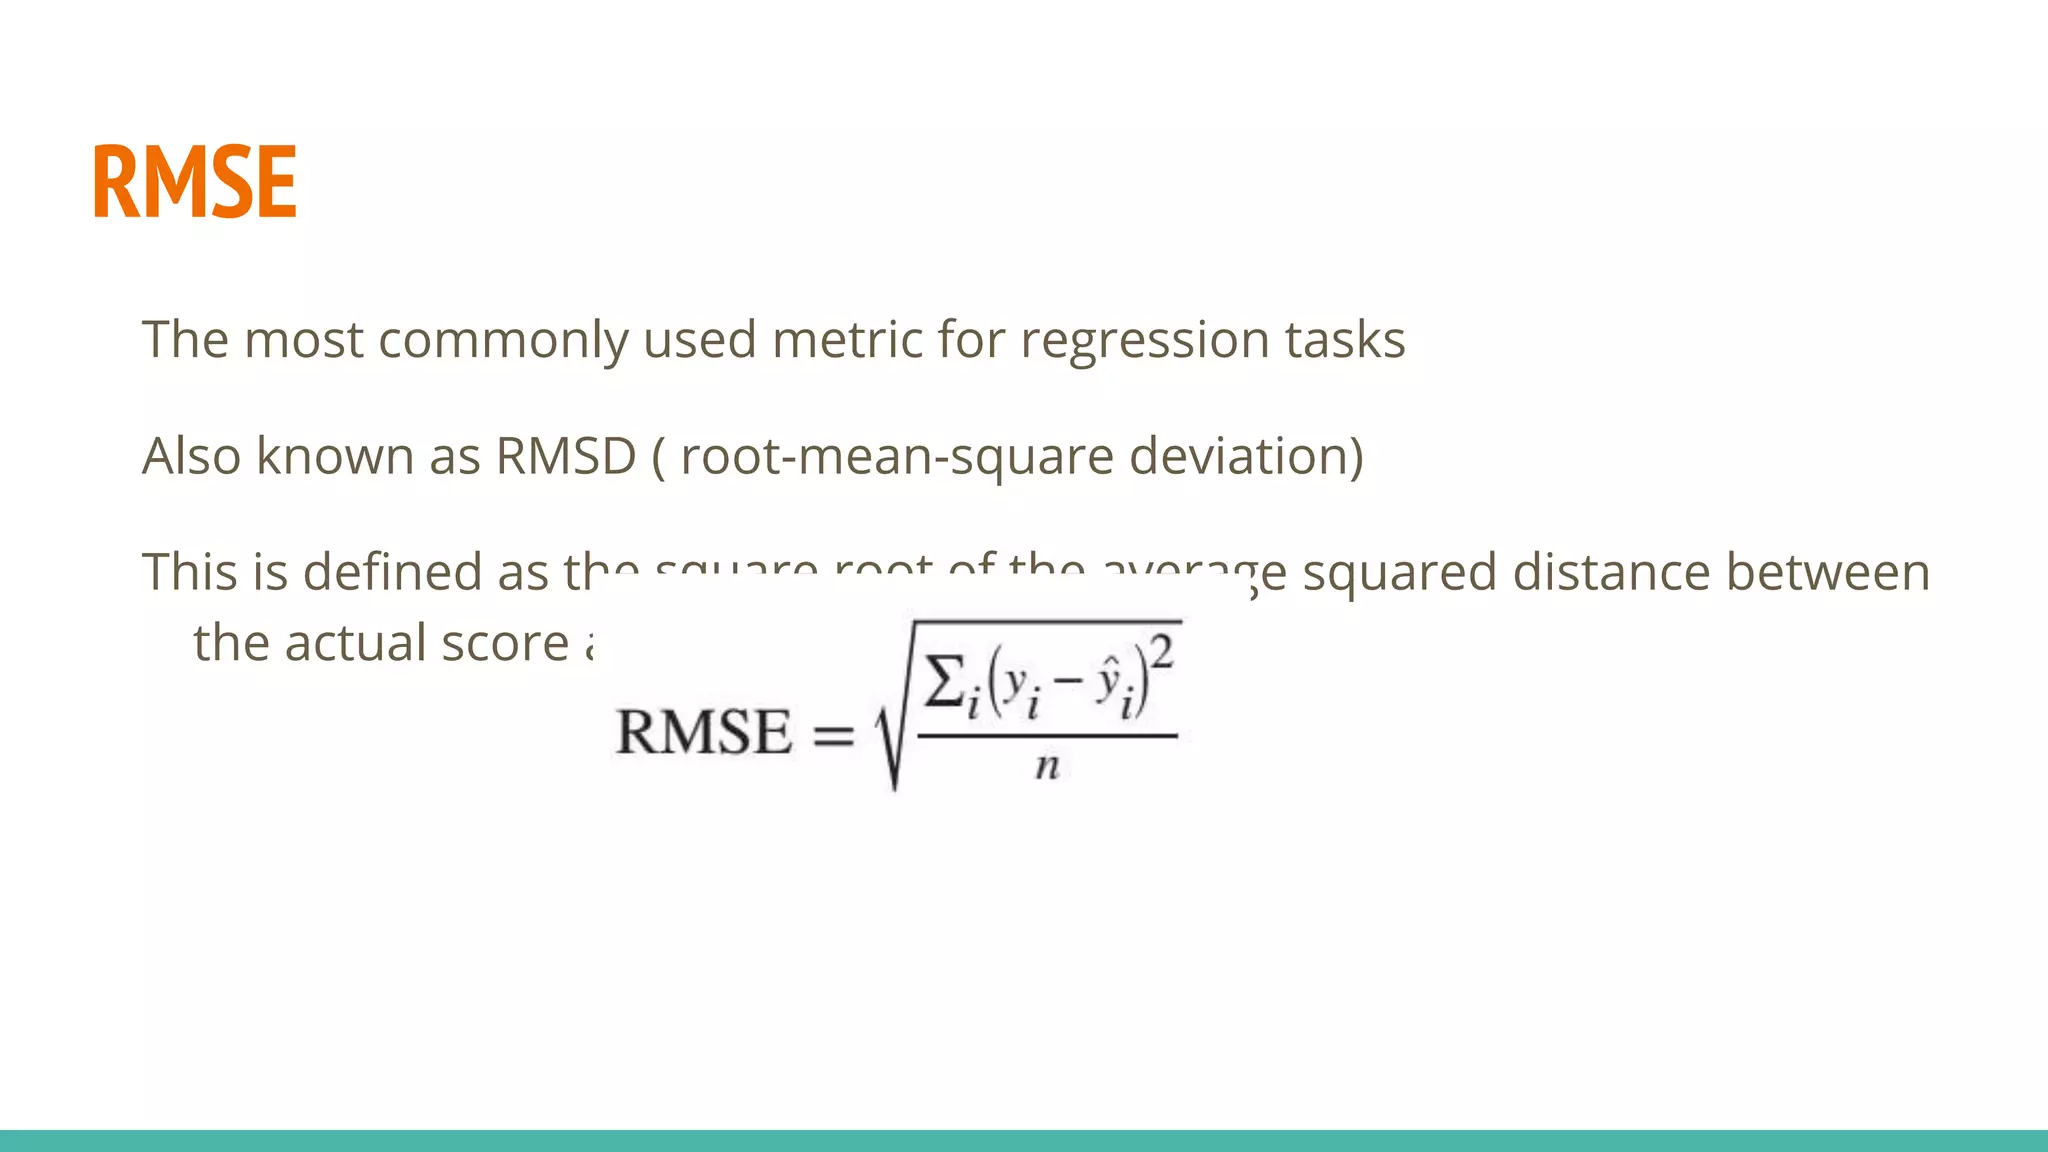
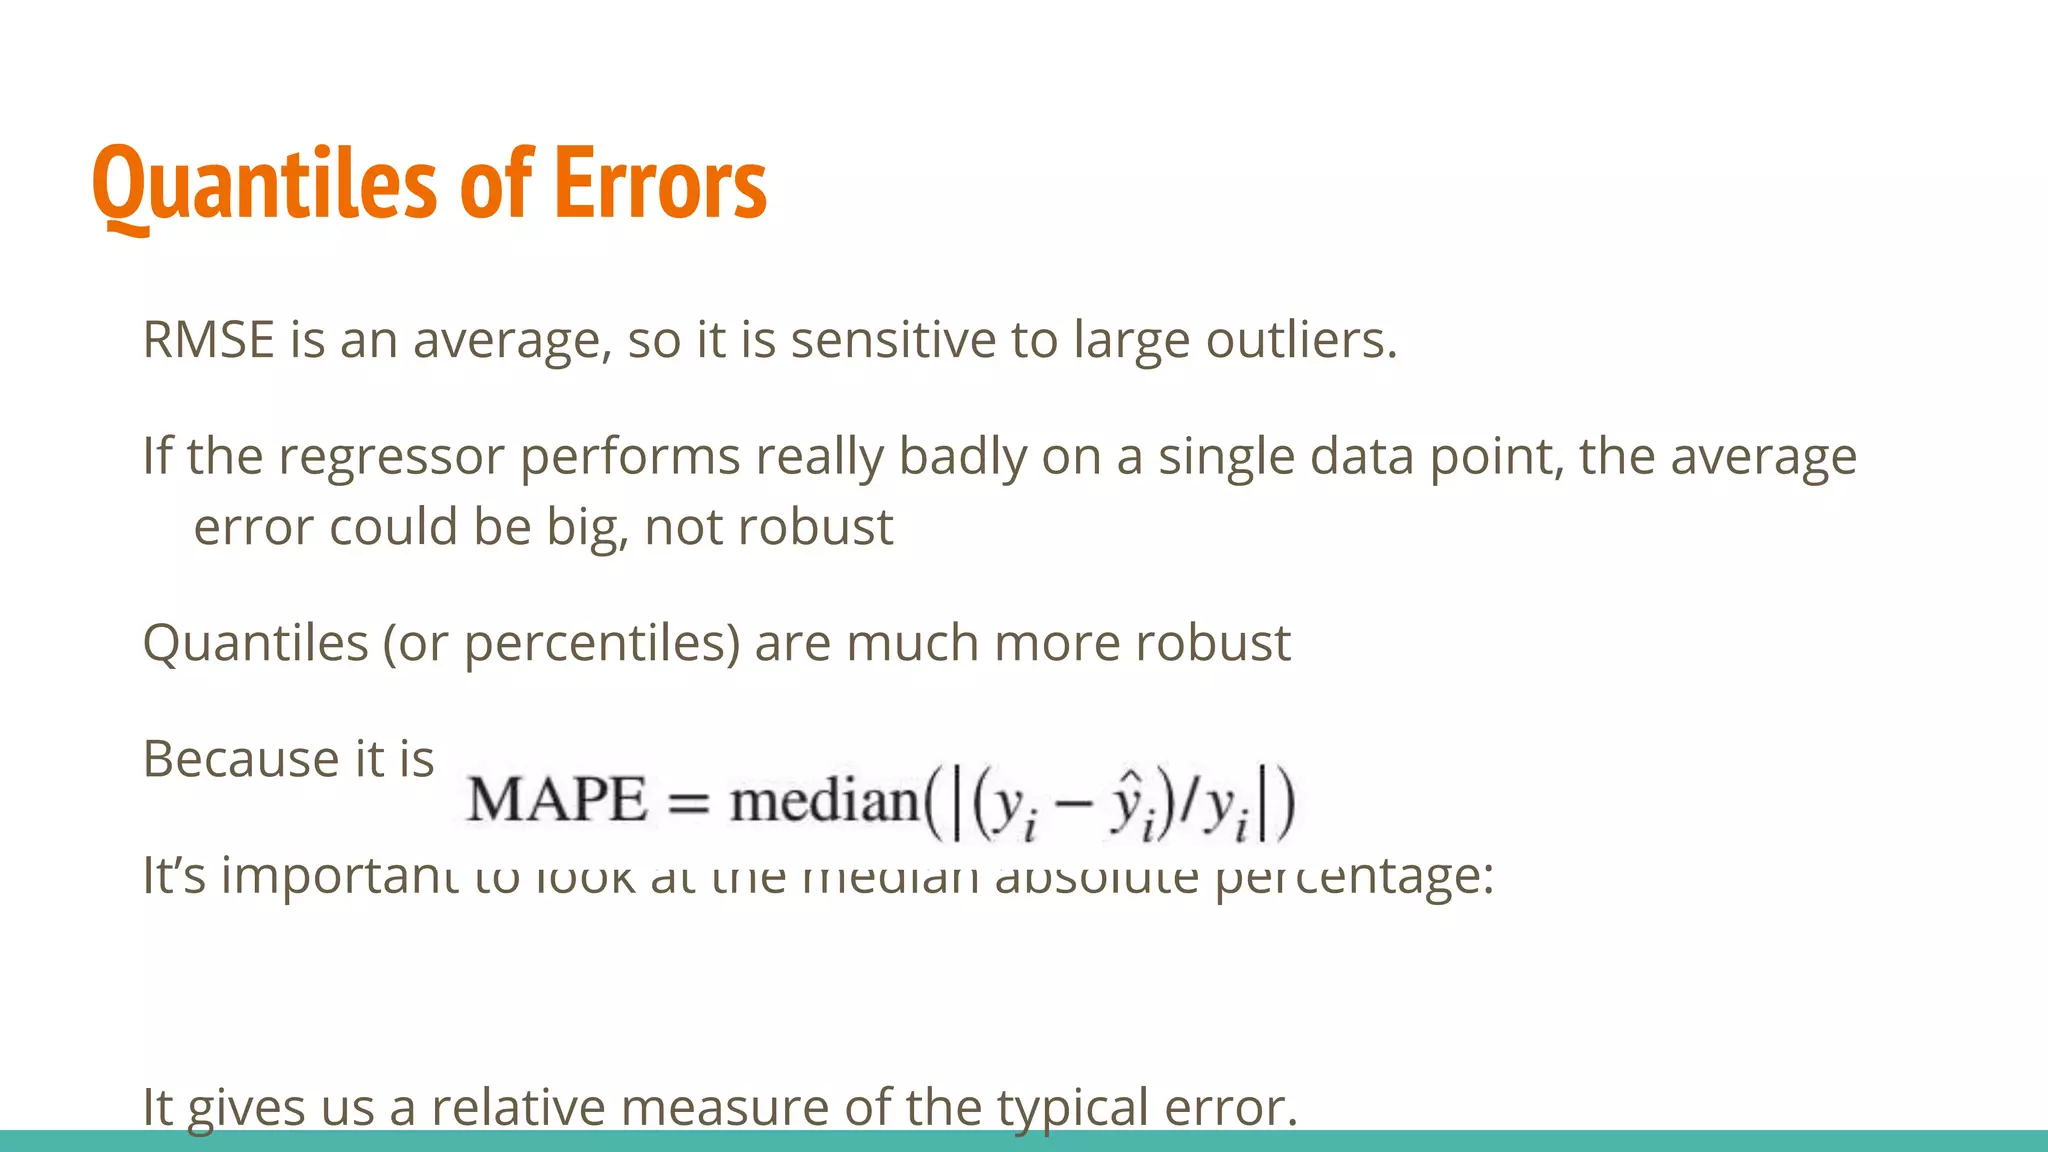


This document discusses various machine learning evaluation metrics for supervised learning models. It covers classification, regression, and ranking metrics. For classification, it describes accuracy, confusion matrix, log-loss, and AUC. For regression, it discusses RMSE and quantiles of errors. For ranking, it explains precision-recall, precision-recall curves, F1 score, and NDCG. The document provides examples and visualizations to illustrate how these metrics are calculated and used to evaluate model performance.


![PERFORMANCE_PREDICTION__PARAMETERS[1].pptx](https://cdn.slidesharecdn.com/ss_thumbnails/performancepredictionparameters1-240130171305-9f984922-thumbnail.jpg?width=640&height=640&fit=bounds)


