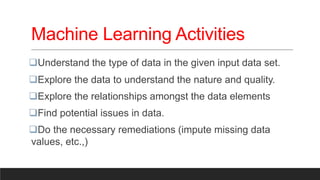
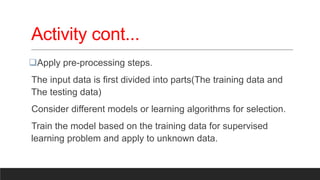
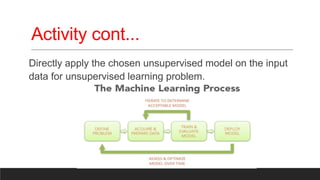
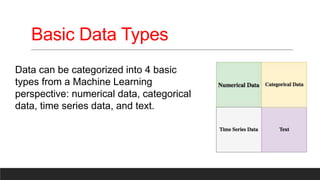
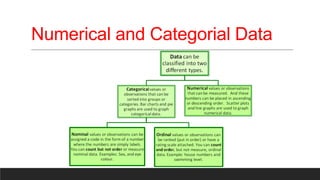
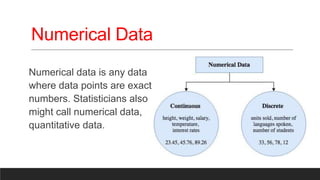
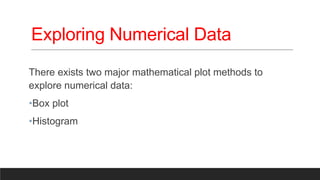
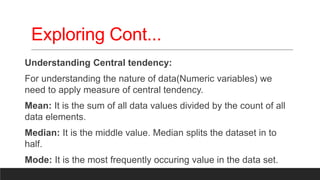
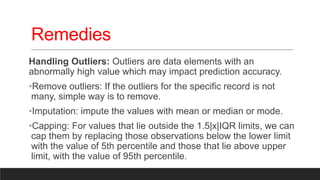
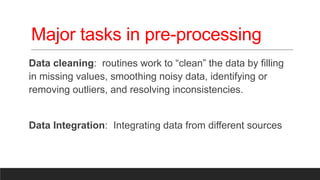
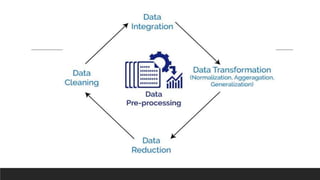
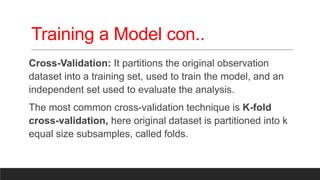
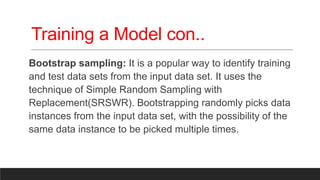
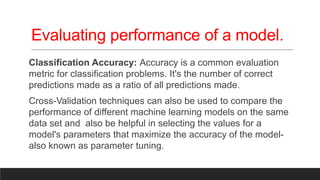
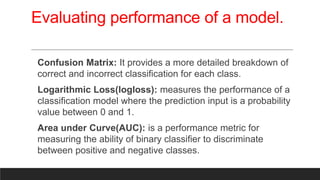
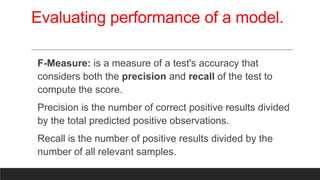
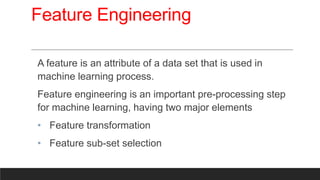
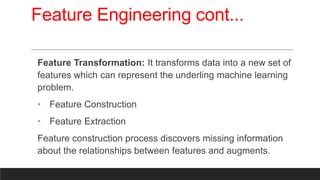
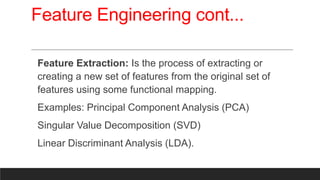
3. Machine Learning Activities
Understand the type of data in the given input data set.
Explore the data to understand the nature and quality.
Explore the relationships amongst the data elements
Find potential issues in data.
Do the necessary remediations (impute missing data
values, etc.,)
4. Activity cont...
Apply pre-processing steps.
The input data is first divided into parts(The training data and
The testing data)
Consider different models or learning algorithms for selection.
Train the model based on the training data for supervised
learning problem and apply to unknown data.
6. Basic Data Types
Data can be categorized into 4 basic
types from a Machine Learning
perspective: numerical data, categorical
data, time series data, and text.
8. Numerical Data
Numerical data is any data
where data points are exact
numbers. Statisticians also
might call numerical data,
quantitative data.
9. Exploring Numerical Data
There exists two major mathematical plot methods to
explore numerical data:
•Box plot
•Histogram
10. Exploring Cont...
Understanding Central tendency:
For understanding the nature of data(Numeric variables) we
need to apply measure of central tendency.
Mean: It is the sum of all data values divided by the count of all
data elements.
Median: It is the middle value. Median splits the dataset in to
half.
Mode: It is the most frequently occuring value in the data set.
11. Exploring Cont...
Measuring the Dispersion of Data (Range, Quartiles, Interquartile
Range):
Let x1,x2....,xN be a set of observations for some numeric attribute, X.
The range of the set is the difference between the largest(max()) and
the smallest (min()) values.
Quartiles: are points taken at regular intervals of data distribution,
dividing it into essentially equal size consecutive sets.
Interquartile range: The distance between the first and third quartiles
is a measure of spread that gives the range covered by the middle
half of the data.
12. Variance and Standard Deviation
These are measures of data dispersion. And it indicates that
how spread out a data distribution is.
A low standard deviation means that the data observations
observations tend to be very close to the mean, while high
high standard deviation indicates that the data are spread out
spread out over a large range of values.
16. Relationship between variables
Scatter-plots and two-way cross tabulation can be
effectively used.
Scatter- plots: a graph in which the values of two variables are
plotted along two axes, the pattern of the resulting points
revealing any correlation present.
17. Relationship Cont...
Two-way cross tabulation: It is also known as cross-tab, are
used to understand the relationship of two categorical attributes
in a concise way.
It has a matrix format that presents a summarized view of the
bivariate frequency distribution. It is much similar to scatter plot,
helps to understand how much the data values of the attribute
changes with the change in data values of another attributes.
18. Data Issues
Day by day we are generating tremendous amount of
data. Dealing with big data is much more complicated.
Real-world databases are highly susceptible to noisy,
missing, and inconsistent data due to their typically huge
size (often several gigabytes or more) and their likely origin
from multiple, heterogenous sources
19. Issues cont...
In accurate, incomplete, and inconsistent data are common-
place properties of large real-world databases and warehouses.
Main reasons for inaccurate data
• Having incorrect attribute values.
• The data collection instruments used may be faulty.
• There may have been human or computer errors
occurring at data entry.
20. Issues cont...
• Users may purposely submit incorrect data values for
mandatory fields when they do not wish to submit
personal information.
• Errors in data transmission can also occur.
• Inconsistent formats for input fields.
21. Remedies
Handling Outliers: Outliers are data elements with an
abnormally high value which may impact prediction accuracy.
•Remove outliers: If the outliers for the specific record is not
many, simple way is to remove.
•Imputation: impute the values with mean or median or mode.
•Capping: For values that lie outside the 1.5|x|IQR limits, we can
cap them by replacing those observations below the lower limit
with the value of 5th percentile and those that lie above upper
limit, with the value of 95th percentile.
22. Remedies Cont...
Handling Missing Values:
• Eliminate records having a missing value of data elements.
• Imputing missing values using mean/median/mode.
• Fill the missing value manually.
• Use the global constant to fill the missing value.
• Use the most probable value to fill in the missing value.
23. Major tasks in pre-processing
Data cleaning: routines work to “clean” the data by filling
in missing values, smoothing noisy data, identifying or
removing outliers, and resolving inconsistencies.
Data Integration: Integrating data from different sources
24.
25. Pre Processing Cont...
Data Transformation: It is the process of converting data
from one format to another.
Data reduction: obtains a reduced representation of the
data set that is much smaller in volume, yet produces the
same (or almost the same) analytical results. Data
reduction strategies include dimensionality reduction and
numerosity reduction.
26. Model
Abstraction is a significant step as it represents raw input
data in a summarized and structured format, such that a
meaningful insight is obtained from the data. This
structured representation of raw input data to the
meaningful pattern is called a Model.
27. Model Selection
Models for supervised learning try to predict certain values
using the input data set.
Models for unsupervised learning used to describe a data
set or gain insight from a data set.
28. Model Training
The process of assigning a model, and fitting a specific
model to a data set is called model Training.
Bias: If the outcome of a model is systematically incorrect,
the learning is said to have a bias.
29. Model Representation &
Interpretability
Fitness of a target function approximated by a learning
algorithm determines how correctly it is able to classify a
set of data it has never seen.
Underfitting:
If the target function is kept too simple, it may not be able to
capture the essential nuances and represent the underlying
data well. This is known as underfitting.
30. Model Representation &
Interpretability Cont...
Overfitting:
Where the model has been designed in such a way that it
emulates the training data too closely. In such a case any
specific nuance in the training data, like noise or outliers,
gets embedded in the model. It adversely impacts the
performance of the model on the test data.
31. Model Representation &
Interpretability Cont...
Bias and Variance:(Supervised learning)
Errors due to bias arise from simplifying assumptions made
by the model whereas errors due to variance occur from
over-aligning the model with the training data sets.
32. Training a model.
Model evaluation aims to estimate the generalization
accuracy of a model on future data.
There exists two methods for evaluating model's
performance:
• Holdout
• Cross-validation
33. Training a model
Holdout: It tests a model on different data than it was
trained on. In this method the data set is divided into three
subsets:
• Training set: is a subset of the dataset used to build
predictive models.
• Validation set: is a subset of the dataset used to assess
the performance of the model built in the training phase.
34. Training a model con...
• Test set(unseen data): is a subset of the dataset used to
assess the likely future performance of a model.
The holdout approach is useful because of its speed,
simplicity, and flexibility.
35. Training a Model con..
Cross-Validation: It partitions the original observation
dataset into a training set, used to train the model, and an
independent set used to evaluate the analysis.
The most common cross-validation technique is K-fold
cross-validation, here original dataset is partitioned into k
equal size subsamples, called folds.
36. Training a Model con..
Bootstrap sampling: It is a popular way to identify training
and test data sets from the input data set. It uses the
technique of Simple Random Sampling with
Replacement(SRSWR). Bootstrapping randomly picks data
instances from the input data set, with the possibility of the
same data instance to be picked multiple times.
37. Evaluating performance of a model.
Classification Accuracy: Accuracy is a common evaluation
metric for classification problems. It's the number of correct
predictions made as a ratio of all predictions made.
Cross-Validation techniques can also be used to compare the
performance of different machine learning models on the same
data set and also be helpful in selecting the values for a
model's parameters that maximize the accuracy of the model-
also known as parameter tuning.
38. Evaluating performance of a model.
Confusion Matrix: It provides a more detailed breakdown of
correct and incorrect classification for each class.
Logarithmic Loss(logloss): measures the performance of a
classification model where the prediction input is a probability
value between 0 and 1.
Area under Curve(AUC): is a performance metric for
measuring the ability of binary classifier to discriminate
between positive and negative classes.
39. Evaluating performance of a model.
F-Measure: is a measure of a test's accuracy that
considers both the precision and recall of the test to
compute the score.
Precision is the number of correct positive results divided
by the total predicted positive observations.
Recall is the number of positive results divided by the
number of all relevant samples.
40. Feature Engineering
A feature is an attribute of a data set that is used in
machine learning process.
Feature engineering is an important pre-processing step
for machine learning, having two major elements
• Feature transformation
• Feature sub-set selection
41. Feature Engineering cont...
Feature Transformation: It transforms data into a new set of
features which can represent the underling machine learning
problem.
• Feature Construction
• Feature Extraction
Feature construction process discovers missing information
about the relationships between features and augments.
42. Feature Engineering cont...
Feature Extraction: Is the process of extracting or
creating a new set of features from the original set of
features using some functional mapping.
Examples: Principal Component Analysis (PCA)
Singular Value Decomposition (SVD)
Linear Discriminant Analysis (LDA).